

AllInWeb3
1.1k Posts

AllInWeb3
Report
Block User
Open Trade

BNB Holder
High-Frequency Trader
5.5 Years
61 Following
132 Followers
408 Liked
Posts
Portfolio
All
Quotes
·
--
【RAYSOLUSDT Tops Perpetual Gainers: Rising Volume and Open Interest Do Not Confirm Bullishness】
Short-term view: Watch $RAYSOL; don't chase the rally. At 22:01, a full scan of all 523/523 Binance USDⓈ-M USDT-margined perpetual contracts trading normally ranked RAYSOLUSDT first by gains, up 13.397% over 24 hours, at 2.4885, with approximately $120.6 million in quoted trading volume. At 22:04, the single-symbol interface updated to +14.536% and 2.5001. Rolling indicators change over time; the two quotes do not represent the actual gain over three minutes. Binance's official announcement identifies RAYSOLUSDT as Raydium (RAY), avoiding confusion between the contract code and another asset.
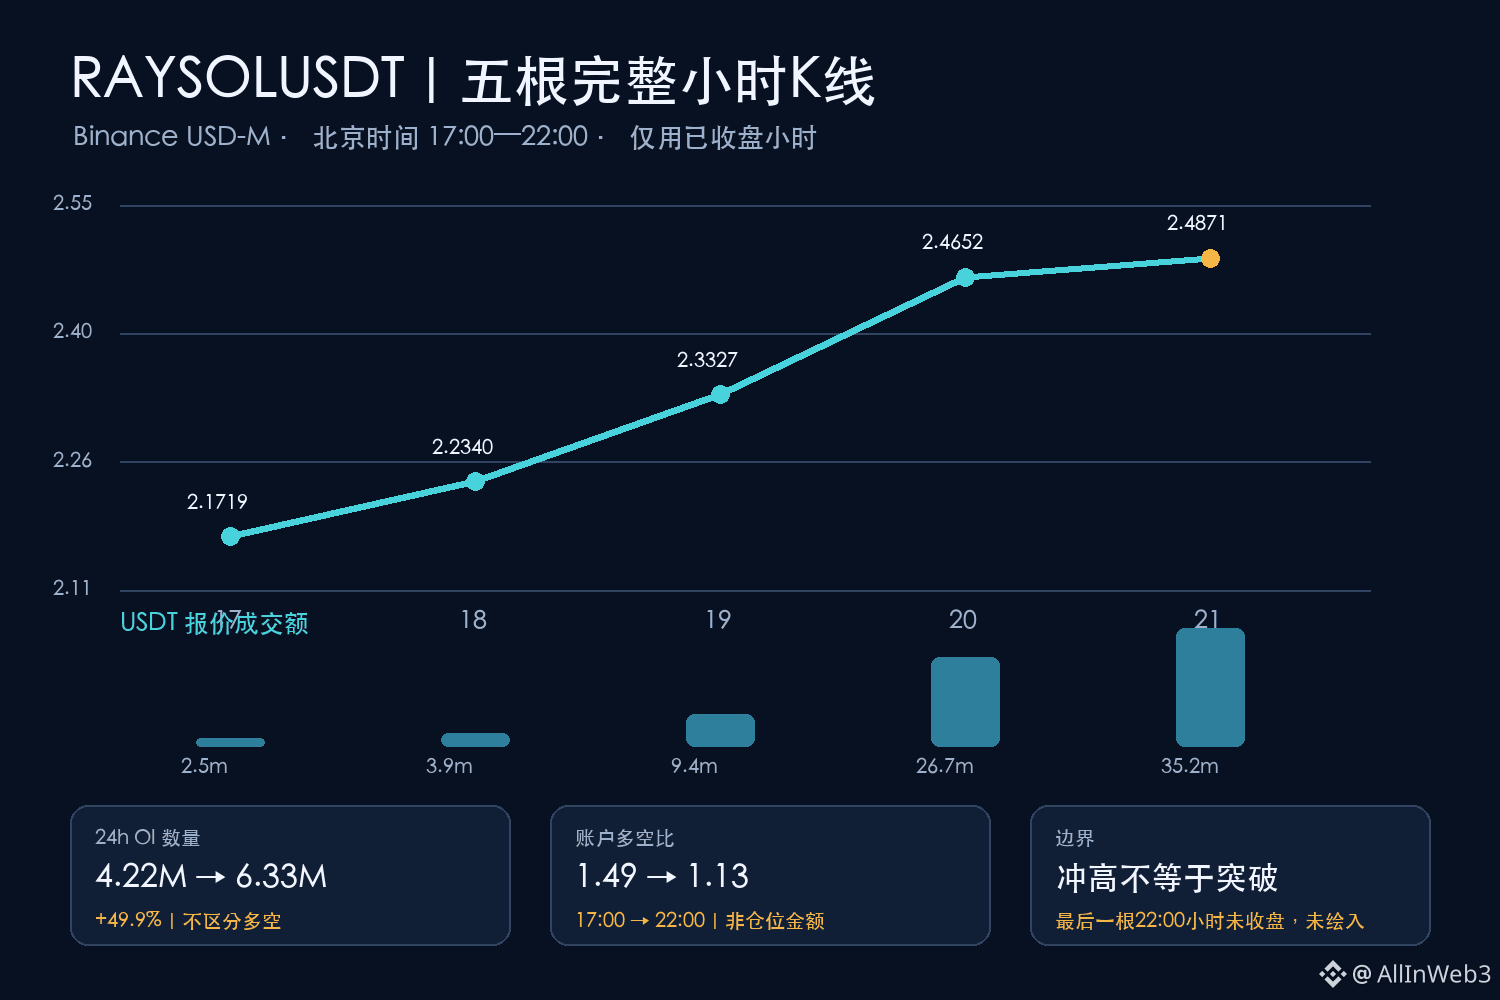
Across the five completed hourly candles from 17:00 to 22:00, the close rose from 2.1719 to 2.4871, a cumulative gain of about 14.5%. USDT-quoted trading volume climbed from $2.47 million to $35.22 million, with the latest hour up about 32% from the preceding hour. However, during 21:00–22:00, the price reached a high of 2.574 before closing at 2.4871, showing a notable pullback after the spike. Higher volume signals more trading activity, not proof of net buying.
Positioning data also needs to be considered separately: open interest rose from about 4.22 million tokens at 23:00 the previous day to about 6.33 million at 22:00 today, an increase of approximately 49.9%. Over the same period, the market-wide long/short account ratio fell from 1.49 at 17:00 to 1.13 at 22:00. Open interest does not distinguish between longs and shorts, and the account ratio does not reflect position size; neither can confirm direction on its own. The current funding-rate field shown by the interface at 22:04 did not match the historical value settled at 20:00, so this analysis does not use it to assess which side is crowded.
This review found no primary source confirming that a new announcement triggered today's gains, so it focuses solely on price, volume, and positioning. Next, watch whether a full hourly candle closes above 2.574 or breaks below 2.4101. These figures are simply the high and low of the most recent hour, not guaranteed support or resistance levels. For now, I'll watch rather than chase the rally. A pre-publication rescan of the overall market at 22:13:25 Beijing time still ranked it first, with a rolling 24-hour gain of +15.737%, a price of 2.5255, and approximately $124.5 million in quoted trading volume. This is an updated rolling snapshot, not a return on positions. Data is current as of 22:04–22:05 Beijing time; market prices and positioning will continue to change.
【RAYSOLUSDT Tops Perpetual Gainers: Rising Volume and Open Interest Do Not Confirm Bullishness】
Short-term view: Watch $RAYSOL ; don't chase the rally. At 22:01, a full scan of all 523/523 Binance USDⓈ-M USDT-margined perpetual contracts trading normally ranked RAYSOLUSDT first by gains, up 13.397% over 24 hours, at 2.4885, with approximately $120.6 million in quoted trading volume. At 22:04, the single-symbol interface updated to +14.536% and 2.5001. Rolling indicators change over time; the two quotes do not represent the actual gain over three minutes. Binance's official announcement identifies RAYSOLUSDT as Raydium (RAY), avoiding confusion between the contract code and another asset.
Across the five completed hourly candles from 17:00 to 22:00, the close rose from 2.1719 to 2.4871, a cumulative gain of about 14.5%. USDT-quoted trading volume climbed from $2.47 million to $35.22 million, with the latest hour up about 32% from the preceding hour. However, during 21:00–22:00, the price reached a high of 2.574 before closing at 2.4871, showing a notable pullback after the spike. Higher volume signals more trading activity, not proof of net buying.
Positioning data also needs to be considered separately: open interest rose from about 4.22 million tokens at 23:00 the previous day to about 6.33 million at 22:00 today, an increase of approximately 49.9%. Over the same period, the market-wide long/short account ratio fell from 1.49 at 17:00 to 1.13 at 22:00. Open interest does not distinguish between longs and shorts, and the account ratio does not reflect position size; neither can confirm direction on its own. The current funding-rate field shown by the interface at 22:04 did not match the historical value settled at 20:00, so this analysis does not use it to assess which side is crowded.
This review found no primary source confirming that a new announcement triggered today's gains, so it focuses solely on price, volume, and positioning. Next, watch whether a full hourly candle closes above 2.574 or breaks below 2.4101. These figures are simply the high and low of the most recent hour, not guaranteed support or resistance levels. For now, I'll watch rather than chase the rally. A pre-publication rescan of the overall market at 22:13:25 Beijing time still ranked it first, with a rolling 24-hour gain of +15.737%, a price of 2.5255, and approximately $124.5 million in quoted trading volume. This is an updated rolling snapshot, not a return on positions. Data is current as of 22:04–22:05 Beijing time; market prices and positioning will continue to change.
Short-term view: Watch $RAYSOL ; don't chase the rally. At 22:01, a full scan of all 523/523 Binance USDⓈ-M USDT-margined perpetual contracts trading normally ranked RAYSOLUSDT first by gains, up 13.397% over 24 hours, at 2.4885, with approximately $120.6 million in quoted trading volume. At 22:04, the single-symbol interface updated to +14.536% and 2.5001. Rolling indicators change over time; the two quotes do not represent the actual gain over three minutes. Binance's official announcement identifies RAYSOLUSDT as Raydium (RAY), avoiding confusion between the contract code and another asset.
Across the five completed hourly candles from 17:00 to 22:00, the close rose from 2.1719 to 2.4871, a cumulative gain of about 14.5%. USDT-quoted trading volume climbed from $2.47 million to $35.22 million, with the latest hour up about 32% from the preceding hour. However, during 21:00–22:00, the price reached a high of 2.574 before closing at 2.4871, showing a notable pullback after the spike. Higher volume signals more trading activity, not proof of net buying.
Positioning data also needs to be considered separately: open interest rose from about 4.22 million tokens at 23:00 the previous day to about 6.33 million at 22:00 today, an increase of approximately 49.9%. Over the same period, the market-wide long/short account ratio fell from 1.49 at 17:00 to 1.13 at 22:00. Open interest does not distinguish between longs and shorts, and the account ratio does not reflect position size; neither can confirm direction on its own. The current funding-rate field shown by the interface at 22:04 did not match the historical value settled at 20:00, so this analysis does not use it to assess which side is crowded.
This review found no primary source confirming that a new announcement triggered today's gains, so it focuses solely on price, volume, and positioning. Next, watch whether a full hourly candle closes above 2.574 or breaks below 2.4101. These figures are simply the high and low of the most recent hour, not guaranteed support or resistance levels. For now, I'll watch rather than chase the rally. A pre-publication rescan of the overall market at 22:13:25 Beijing time still ranked it first, with a rolling 24-hour gain of +15.737%, a price of 2.5255, and approximately $124.5 million in quoted trading volume. This is an updated rolling snapshot, not a return on positions. Data is current as of 22:04–22:05 Beijing time; market prices and positioning will continue to change.
44
·
--
$GTC: wait and see; don’t chase the price. In Binance’s full scan of USDT-margined perpetuals at 21:06:22, it ranked first by gains, up 13.028% over 24 hours. A single-token market snapshot at 21:07 showed 0.18566 USDT, up 11.354% on a rolling 24-hour basis—about 13.2% below the 24-hour high of 0.21388. The ranking indicates research priority, not the reason for the rise. The price had already pulled back between the two snapshots, so the ranking’s gain should not be treated as a sustainable trend.
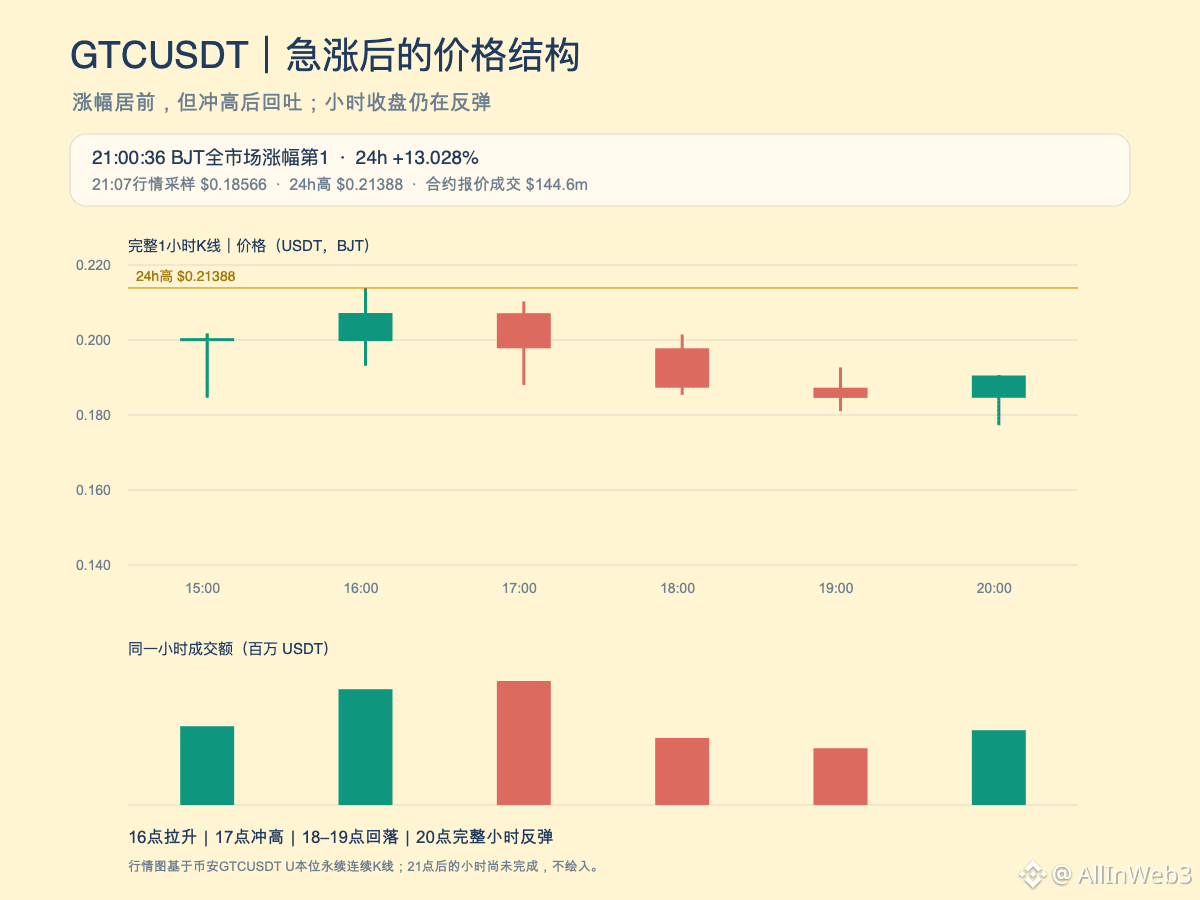
The short-term move has not been a steady climb. Complete 4-hour candles show that the 12:00–16:00 candle closed at 0.19983, up about 29.3% from the previous close of 0.15456; the 16:00–20:00 candle then closed at 0.18456, down about 7.6%. In that later window, quoted turnover rose from about $40.52 million to $57.14 million. Trading was more active as the price fell, but turnover is the total value of matched trades on both sides and cannot, by itself, prove net selling.
The latest complete hourly candle, from 20:00 to 21:00, rose about 3.2%, from 0.18459 to 0.19052, with turnover of about $11.76 million, above the previous hour’s roughly $8.92 million. This confirms a rebound and a pickup in trading during that hour. However, at 21:07, the still-incomplete 21:00 hourly candle had already returned to 0.18566, so the intrahour pullback cannot be treated as a closing-price conclusion. The 20:00 hourly low of 0.17729 is a level to watch for market structure; to the upside, watch whether the price can approach the previous 4-hour close of 0.19983 again. Confirmation requires complete hourly and 4-hour closes; an intraday touch does not mean the price has held above a level.
Open interest and funding also point to mixed positioning. Binance’s public hourly OI series shows open contracts rising from about 39.17 million to 40.34 million between 20:00 and 21:00, an increase of roughly 3%. The latest funding rate, settled at 16:00, was about -0.2536%. This indicates that derivatives open interest was expanding at the time and the funding rate was significantly negative. But OI does not distinguish between long and short positions, and a single settlement point cannot prove a short squeeze or predict the next funding rate.
Gitcoin’s official October update introduced the Techne and Beacon pilots and stated that the DAO and GTC would continue their existing functions. The update predated this market move and did not directly link the token price to new product developments. I found no single new announcement sufficient to explain this rally, so I would not treat Techne as a catalyst. The more cautious description is a period of high-volatility consolidation after a sharp rise: a short-term rebound has occurred, but the next hourly candle is not yet complete. Whether the pullback is repaired depends on subsequent closes, not just the 24-hour ranking.
$GTC : wait and see; don’t chase the price. In Binance’s full scan of USDT-margined perpetuals at 21:06:22, it ranked first by gains, up 13.028% over 24 hours. A single-token market snapshot at 21:07 showed 0.18566 USDT, up 11.354% on a rolling 24-hour basis—about 13.2% below the 24-hour high of 0.21388. The ranking indicates research priority, not the reason for the rise. The price had already pulled back between the two snapshots, so the ranking’s gain should not be treated as a sustainable trend.
The short-term move has not been a steady climb. Complete 4-hour candles show that the 12:00–16:00 candle closed at 0.19983, up about 29.3% from the previous close of 0.15456; the 16:00–20:00 candle then closed at 0.18456, down about 7.6%. In that later window, quoted turnover rose from about $40.52 million to $57.14 million. Trading was more active as the price fell, but turnover is the total value of matched trades on both sides and cannot, by itself, prove net selling.
The latest complete hourly candle, from 20:00 to 21:00, rose about 3.2%, from 0.18459 to 0.19052, with turnover of about $11.76 million, above the previous hour’s roughly $8.92 million. This confirms a rebound and a pickup in trading during that hour. However, at 21:07, the still-incomplete 21:00 hourly candle had already returned to 0.18566, so the intrahour pullback cannot be treated as a closing-price conclusion. The 20:00 hourly low of 0.17729 is a level to watch for market structure; to the upside, watch whether the price can approach the previous 4-hour close of 0.19983 again. Confirmation requires complete hourly and 4-hour closes; an intraday touch does not mean the price has held above a level.
Open interest and funding also point to mixed positioning. Binance’s public hourly OI series shows open contracts rising from about 39.17 million to 40.34 million between 20:00 and 21:00, an increase of roughly 3%. The latest funding rate, settled at 16:00, was about -0.2536%. This indicates that derivatives open interest was expanding at the time and the funding rate was significantly negative. But OI does not distinguish between long and short positions, and a single settlement point cannot prove a short squeeze or predict the next funding rate.
Gitcoin’s official October update introduced the Techne and Beacon pilots and stated that the DAO and GTC would continue their existing functions. The update predated this market move and did not directly link the token price to new product developments. I found no single new announcement sufficient to explain this rally, so I would not treat Techne as a catalyst. The more cautious description is a period of high-volatility consolidation after a sharp rise: a short-term rebound has occurred, but the next hourly candle is not yet complete. Whether the pullback is repaired depends on subsequent closes, not just the 24-hour ranking.
The short-term move has not been a steady climb. Complete 4-hour candles show that the 12:00–16:00 candle closed at 0.19983, up about 29.3% from the previous close of 0.15456; the 16:00–20:00 candle then closed at 0.18456, down about 7.6%. In that later window, quoted turnover rose from about $40.52 million to $57.14 million. Trading was more active as the price fell, but turnover is the total value of matched trades on both sides and cannot, by itself, prove net selling.
The latest complete hourly candle, from 20:00 to 21:00, rose about 3.2%, from 0.18459 to 0.19052, with turnover of about $11.76 million, above the previous hour’s roughly $8.92 million. This confirms a rebound and a pickup in trading during that hour. However, at 21:07, the still-incomplete 21:00 hourly candle had already returned to 0.18566, so the intrahour pullback cannot be treated as a closing-price conclusion. The 20:00 hourly low of 0.17729 is a level to watch for market structure; to the upside, watch whether the price can approach the previous 4-hour close of 0.19983 again. Confirmation requires complete hourly and 4-hour closes; an intraday touch does not mean the price has held above a level.
Open interest and funding also point to mixed positioning. Binance’s public hourly OI series shows open contracts rising from about 39.17 million to 40.34 million between 20:00 and 21:00, an increase of roughly 3%. The latest funding rate, settled at 16:00, was about -0.2536%. This indicates that derivatives open interest was expanding at the time and the funding rate was significantly negative. But OI does not distinguish between long and short positions, and a single settlement point cannot prove a short squeeze or predict the next funding rate.
Gitcoin’s official October update introduced the Techne and Beacon pilots and stated that the DAO and GTC would continue their existing functions. The update predated this market move and did not directly link the token price to new product developments. I found no single new announcement sufficient to explain this rally, so I would not treat Techne as a catalyst. The more cautious description is a period of high-volatility consolidation after a sharp rise: a short-term rebound has occurred, but the next hourly candle is not yet complete. Whether the pullback is repaired depends on subsequent closes, not just the 24-hour ranking.
113
·
--
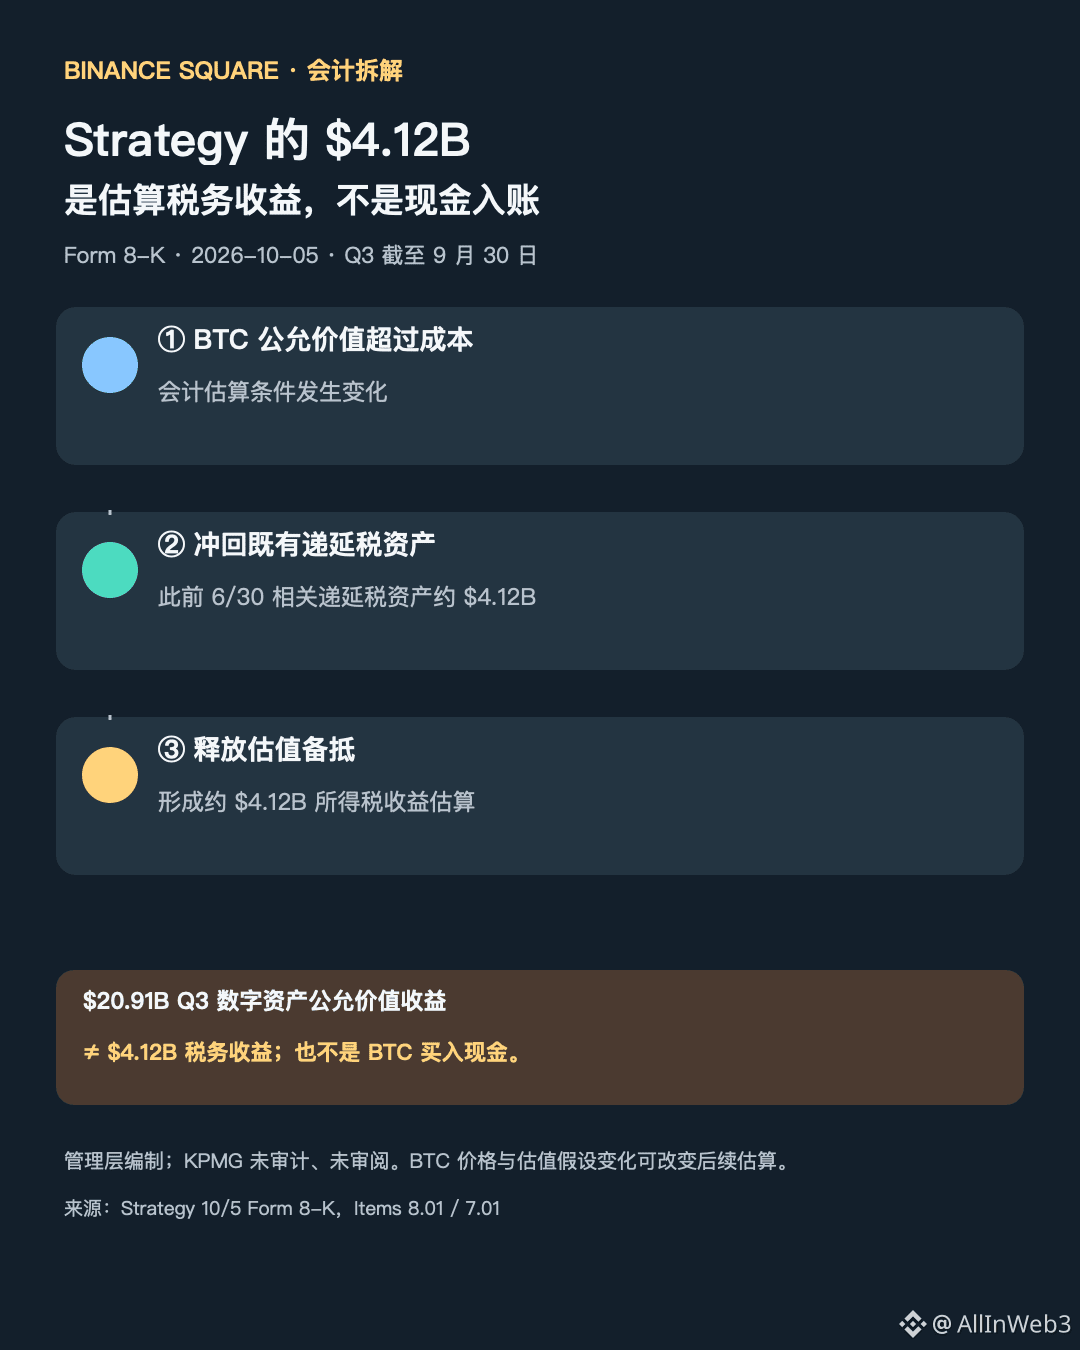
#Strategy estimates an income tax benefit of approximately $4.12 billion, a figure on trending lists that can easily be mistaken for “a cash payment received.” But the original October 5 Form 8-K describes a deferred income tax accounting estimate as of September 30: Bitcoin’s fair value was above its cost, so Strategy reversed deferred tax assets previously associated with BTC and released the corresponding valuation allowance. The approximately $4.12 billion benefit reduced estimated deferred tax expense from about $6 billion to $1.88 billion.
The first distinction is that a “benefit” is not cash. The filing discusses changes in deferred tax items and the valuation allowance—not a $4.12 billion payment from the government to the company, nor proceeds from selling Bitcoin. The second distinction is that the tax figure and the change in BTC’s fair value are not the same line item: the same disclosure estimated a Q3 digital asset fair value gain of about $20.91 billion and deferred tax expense of about $1.88 billion. These figures address asset valuation changes and tax accounting estimates, respectively; you cannot subtract $4.12 billion from $20.91 billion and call the result cash profit.
The third distinction is that the figures are not yet final or audited. Strategy explicitly stated that the financial information in the Form 8-K was prepared by management and had not been audited or reviewed by KPMG, which had not expressed an opinion. The company also labeled the figures as estimates. If BTC prices, period-end valuations, or tax assumptions change, the figures may be adjusted in subsequent financial reports. Describing this as “tax cash already in the bank” or “funds for buying more coins” would go beyond what the filing says.
This trending item is therefore best understood as an example of accounting treatment being updated as BTC’s fair value changes. It does not mean operating cash flow suddenly increased, nor does it support an inference that Strategy will immediately add to its holdings or indicate BTC’s short-term direction. The final figures in the company’s official financial statements and SEC filings should be treated as authoritative.
There is also a timing distinction: September 30 is the balance-sheet comparison date, while October 5 is the date the company filed its update. These should not be conflated into “taxes received on October 5.” The filing states that Strategy held 848,000 BTC as of October 4; that is a separate asset disclosure, and the number of BTC held does not prove that the tax benefit has been converted into cash.
#Strategy estimates an income tax benefit of approximately $4.12 billion, a figure on trending lists that can easily be mistaken for “a cash payment received.” But the original October 5 Form 8-K describes a deferred income tax accounting estimate as of September 30: Bitcoin’s fair value was above its cost, so Strategy reversed deferred tax assets previously associated with BTC and released the corresponding valuation allowance. The approximately $4.12 billion benefit reduced estimated deferred tax expense from about $6 billion to $1.88 billion.
The first distinction is that a “benefit” is not cash. The filing discusses changes in deferred tax items and the valuation allowance—not a $4.12 billion payment from the government to the company, nor proceeds from selling Bitcoin. The second distinction is that the tax figure and the change in BTC’s fair value are not the same line item: the same disclosure estimated a Q3 digital asset fair value gain of about $20.91 billion and deferred tax expense of about $1.88 billion. These figures address asset valuation changes and tax accounting estimates, respectively; you cannot subtract $4.12 billion from $20.91 billion and call the result cash profit.
The third distinction is that the figures are not yet final or audited. Strategy explicitly stated that the financial information in the Form 8-K was prepared by management and had not been audited or reviewed by KPMG, which had not expressed an opinion. The company also labeled the figures as estimates. If BTC prices, period-end valuations, or tax assumptions change, the figures may be adjusted in subsequent financial reports. Describing this as “tax cash already in the bank” or “funds for buying more coins” would go beyond what the filing says.
This trending item is therefore best understood as an example of accounting treatment being updated as BTC’s fair value changes. It does not mean operating cash flow suddenly increased, nor does it support an inference that Strategy will immediately add to its holdings or indicate BTC’s short-term direction. The final figures in the company’s official financial statements and SEC filings should be treated as authoritative.
There is also a timing distinction: September 30 is the balance-sheet comparison date, while October 5 is the date the company filed its update. These should not be conflated into “taxes received on October 5.” The filing states that Strategy held 848,000 BTC as of October 4; that is a separate asset disclosure, and the number of BTC held does not prove that the tax benefit has been converted into cash.
The first distinction is that a “benefit” is not cash. The filing discusses changes in deferred tax items and the valuation allowance—not a $4.12 billion payment from the government to the company, nor proceeds from selling Bitcoin. The second distinction is that the tax figure and the change in BTC’s fair value are not the same line item: the same disclosure estimated a Q3 digital asset fair value gain of about $20.91 billion and deferred tax expense of about $1.88 billion. These figures address asset valuation changes and tax accounting estimates, respectively; you cannot subtract $4.12 billion from $20.91 billion and call the result cash profit.
The third distinction is that the figures are not yet final or audited. Strategy explicitly stated that the financial information in the Form 8-K was prepared by management and had not been audited or reviewed by KPMG, which had not expressed an opinion. The company also labeled the figures as estimates. If BTC prices, period-end valuations, or tax assumptions change, the figures may be adjusted in subsequent financial reports. Describing this as “tax cash already in the bank” or “funds for buying more coins” would go beyond what the filing says.
This trending item is therefore best understood as an example of accounting treatment being updated as BTC’s fair value changes. It does not mean operating cash flow suddenly increased, nor does it support an inference that Strategy will immediately add to its holdings or indicate BTC’s short-term direction. The final figures in the company’s official financial statements and SEC filings should be treated as authoritative.
There is also a timing distinction: September 30 is the balance-sheet comparison date, while October 5 is the date the company filed its update. These should not be conflated into “taxes received on October 5.” The filing states that Strategy held 848,000 BTC as of October 4; that is a separate asset disclosure, and the number of BTC held does not prove that the tax benefit has been converted into cash.
93
·
--
#South Korea’s AI-themed crypto trading and Worldcoin: The “$7.41 billion” in the trending headline is neither WLD’s market cap nor today’s inflow. The current No. 6 item on Binance Square refers to an East Asia crypto economy report published by Chainalysis on October 5. Its data covers a period ending in June 2026, so it is an annual overview, not a transaction that just happened.
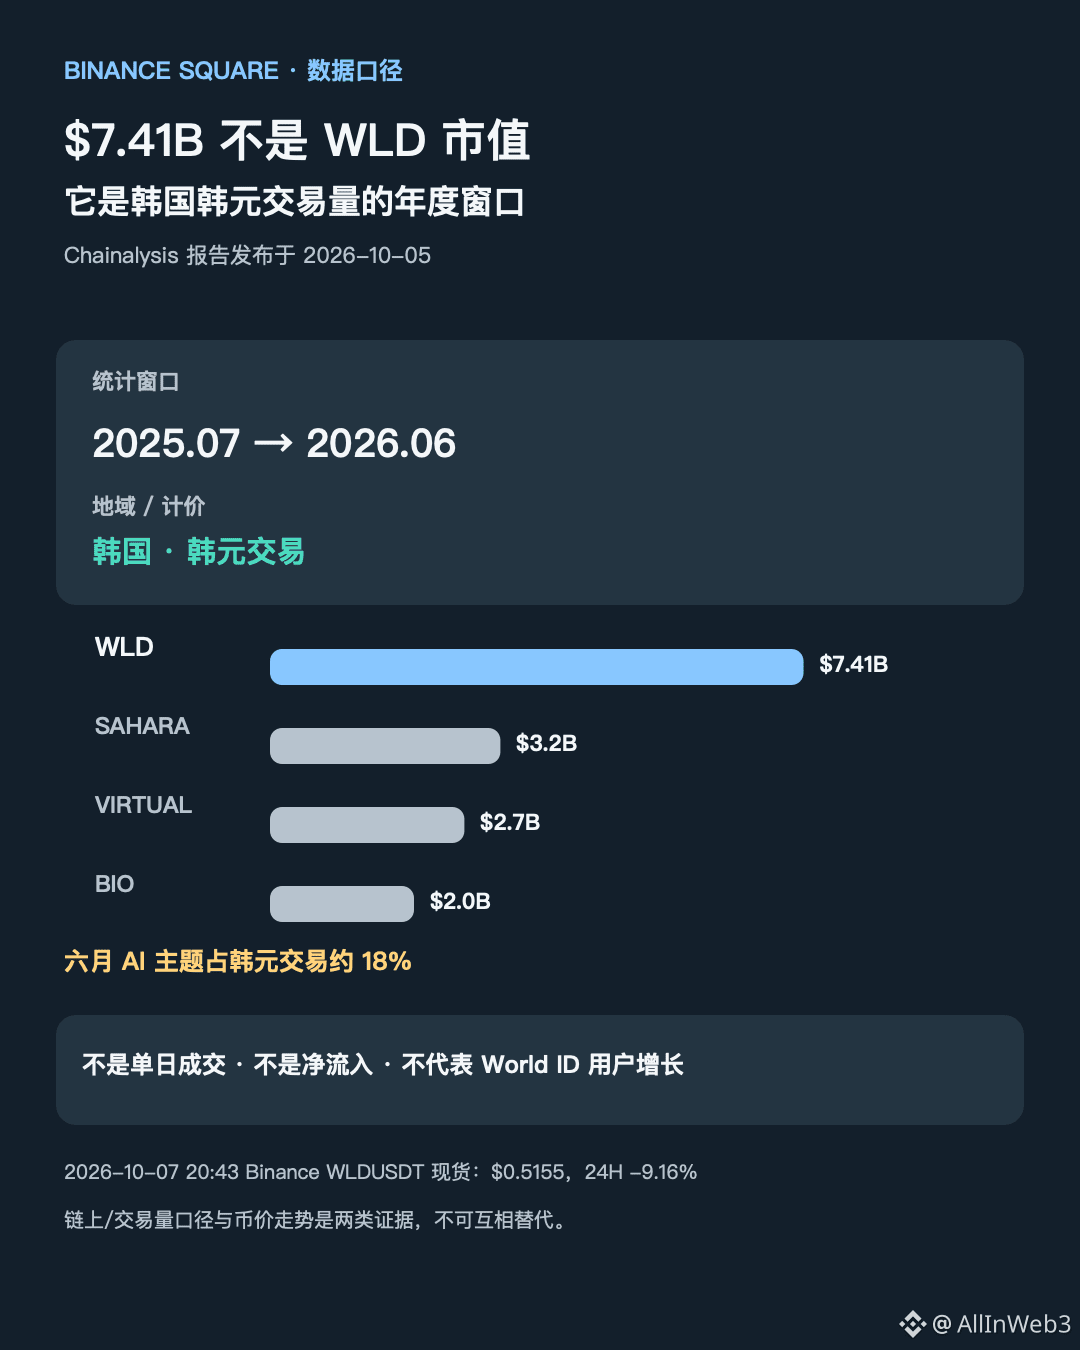
The report’s figures show that, among AI-themed crypto assets traded in South Korean won, Worldcoin (WLD) recorded a cumulative trading volume of $7.41 billion, ahead of SAHARA at $3.2 billion, VIRTUAL at $2.7 billion, and BIO at $2 billion. These figures represent the nominal value of trades matched between buyers and sellers repeatedly over a period of time. They should not be treated as new net purchases, dollar inflows into WLD, or the token’s market capitalization. The report also says that AI-themed assets accounted for about 18% of won-denominated trading volume in June 2026. This describes the theme’s share of local trading activity; it does not mean that 18% of South Korean investors hold AI coins.
What these figures actually reveal is trading preference: Chainalysis defines AI-related coins as tokens from AI projects or assets associated with AI infrastructure, and observed that South Korea’s market was driven by retail trading. The report notes that WLD and SAHARA replaced VIRTUAL and KAITO as the main trading targets during this period. This supports the view that “AI coins are attracting heavy trading in South Korea,” but it does not prove growth in World ID users, product adoption, or long-term demand. High trading volume may also reflect faster rotation between themes.
Now consider the market context: A Binance WLDUSDT spot snapshot at 20:43 Beijing time showed a price of about $0.5155, down approximately 9.16% over the rolling 24 hours. This quote and the report’s trading volume through June cover different time windows, so they cannot be combined into a cause-and-effect narrative. When reading this trending item, keep the reporting period, won-denominated trading figures, token price, and actual product usage separate; $7.41 billion does not mean that “the market cap was pushed to $7.41 billion.”
The report also explicitly states that activity in South Korea is driven mainly by the retail market, while financial institutions are still in the preparatory stages of participation. This statistic is therefore better understood as traders’ activity around a particular theme, rather than the proportion of institutional allocations. The rotation among tokens also shows that a single token leading during one annual window does not mean it will hold the same ranking the following year.
#South Korea’s AI-themed crypto trading and Worldcoin: The “$7.41 billion” in the trending headline is neither WLD’s market cap nor today’s inflow. The current No. 6 item on Binance Square refers to an East Asia crypto economy report published by Chainalysis on October 5. Its data covers a period ending in June 2026, so it is an annual overview, not a transaction that just happened.
The report’s figures show that, among AI-themed crypto assets traded in South Korean won, Worldcoin (WLD) recorded a cumulative trading volume of $7.41 billion, ahead of SAHARA at $3.2 billion, VIRTUAL at $2.7 billion, and BIO at $2 billion. These figures represent the nominal value of trades matched between buyers and sellers repeatedly over a period of time. They should not be treated as new net purchases, dollar inflows into WLD, or the token’s market capitalization. The report also says that AI-themed assets accounted for about 18% of won-denominated trading volume in June 2026. This describes the theme’s share of local trading activity; it does not mean that 18% of South Korean investors hold AI coins.
What these figures actually reveal is trading preference: Chainalysis defines AI-related coins as tokens from AI projects or assets associated with AI infrastructure, and observed that South Korea’s market was driven by retail trading. The report notes that WLD and SAHARA replaced VIRTUAL and KAITO as the main trading targets during this period. This supports the view that “AI coins are attracting heavy trading in South Korea,” but it does not prove growth in World ID users, product adoption, or long-term demand. High trading volume may also reflect faster rotation between themes.
Now consider the market context: A Binance WLDUSDT spot snapshot at 20:43 Beijing time showed a price of about $0.5155, down approximately 9.16% over the rolling 24 hours. This quote and the report’s trading volume through June cover different time windows, so they cannot be combined into a cause-and-effect narrative. When reading this trending item, keep the reporting period, won-denominated trading figures, token price, and actual product usage separate; $7.41 billion does not mean that “the market cap was pushed to $7.41 billion.”
The report also explicitly states that activity in South Korea is driven mainly by the retail market, while financial institutions are still in the preparatory stages of participation. This statistic is therefore better understood as traders’ activity around a particular theme, rather than the proportion of institutional allocations. The rotation among tokens also shows that a single token leading during one annual window does not mean it will hold the same ranking the following year.
The report’s figures show that, among AI-themed crypto assets traded in South Korean won, Worldcoin (WLD) recorded a cumulative trading volume of $7.41 billion, ahead of SAHARA at $3.2 billion, VIRTUAL at $2.7 billion, and BIO at $2 billion. These figures represent the nominal value of trades matched between buyers and sellers repeatedly over a period of time. They should not be treated as new net purchases, dollar inflows into WLD, or the token’s market capitalization. The report also says that AI-themed assets accounted for about 18% of won-denominated trading volume in June 2026. This describes the theme’s share of local trading activity; it does not mean that 18% of South Korean investors hold AI coins.
What these figures actually reveal is trading preference: Chainalysis defines AI-related coins as tokens from AI projects or assets associated with AI infrastructure, and observed that South Korea’s market was driven by retail trading. The report notes that WLD and SAHARA replaced VIRTUAL and KAITO as the main trading targets during this period. This supports the view that “AI coins are attracting heavy trading in South Korea,” but it does not prove growth in World ID users, product adoption, or long-term demand. High trading volume may also reflect faster rotation between themes.
Now consider the market context: A Binance WLDUSDT spot snapshot at 20:43 Beijing time showed a price of about $0.5155, down approximately 9.16% over the rolling 24 hours. This quote and the report’s trading volume through June cover different time windows, so they cannot be combined into a cause-and-effect narrative. When reading this trending item, keep the reporting period, won-denominated trading figures, token price, and actual product usage separate; $7.41 billion does not mean that “the market cap was pushed to $7.41 billion.”
The report also explicitly states that activity in South Korea is driven mainly by the retail market, while financial institutions are still in the preparatory stages of participation. This statistic is therefore better understood as traders’ activity around a particular theme, rather than the proportion of institutional allocations. The rotation among tokens also shows that a single token leading during one annual window does not mean it will hold the same ranking the following year.
1
203
·
--
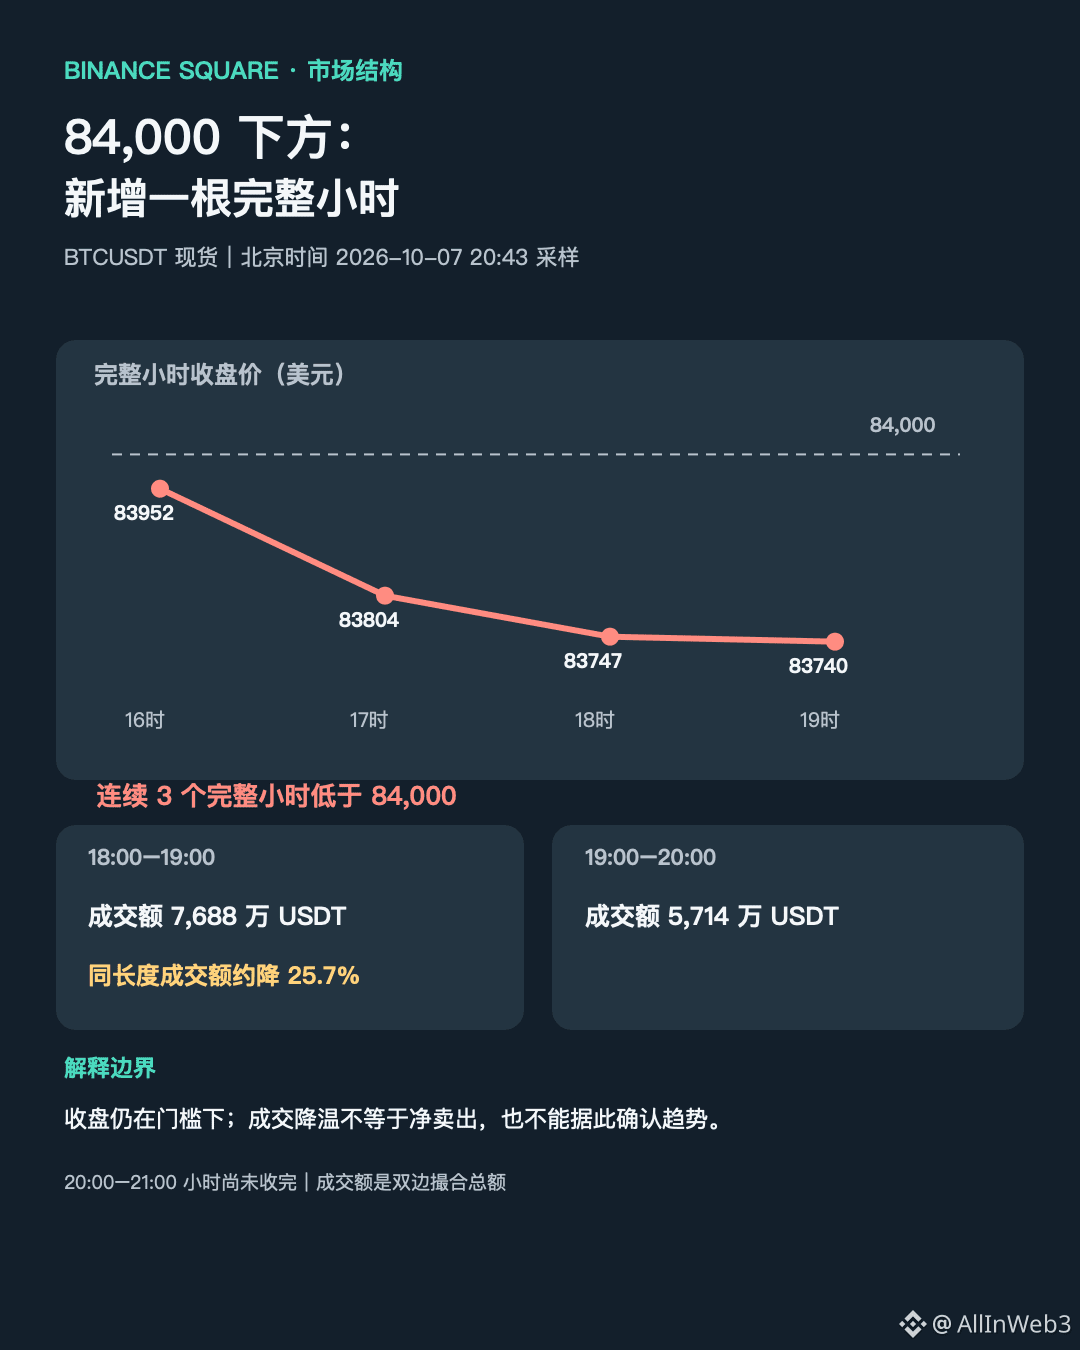
#Update after Bitcoin fell below $84,000: The next full hourly candle that the previous post was waiting for still did not reclaim the round-number level. At 20:43 Beijing time, Binance BTCUSDT spot was quoted at about $83,503.68, down approximately 3.20% over the rolling 24 hours. Live prices change; this post describes only this trading pair and sampling window.
Looking at completed candles, the 16:00–17:00 candle closed at $83,952.42; the 17:00–18:00 candle at $83,804; the 18:00–19:00 candle at $83,747.06; and the 19:00–20:00 candle at $83,740.15. In other words, the 19:00 hourly candle that formed after the previous post was published at 18:54 remained below $84,000, and its close was only about $7 below the prior hour’s. This fills in the observation point the previous post was waiting for—whether the full 19:00 hour could reclaim the level. It confirms that the price did not reclaim it over this short window, but is not enough on its own to infer a new acceleration in the decline.
Trading volume also cooled: turnover for the full 18:00 hour was about 76.88 million USDT, versus about 57.14 million for the 19:00 hour, a decline of approximately 25.7%. The preceding 16:00 and 17:00 hours recorded about 168.9 million and 163.6 million, respectively. Turnover is the total value of matched buys and sells; it is not the same as net selling or capital outflows. Consecutive closes below a round-number level can coincide with declining turnover, but these indicate different things: the former shows that the price has not reclaimed the level, while the latter shows that trading activity declined during that hour. It cannot be used to prove that sellers had the upper hand.
The next observation point is the full 20:00–21:00 hour. At the time of sampling, it had not yet closed, so the intrahour price should not be treated as the closing price. If the completed hourly candle remains below $84,000, that would only mean the short-term failure to reclaim the level continues; if it closes back above, we would still need to see whether turnover over a comparable period supports the move. This is an update with new data for the window the previous post was waiting on—not a guarantee about direction or a trading instruction.
The only connection to the previous post is this: at 18:54, the 19:00 hourly candle was not yet complete, so its subsequent movement was not presented as fact. Now that candle’s close can be compared, but the 21:00 close and confirmation over a longer time frame are still lacking. The quotes in this update come from a single sampling snapshot; any later price changes need to be checked again.
#Update after Bitcoin fell below $84,000: The next full hourly candle that the previous post was waiting for still did not reclaim the round-number level. At 20:43 Beijing time, Binance BTCUSDT spot was quoted at about $83,503.68, down approximately 3.20% over the rolling 24 hours. Live prices change; this post describes only this trading pair and sampling window.
Looking at completed candles, the 16:00–17:00 candle closed at $83,952.42; the 17:00–18:00 candle at $83,804; the 18:00–19:00 candle at $83,747.06; and the 19:00–20:00 candle at $83,740.15. In other words, the 19:00 hourly candle that formed after the previous post was published at 18:54 remained below $84,000, and its close was only about $7 below the prior hour’s. This fills in the observation point the previous post was waiting for—whether the full 19:00 hour could reclaim the level. It confirms that the price did not reclaim it over this short window, but is not enough on its own to infer a new acceleration in the decline.
Trading volume also cooled: turnover for the full 18:00 hour was about 76.88 million USDT, versus about 57.14 million for the 19:00 hour, a decline of approximately 25.7%. The preceding 16:00 and 17:00 hours recorded about 168.9 million and 163.6 million, respectively. Turnover is the total value of matched buys and sells; it is not the same as net selling or capital outflows. Consecutive closes below a round-number level can coincide with declining turnover, but these indicate different things: the former shows that the price has not reclaimed the level, while the latter shows that trading activity declined during that hour. It cannot be used to prove that sellers had the upper hand.
The next observation point is the full 20:00–21:00 hour. At the time of sampling, it had not yet closed, so the intrahour price should not be treated as the closing price. If the completed hourly candle remains below $84,000, that would only mean the short-term failure to reclaim the level continues; if it closes back above, we would still need to see whether turnover over a comparable period supports the move. This is an update with new data for the window the previous post was waiting on—not a guarantee about direction or a trading instruction.
The only connection to the previous post is this: at 18:54, the 19:00 hourly candle was not yet complete, so its subsequent movement was not presented as fact. Now that candle’s close can be compared, but the 21:00 close and confirmation over a longer time frame are still lacking. The quotes in this update come from a single sampling snapshot; any later price changes need to be checked again.
Looking at completed candles, the 16:00–17:00 candle closed at $83,952.42; the 17:00–18:00 candle at $83,804; the 18:00–19:00 candle at $83,747.06; and the 19:00–20:00 candle at $83,740.15. In other words, the 19:00 hourly candle that formed after the previous post was published at 18:54 remained below $84,000, and its close was only about $7 below the prior hour’s. This fills in the observation point the previous post was waiting for—whether the full 19:00 hour could reclaim the level. It confirms that the price did not reclaim it over this short window, but is not enough on its own to infer a new acceleration in the decline.
Trading volume also cooled: turnover for the full 18:00 hour was about 76.88 million USDT, versus about 57.14 million for the 19:00 hour, a decline of approximately 25.7%. The preceding 16:00 and 17:00 hours recorded about 168.9 million and 163.6 million, respectively. Turnover is the total value of matched buys and sells; it is not the same as net selling or capital outflows. Consecutive closes below a round-number level can coincide with declining turnover, but these indicate different things: the former shows that the price has not reclaimed the level, while the latter shows that trading activity declined during that hour. It cannot be used to prove that sellers had the upper hand.
The next observation point is the full 20:00–21:00 hour. At the time of sampling, it had not yet closed, so the intrahour price should not be treated as the closing price. If the completed hourly candle remains below $84,000, that would only mean the short-term failure to reclaim the level continues; if it closes back above, we would still need to see whether turnover over a comparable period supports the move. This is an update with new data for the window the previous post was waiting on—not a guarantee about direction or a trading instruction.
The only connection to the previous post is this: at 18:54, the 19:00 hourly candle was not yet complete, so its subsequent movement was not presented as fact. Now that candle’s close can be compared, but the 21:00 close and confirmation over a longer time frame are still lacking. The quotes in this update come from a single sampling snapshot; any later price changes need to be checked again.
4
·
--
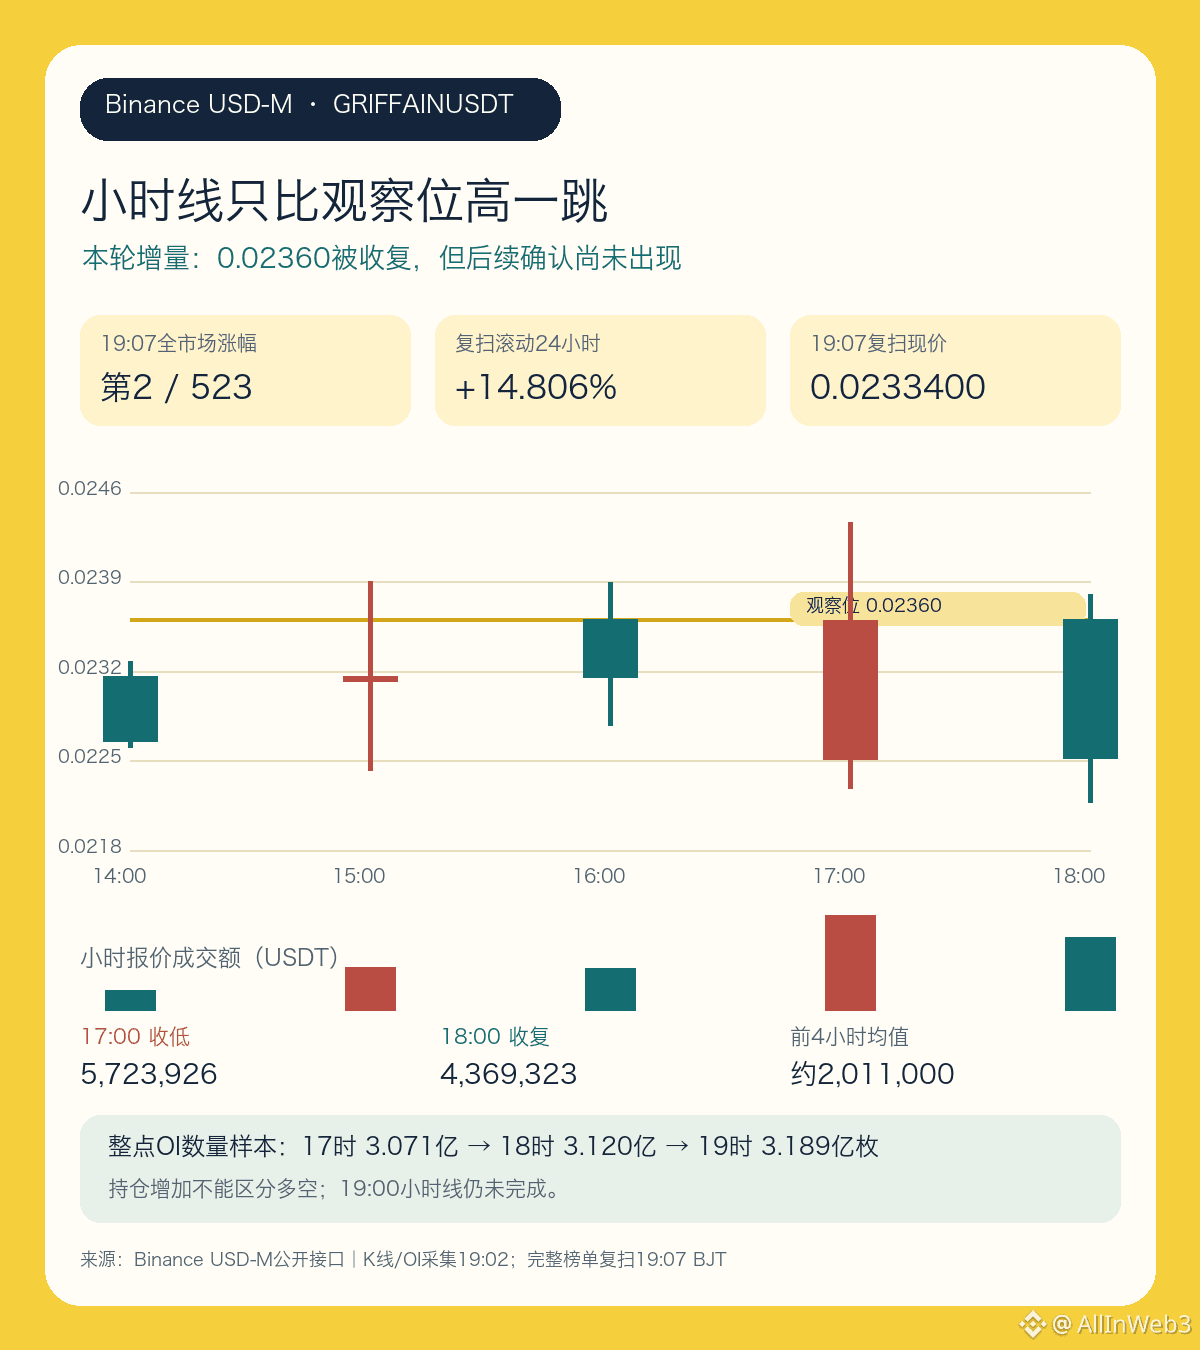
$GRIFFAIN: I’m still inclined to wait and see in the short term. The full hourly candle from 18:00–18:59 reclaimed the 0.02360 level I’m watching, but closed just 0.000006 higher, or about 0.03%. That means the trigger condition was touched, not that the level has been confirmed as support. My previous post listed 0.02360 as the condition for confirmation above and also flagged the risk of a pullback near 0.02228. This hourly candle dipped to a low of 0.022169, briefly falling below that caution level, before closing at 0.023606. Both boundaries were tested, which is more worth tracking than the 24-hour gain alone.
In the full market ranking at 19:01, GRIFFAINUSDT ranked second, up 18.480% over the rolling 24 hours, with quote volume of about 76.197 million USDT. A rescan at 19:07 still ranked it second, but the gain had eased to 14.806%, and the latest price was 0.023340, back below the level I’m watching. The hourly close had rebounded about 6.5% from the low, but by 19:07 the price had returned to 0.02334, showing that the recovery was not a straight-line move. This also shows that barely crossing the level at the hourly close did not bring immediate follow-through; the ranking itself is no guarantee of continued strength.
Quote volume for the 18:00 hour was about 4.369 million, roughly 23.7% less than the 5.724 million in the previous 17:00 hour, but about 2.17 times the average of 2.011 million across the prior four complete hours. Trading was still active during the recovery, but follow-through volume was lower than during the sharp drop in the previous hour. Quote volume alone does not show net aggressive buying or selling. The hourly open-interest snapshots rose from about 312.0 million tokens at 18:00 to about 318.9 million at 19:00, an increase of roughly 2.2%, but this does not tell us whether the new positions were bullish or bearish.
The 19:00 hourly candle was still incomplete when the data was checked at 19:07. In searches of public project and Binance announcements, I found no new announcement that coincided with and explained this move; that does not mean the project has had no other developments. Next, watch whether the complete 19:00 hourly candle can close above 0.02360 with volume support. If it closes back below that level or falls below the area around 0.022169 again, this looks more like repeated, high-volatility testing than a successful reclaim.
$GRIFFAIN : I’m still inclined to wait and see in the short term. The full hourly candle from 18:00–18:59 reclaimed the 0.02360 level I’m watching, but closed just 0.000006 higher, or about 0.03%. That means the trigger condition was touched, not that the level has been confirmed as support. My previous post listed 0.02360 as the condition for confirmation above and also flagged the risk of a pullback near 0.02228. This hourly candle dipped to a low of 0.022169, briefly falling below that caution level, before closing at 0.023606. Both boundaries were tested, which is more worth tracking than the 24-hour gain alone.
In the full market ranking at 19:01, GRIFFAINUSDT ranked second, up 18.480% over the rolling 24 hours, with quote volume of about 76.197 million USDT. A rescan at 19:07 still ranked it second, but the gain had eased to 14.806%, and the latest price was 0.023340, back below the level I’m watching. The hourly close had rebounded about 6.5% from the low, but by 19:07 the price had returned to 0.02334, showing that the recovery was not a straight-line move. This also shows that barely crossing the level at the hourly close did not bring immediate follow-through; the ranking itself is no guarantee of continued strength.
Quote volume for the 18:00 hour was about 4.369 million, roughly 23.7% less than the 5.724 million in the previous 17:00 hour, but about 2.17 times the average of 2.011 million across the prior four complete hours. Trading was still active during the recovery, but follow-through volume was lower than during the sharp drop in the previous hour. Quote volume alone does not show net aggressive buying or selling. The hourly open-interest snapshots rose from about 312.0 million tokens at 18:00 to about 318.9 million at 19:00, an increase of roughly 2.2%, but this does not tell us whether the new positions were bullish or bearish.
The 19:00 hourly candle was still incomplete when the data was checked at 19:07. In searches of public project and Binance announcements, I found no new announcement that coincided with and explained this move; that does not mean the project has had no other developments. Next, watch whether the complete 19:00 hourly candle can close above 0.02360 with volume support. If it closes back below that level or falls below the area around 0.022169 again, this looks more like repeated, high-volatility testing than a successful reclaim.
In the full market ranking at 19:01, GRIFFAINUSDT ranked second, up 18.480% over the rolling 24 hours, with quote volume of about 76.197 million USDT. A rescan at 19:07 still ranked it second, but the gain had eased to 14.806%, and the latest price was 0.023340, back below the level I’m watching. The hourly close had rebounded about 6.5% from the low, but by 19:07 the price had returned to 0.02334, showing that the recovery was not a straight-line move. This also shows that barely crossing the level at the hourly close did not bring immediate follow-through; the ranking itself is no guarantee of continued strength.
Quote volume for the 18:00 hour was about 4.369 million, roughly 23.7% less than the 5.724 million in the previous 17:00 hour, but about 2.17 times the average of 2.011 million across the prior four complete hours. Trading was still active during the recovery, but follow-through volume was lower than during the sharp drop in the previous hour. Quote volume alone does not show net aggressive buying or selling. The hourly open-interest snapshots rose from about 312.0 million tokens at 18:00 to about 318.9 million at 19:00, an increase of roughly 2.2%, but this does not tell us whether the new positions were bullish or bearish.
The 19:00 hourly candle was still incomplete when the data was checked at 19:07. In searches of public project and Binance announcements, I found no new announcement that coincided with and explained this move; that does not mean the project has had no other developments. Next, watch whether the complete 19:00 hourly candle can close above 0.02360 with volume support. If it closes back below that level or falls below the area around 0.022169 again, this looks more like repeated, high-volatility testing than a successful reclaim.
73
·
--
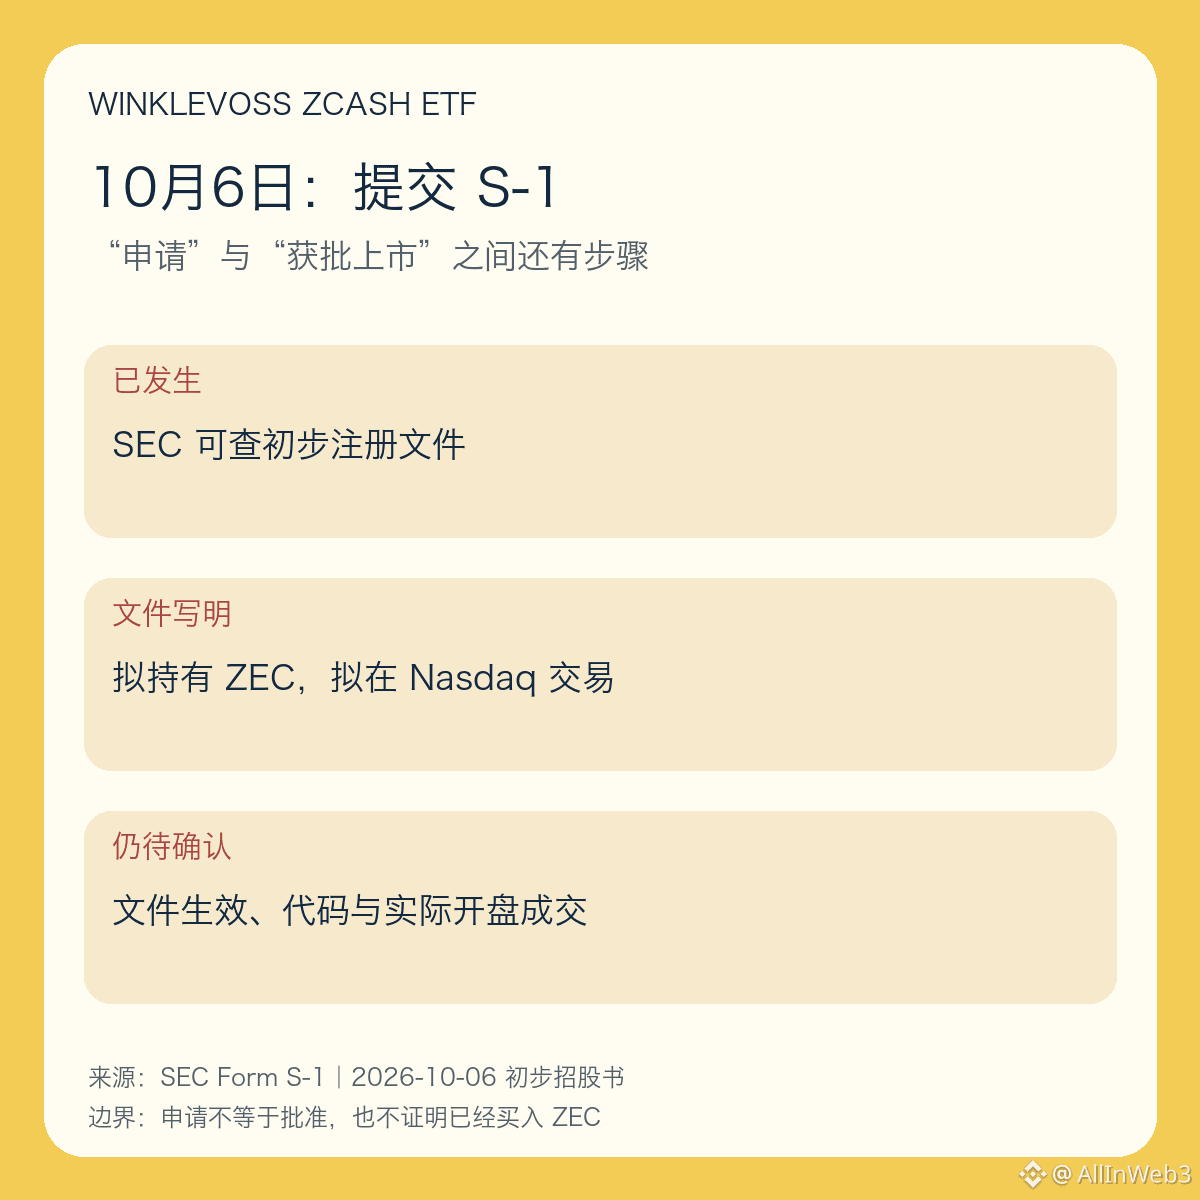
#Winklevoss filed an application with the U.S. SEC for a spot Zcash ETF. The keyword here is “filed,” not “approved.” At 18:43 Beijing time, the topic ranked fifth on Binance Square’s trending list. The SEC’s public filings show a preliminary Form S-1 dated October 6 for the Winklevoss Zcash ETF. It proposes Winklevoss Asset Services as the sponsor, and the product aims to hold ZEC so that its shares provide exposure to the price of ZEC, minus fees.
The first step that has taken place is the filing of registration documents. The preliminary prospectus states explicitly that the information in the filing is incomplete and may change, and that securities may not be sold before the registration statement becomes effective. One section says the shares “will” trade on Nasdaq, while another says the fund is “seeking” a listing. The cautious interpretation is that a listing is proposed—not that trading has already begun. Nor does this filing mean the SEC endorses ZEC as an investment.
The second step is to examine how the product works. The filing describes a trust that holds ZEC, with shares representing an interest in the trust’s assets. Authorized participants may take part in creations and redemptions through a basket mechanism, while the specifics of how cash or ZEC enters the trust remain subject to later filings, service-provider arrangements, and actual operations. This differs from products that obtain exposure solely through ZEC futures, but the filing alone cannot be taken as evidence of spot buying on the day or future net inflows.
The third step is to verify what has yet to happen: whether the registration statement becomes effective, whether the exchange issues a listing notice, and whether the final ticker, fee rate, and post-launch trading volume materialize. The objectives and blank fields in the preliminary filing may be revised. Only once each of these subsequent steps is confirmed can we discuss actual market impact. In particular, discussion volume on a trending list should not be mistaken for fund demand or buying volume.
This update confirms only the existence and wording of the preliminary document dated October 6 on the SEC website; it does not describe the ETF as approved, listed, or already buying coins. Readers following the story should first check for subsequent SEC notices that the registration statement has become effective and official Nasdaq announcements, then compare these with actual creation and redemption activity and holdings disclosures.
#Winklevoss filed an application with the U.S. SEC for a spot Zcash ETF. The keyword here is “filed,” not “approved.” At 18:43 Beijing time, the topic ranked fifth on Binance Square’s trending list. The SEC’s public filings show a preliminary Form S-1 dated October 6 for the Winklevoss Zcash ETF. It proposes Winklevoss Asset Services as the sponsor, and the product aims to hold ZEC so that its shares provide exposure to the price of ZEC, minus fees.
The first step that has taken place is the filing of registration documents. The preliminary prospectus states explicitly that the information in the filing is incomplete and may change, and that securities may not be sold before the registration statement becomes effective. One section says the shares “will” trade on Nasdaq, while another says the fund is “seeking” a listing. The cautious interpretation is that a listing is proposed—not that trading has already begun. Nor does this filing mean the SEC endorses ZEC as an investment.
The second step is to examine how the product works. The filing describes a trust that holds ZEC, with shares representing an interest in the trust’s assets. Authorized participants may take part in creations and redemptions through a basket mechanism, while the specifics of how cash or ZEC enters the trust remain subject to later filings, service-provider arrangements, and actual operations. This differs from products that obtain exposure solely through ZEC futures, but the filing alone cannot be taken as evidence of spot buying on the day or future net inflows.
The third step is to verify what has yet to happen: whether the registration statement becomes effective, whether the exchange issues a listing notice, and whether the final ticker, fee rate, and post-launch trading volume materialize. The objectives and blank fields in the preliminary filing may be revised. Only once each of these subsequent steps is confirmed can we discuss actual market impact. In particular, discussion volume on a trending list should not be mistaken for fund demand or buying volume.
This update confirms only the existence and wording of the preliminary document dated October 6 on the SEC website; it does not describe the ETF as approved, listed, or already buying coins. Readers following the story should first check for subsequent SEC notices that the registration statement has become effective and official Nasdaq announcements, then compare these with actual creation and redemption activity and holdings disclosures.
The first step that has taken place is the filing of registration documents. The preliminary prospectus states explicitly that the information in the filing is incomplete and may change, and that securities may not be sold before the registration statement becomes effective. One section says the shares “will” trade on Nasdaq, while another says the fund is “seeking” a listing. The cautious interpretation is that a listing is proposed—not that trading has already begun. Nor does this filing mean the SEC endorses ZEC as an investment.
The second step is to examine how the product works. The filing describes a trust that holds ZEC, with shares representing an interest in the trust’s assets. Authorized participants may take part in creations and redemptions through a basket mechanism, while the specifics of how cash or ZEC enters the trust remain subject to later filings, service-provider arrangements, and actual operations. This differs from products that obtain exposure solely through ZEC futures, but the filing alone cannot be taken as evidence of spot buying on the day or future net inflows.
The third step is to verify what has yet to happen: whether the registration statement becomes effective, whether the exchange issues a listing notice, and whether the final ticker, fee rate, and post-launch trading volume materialize. The objectives and blank fields in the preliminary filing may be revised. Only once each of these subsequent steps is confirmed can we discuss actual market impact. In particular, discussion volume on a trending list should not be mistaken for fund demand or buying volume.
This update confirms only the existence and wording of the preliminary document dated October 6 on the SEC website; it does not describe the ETF as approved, listed, or already buying coins. Readers following the story should first check for subsequent SEC notices that the registration statement has become effective and official Nasdaq announcements, then compare these with actual creation and redemption activity and holdings disclosures.
208
·
--
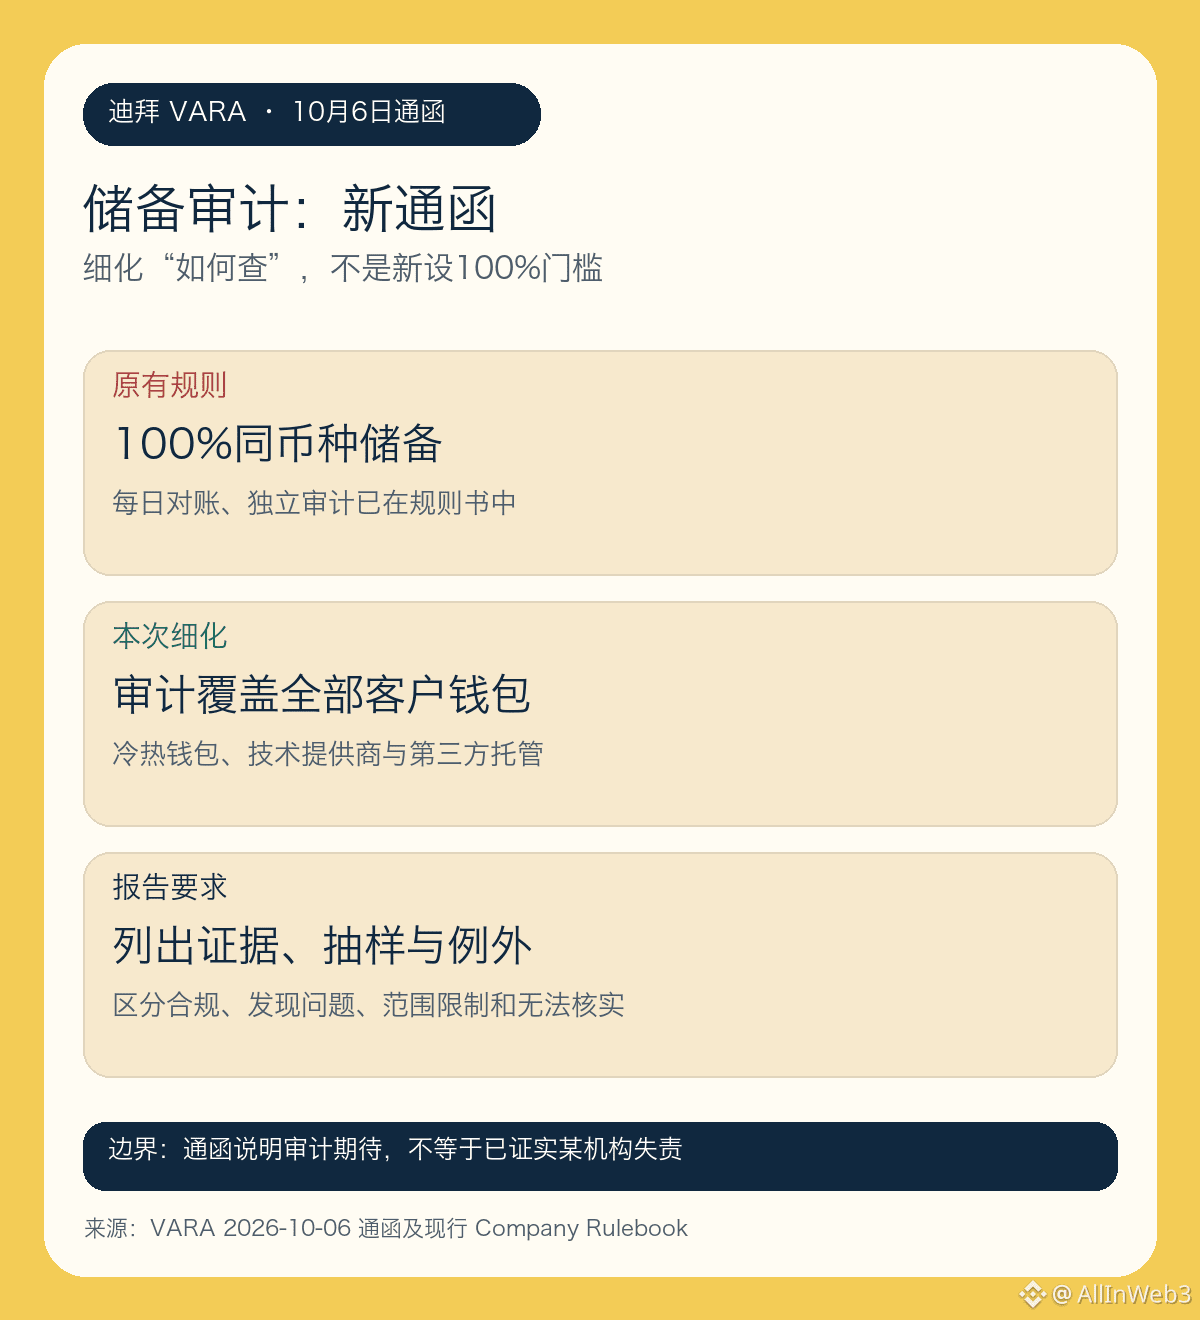
#Dubai’s VARA issues rules on reserve asset audits; the key change is not a sudden increase in the reserve ratio to 100%. VARA’s website lists the October 6 circular, “Audit Reports on Reserve Assets.” Following its review of proof-of-reserves reports submitted in 2025, the circular clarifies what independent audits should examine and how reports should be written. Comparing the old rules with the new circular makes the update clear.
The first layer is the existing obligations. VARA’s current Company Rulebook already requires regulated virtual asset service providers to maintain 100% reserves against client liabilities, holding a one-to-one amount of the same virtual asset owed, reconciling daily, and undergoing independent third-party audits. So “100% reserves” and “daily reconciliation” are not new requirements introduced on October 6. The circular cites these existing requirements so audit opinions genuinely test whether they were met throughout the review period, rather than checking the balance on just one reporting date.
The second layer is the scope of verification. The circular requires audits to cover, at a minimum, all wallets holding clients’ virtual assets, including hot, warm, and cold wallets, technology service providers’ infrastructure, and third-party custodians. Audits must also check whether client assets are segregated from the provider’s own assets, whether the provider controls the relevant wallets, and whether any lending, staking, or other arrangements for using client assets existed during the review period. This provides more insight than a snapshot of total balances, but the circular itself does not declare any particular provider to be in violation.
The third layer is report traceability. Audit reports should specify the procedures performed, evidence obtained, sampling methods used across the review period, reliance on third-party materials, and any scope limitations. Conclusions should distinguish between compliance, identified exceptions, and items that could not be independently verified. Where independent evidence is available, management representations alone cannot be used as a substitute. External audits also do not relieve providers or their management of their ongoing responsibility to protect client assets.
What readers should look for next is whether subsequent audit reports from the covered providers disclose their scope, how exceptions were handled, and what verifiable evidence supports their conclusions—not whether the circular’s title is taken as a sign that an exchange has collapsed or that a token is set to benefit. VARA’s jurisdiction covers the relevant areas of Dubai, excluding the DIFC; the applicable rules also depend on the type of entity and activity. This is a comparison with the original text as of October 7 and does not imply any direction for prices.
#Dubai’s VARA issues rules on reserve asset audits; the key change is not a sudden increase in the reserve ratio to 100%. VARA’s website lists the October 6 circular, “Audit Reports on Reserve Assets.” Following its review of proof-of-reserves reports submitted in 2025, the circular clarifies what independent audits should examine and how reports should be written. Comparing the old rules with the new circular makes the update clear.
The first layer is the existing obligations. VARA’s current Company Rulebook already requires regulated virtual asset service providers to maintain 100% reserves against client liabilities, holding a one-to-one amount of the same virtual asset owed, reconciling daily, and undergoing independent third-party audits. So “100% reserves” and “daily reconciliation” are not new requirements introduced on October 6. The circular cites these existing requirements so audit opinions genuinely test whether they were met throughout the review period, rather than checking the balance on just one reporting date.
The second layer is the scope of verification. The circular requires audits to cover, at a minimum, all wallets holding clients’ virtual assets, including hot, warm, and cold wallets, technology service providers’ infrastructure, and third-party custodians. Audits must also check whether client assets are segregated from the provider’s own assets, whether the provider controls the relevant wallets, and whether any lending, staking, or other arrangements for using client assets existed during the review period. This provides more insight than a snapshot of total balances, but the circular itself does not declare any particular provider to be in violation.
The third layer is report traceability. Audit reports should specify the procedures performed, evidence obtained, sampling methods used across the review period, reliance on third-party materials, and any scope limitations. Conclusions should distinguish between compliance, identified exceptions, and items that could not be independently verified. Where independent evidence is available, management representations alone cannot be used as a substitute. External audits also do not relieve providers or their management of their ongoing responsibility to protect client assets.
What readers should look for next is whether subsequent audit reports from the covered providers disclose their scope, how exceptions were handled, and what verifiable evidence supports their conclusions—not whether the circular’s title is taken as a sign that an exchange has collapsed or that a token is set to benefit. VARA’s jurisdiction covers the relevant areas of Dubai, excluding the DIFC; the applicable rules also depend on the type of entity and activity. This is a comparison with the original text as of October 7 and does not imply any direction for prices.
The first layer is the existing obligations. VARA’s current Company Rulebook already requires regulated virtual asset service providers to maintain 100% reserves against client liabilities, holding a one-to-one amount of the same virtual asset owed, reconciling daily, and undergoing independent third-party audits. So “100% reserves” and “daily reconciliation” are not new requirements introduced on October 6. The circular cites these existing requirements so audit opinions genuinely test whether they were met throughout the review period, rather than checking the balance on just one reporting date.
The second layer is the scope of verification. The circular requires audits to cover, at a minimum, all wallets holding clients’ virtual assets, including hot, warm, and cold wallets, technology service providers’ infrastructure, and third-party custodians. Audits must also check whether client assets are segregated from the provider’s own assets, whether the provider controls the relevant wallets, and whether any lending, staking, or other arrangements for using client assets existed during the review period. This provides more insight than a snapshot of total balances, but the circular itself does not declare any particular provider to be in violation.
The third layer is report traceability. Audit reports should specify the procedures performed, evidence obtained, sampling methods used across the review period, reliance on third-party materials, and any scope limitations. Conclusions should distinguish between compliance, identified exceptions, and items that could not be independently verified. Where independent evidence is available, management representations alone cannot be used as a substitute. External audits also do not relieve providers or their management of their ongoing responsibility to protect client assets.
What readers should look for next is whether subsequent audit reports from the covered providers disclose their scope, how exceptions were handled, and what verifiable evidence supports their conclusions—not whether the circular’s title is taken as a sign that an exchange has collapsed or that a token is set to benefit. VARA’s jurisdiction covers the relevant areas of Dubai, excluding the DIFC; the applicable rules also depend on the type of entity and activity. This is a comparison with the original text as of October 7 and does not imply any direction for prices.
1
33
·
--
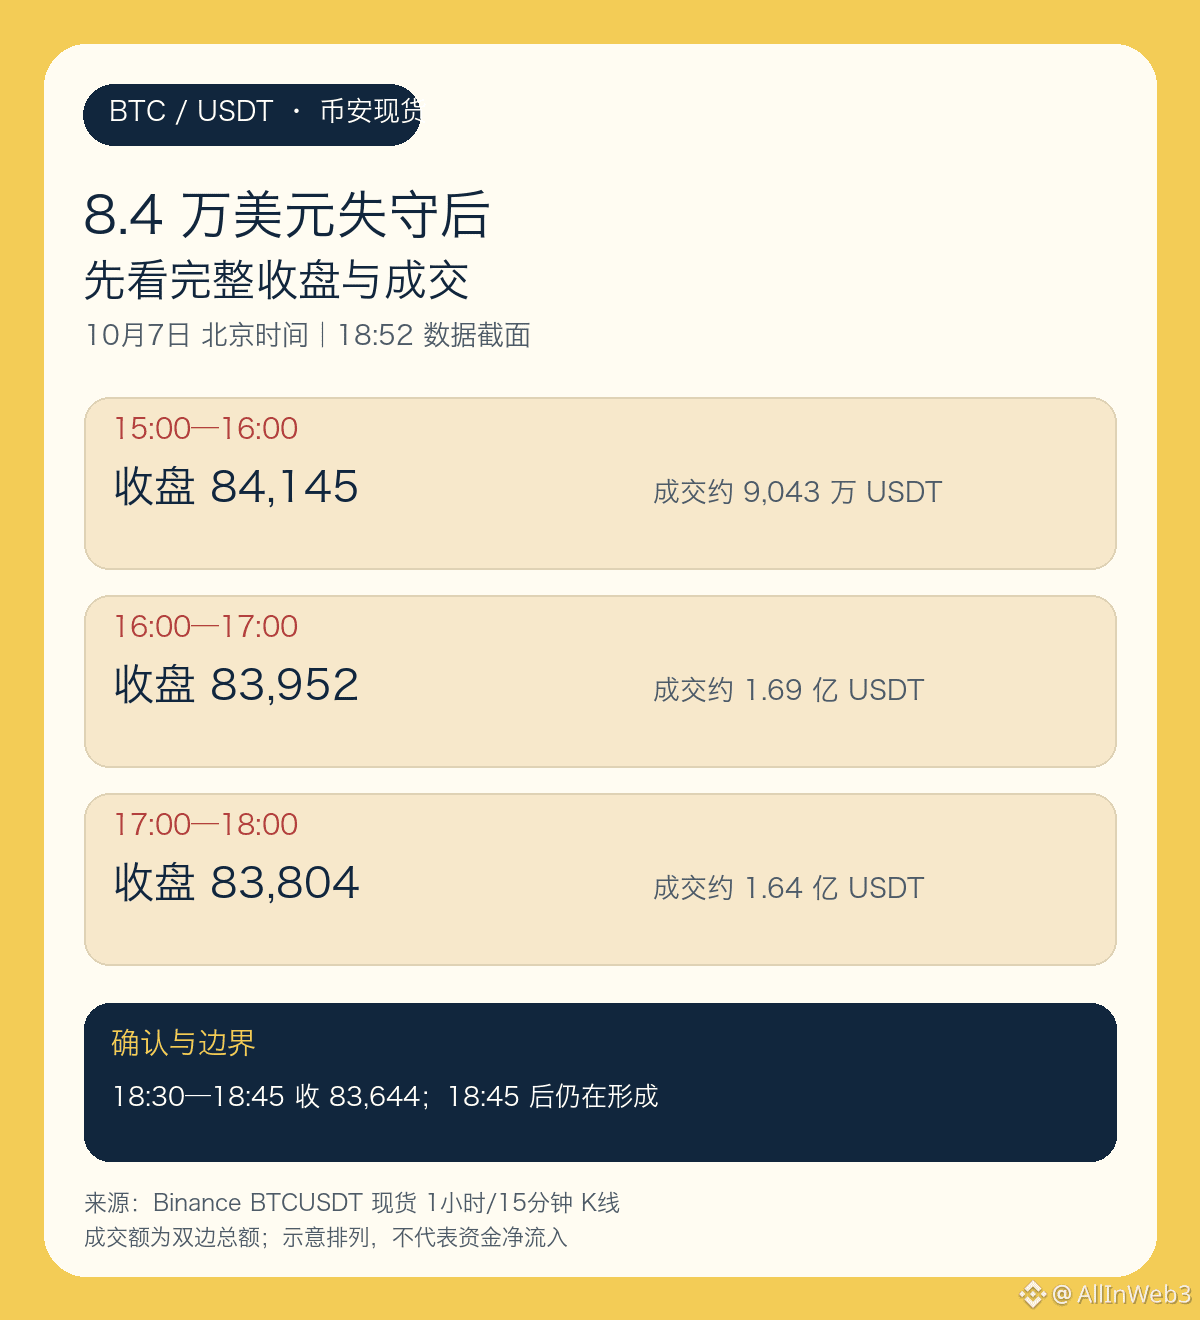
#Bitcoin falls below $84,000: What matters more this time is consecutive closes, not treating a single intraday lower wick as a reversal. At 18:43 Beijing time, the topic ranked No. 2 on Binance Square’s trending list; at 18:52, Binance’s public BTCUSDT spot market data showed a price of about $83,797, down approximately 2.82% over the rolling 24-hour period. These figures reflect the time they were collected; prices will change.
First, let’s look at how the price broke below the level. The complete hourly candle from 15:00 to 16:00 closed at $84,145; the 16:00–17:00 candle closed at $83,952, and the 17:00–18:00 candle closed at $83,804. Two consecutive complete hourly candles below $84,000 are more telling than a momentary touch of the level, suggesting the market did not quickly reclaim the former round-number support. But this only describes the closing structure for this exchange and spot trading pair during those windows; it cannot directly indicate the direction of market-wide capital flows.
Trading volume also offers limited insight. Spot trading volume from 16:00 to 17:00 was about 169 million USDT, up roughly 87% from about 90.43 million in the previous hour; from 17:00 to 18:00, it remained around 164 million, slightly below the previous hour. Trading activity clearly picked up during the break below the level and remained elevated afterward. Trading volume is the total value of matched buys and sells, not net outflows, and it cannot be used to determine leveraged positions or liquidation volumes. This account does not attribute the decline to any unverified single news item.
Next, let’s look at the low and the rebound. The complete 15-minute candle from 18:00 to 18:15 reached a low of $83,442 and closed back at $83,836; the 18:30–18:45 candle closed at $83,644. The first shows that there was a rebound from the low, while the second is a reminder that support has not yet stabilized, so we should not focus only on the more favorable candle. The 18:45–19:00 candle was still forming at the time, so it should not be described in advance as having closed. Earlier, the complete four-hour candle from 12:00 to 16:00 closed at $84,145; the 16:00–20:00 four-hour candle had not yet finished.
Next, watch whether the hourly candle closing at 19:00 gets back above $84,000, and whether the complete four-hour candle at 20:00 can reclaim this area. If it still closes below, the round-number level is more likely to act as short-term resistance. If the price moves back above it, check whether trading volume over the same period continues to support the move. This is a timeline review of Binance spot trading, not a price target or a signal to chase the market.
#Bitcoin falls below $84,000: What matters more this time is consecutive closes, not treating a single intraday lower wick as a reversal. At 18:43 Beijing time, the topic ranked No. 2 on Binance Square’s trending list; at 18:52, Binance’s public BTCUSDT spot market data showed a price of about $83,797, down approximately 2.82% over the rolling 24-hour period. These figures reflect the time they were collected; prices will change.
First, let’s look at how the price broke below the level. The complete hourly candle from 15:00 to 16:00 closed at $84,145; the 16:00–17:00 candle closed at $83,952, and the 17:00–18:00 candle closed at $83,804. Two consecutive complete hourly candles below $84,000 are more telling than a momentary touch of the level, suggesting the market did not quickly reclaim the former round-number support. But this only describes the closing structure for this exchange and spot trading pair during those windows; it cannot directly indicate the direction of market-wide capital flows.
Trading volume also offers limited insight. Spot trading volume from 16:00 to 17:00 was about 169 million USDT, up roughly 87% from about 90.43 million in the previous hour; from 17:00 to 18:00, it remained around 164 million, slightly below the previous hour. Trading activity clearly picked up during the break below the level and remained elevated afterward. Trading volume is the total value of matched buys and sells, not net outflows, and it cannot be used to determine leveraged positions or liquidation volumes. This account does not attribute the decline to any unverified single news item.
Next, let’s look at the low and the rebound. The complete 15-minute candle from 18:00 to 18:15 reached a low of $83,442 and closed back at $83,836; the 18:30–18:45 candle closed at $83,644. The first shows that there was a rebound from the low, while the second is a reminder that support has not yet stabilized, so we should not focus only on the more favorable candle. The 18:45–19:00 candle was still forming at the time, so it should not be described in advance as having closed. Earlier, the complete four-hour candle from 12:00 to 16:00 closed at $84,145; the 16:00–20:00 four-hour candle had not yet finished.
Next, watch whether the hourly candle closing at 19:00 gets back above $84,000, and whether the complete four-hour candle at 20:00 can reclaim this area. If it still closes below, the round-number level is more likely to act as short-term resistance. If the price moves back above it, check whether trading volume over the same period continues to support the move. This is a timeline review of Binance spot trading, not a price target or a signal to chase the market.
First, let’s look at how the price broke below the level. The complete hourly candle from 15:00 to 16:00 closed at $84,145; the 16:00–17:00 candle closed at $83,952, and the 17:00–18:00 candle closed at $83,804. Two consecutive complete hourly candles below $84,000 are more telling than a momentary touch of the level, suggesting the market did not quickly reclaim the former round-number support. But this only describes the closing structure for this exchange and spot trading pair during those windows; it cannot directly indicate the direction of market-wide capital flows.
Trading volume also offers limited insight. Spot trading volume from 16:00 to 17:00 was about 169 million USDT, up roughly 87% from about 90.43 million in the previous hour; from 17:00 to 18:00, it remained around 164 million, slightly below the previous hour. Trading activity clearly picked up during the break below the level and remained elevated afterward. Trading volume is the total value of matched buys and sells, not net outflows, and it cannot be used to determine leveraged positions or liquidation volumes. This account does not attribute the decline to any unverified single news item.
Next, let’s look at the low and the rebound. The complete 15-minute candle from 18:00 to 18:15 reached a low of $83,442 and closed back at $83,836; the 18:30–18:45 candle closed at $83,644. The first shows that there was a rebound from the low, while the second is a reminder that support has not yet stabilized, so we should not focus only on the more favorable candle. The 18:45–19:00 candle was still forming at the time, so it should not be described in advance as having closed. Earlier, the complete four-hour candle from 12:00 to 16:00 closed at $84,145; the 16:00–20:00 four-hour candle had not yet finished.
Next, watch whether the hourly candle closing at 19:00 gets back above $84,000, and whether the complete four-hour candle at 20:00 can reclaim this area. If it still closes below, the round-number level is more likely to act as short-term resistance. If the price moves back above it, check whether trading volume over the same period continues to support the move. This is a timeline review of Binance spot trading, not a price target or a signal to chase the market.
1
31
·
--
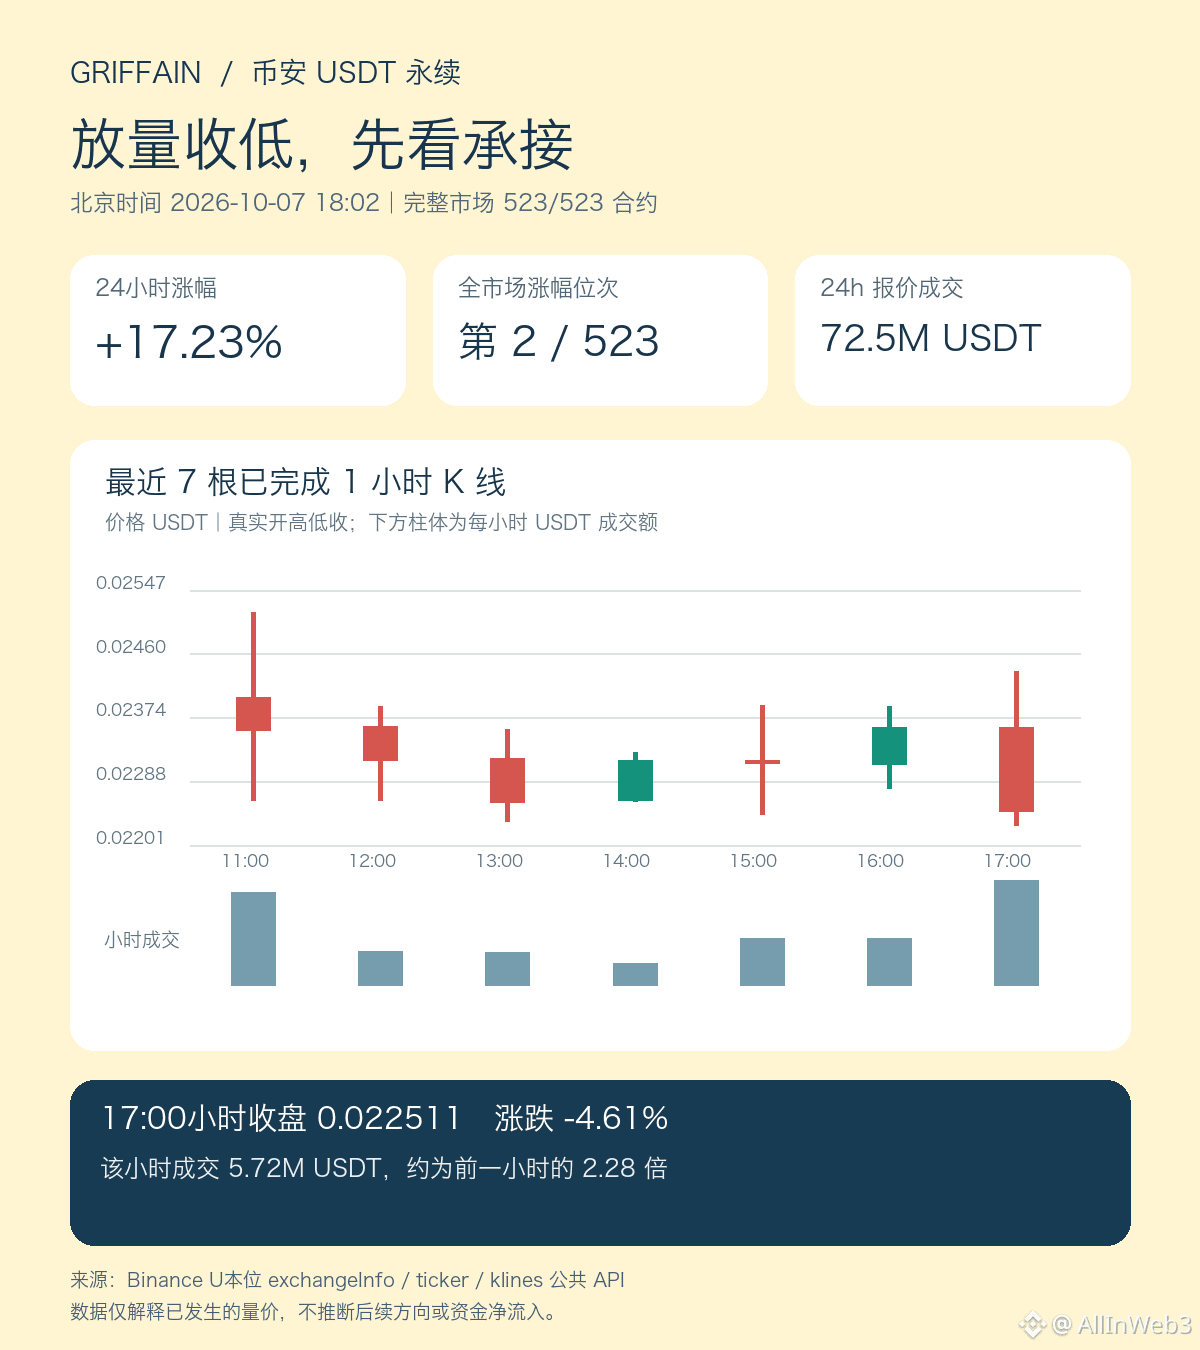
$GRIFFAIN: I’m inclined to wait and see in the short term. It remains among the top gainers in Binance’s USDT-margined perpetual futures, but the latest completed hourly candle reminds me that a 24-hour gain and short-term buying support are two different things. At 18:02 Beijing time, all 523 contracts within the screened universe had complete market data. GRIFFAINUSDT ranked second, up 17.23% over the rolling 24 hours, with approximately 72.47 million USDT in quote volume. In a rescan at 18:05, it ranked third, up 16.82%. The ranking and gain figures apply only to their respective sampling times and should not be taken as a guarantee of continued strength.
First, let’s look at how the price moved. The complete four-hour candle from 04:00 to 08:00 today closed at 0.025660, up from an opening price of 0.023363. The following candle, from 08:00 to 12:00, closed back down at 0.023601. In other words, the early surge did not firmly establish a higher four-hour closing range. The evidence here is the pullback across consecutive candles—not an assumption that a single 24-hour gain means the price rose steadily throughout the day.
I’m more concerned about the just-completed 17:00–18:00 hourly candle: it opened at 0.023598, reached an intrahour high of 0.024365, and ultimately closed at 0.022511, down approximately 4.61% from the open. Its USDT quote volume was approximately 5.72 million, 2.28 times the roughly 2.51 million in the previous hour. The higher volume alongside a lower close indicates intense trading and genuine selling pressure overhead. However, quote volume is not the same as net selling, and one candle alone cannot confirm that the trend has fully reversed. The chart shows only seven completed hourly candles and does not include the still-open candle after 18:00.
Positioning and fees also do not point to a clear one-way move. Binance’s public open-interest quantity sample rose from approximately 306.7 million tokens at 16:00 to 312.0 million at 18:00, an increase of about 1.7%. The most recent settled funding rate was +0.006639% at 16:00. This indicates that futures risk remains in the market and that the cost of holding positions is tilted slightly toward longs paying shorts. But rising open interest does not mean net capital inflows, nor does it show that all new positions are long. I have not found first-hand evidence sufficient to attribute this move to a single announcement about a new project, so I won’t force a catalyst to explain the price action.
For confirmation, I’d look for a completed hourly candle to reclaim the area around 0.02360, with volume backing it up. If the price remains below this area, the pressure signaled by the high-volume close at 17:00 deserves attention. Conversely, the setup would be invalidated if the recent low around 0.02228 is breached again, making the risk of further retracement clearer. These levels are conditions to monitor, not a certain trading path or price target.
$GRIFFAIN : I’m inclined to wait and see in the short term. It remains among the top gainers in Binance’s USDT-margined perpetual futures, but the latest completed hourly candle reminds me that a 24-hour gain and short-term buying support are two different things. At 18:02 Beijing time, all 523 contracts within the screened universe had complete market data. GRIFFAINUSDT ranked second, up 17.23% over the rolling 24 hours, with approximately 72.47 million USDT in quote volume. In a rescan at 18:05, it ranked third, up 16.82%. The ranking and gain figures apply only to their respective sampling times and should not be taken as a guarantee of continued strength.
First, let’s look at how the price moved. The complete four-hour candle from 04:00 to 08:00 today closed at 0.025660, up from an opening price of 0.023363. The following candle, from 08:00 to 12:00, closed back down at 0.023601. In other words, the early surge did not firmly establish a higher four-hour closing range. The evidence here is the pullback across consecutive candles—not an assumption that a single 24-hour gain means the price rose steadily throughout the day.
I’m more concerned about the just-completed 17:00–18:00 hourly candle: it opened at 0.023598, reached an intrahour high of 0.024365, and ultimately closed at 0.022511, down approximately 4.61% from the open. Its USDT quote volume was approximately 5.72 million, 2.28 times the roughly 2.51 million in the previous hour. The higher volume alongside a lower close indicates intense trading and genuine selling pressure overhead. However, quote volume is not the same as net selling, and one candle alone cannot confirm that the trend has fully reversed. The chart shows only seven completed hourly candles and does not include the still-open candle after 18:00.
Positioning and fees also do not point to a clear one-way move. Binance’s public open-interest quantity sample rose from approximately 306.7 million tokens at 16:00 to 312.0 million at 18:00, an increase of about 1.7%. The most recent settled funding rate was +0.006639% at 16:00. This indicates that futures risk remains in the market and that the cost of holding positions is tilted slightly toward longs paying shorts. But rising open interest does not mean net capital inflows, nor does it show that all new positions are long. I have not found first-hand evidence sufficient to attribute this move to a single announcement about a new project, so I won’t force a catalyst to explain the price action.
For confirmation, I’d look for a completed hourly candle to reclaim the area around 0.02360, with volume backing it up. If the price remains below this area, the pressure signaled by the high-volume close at 17:00 deserves attention. Conversely, the setup would be invalidated if the recent low around 0.02228 is breached again, making the risk of further retracement clearer. These levels are conditions to monitor, not a certain trading path or price target.
First, let’s look at how the price moved. The complete four-hour candle from 04:00 to 08:00 today closed at 0.025660, up from an opening price of 0.023363. The following candle, from 08:00 to 12:00, closed back down at 0.023601. In other words, the early surge did not firmly establish a higher four-hour closing range. The evidence here is the pullback across consecutive candles—not an assumption that a single 24-hour gain means the price rose steadily throughout the day.
I’m more concerned about the just-completed 17:00–18:00 hourly candle: it opened at 0.023598, reached an intrahour high of 0.024365, and ultimately closed at 0.022511, down approximately 4.61% from the open. Its USDT quote volume was approximately 5.72 million, 2.28 times the roughly 2.51 million in the previous hour. The higher volume alongside a lower close indicates intense trading and genuine selling pressure overhead. However, quote volume is not the same as net selling, and one candle alone cannot confirm that the trend has fully reversed. The chart shows only seven completed hourly candles and does not include the still-open candle after 18:00.
Positioning and fees also do not point to a clear one-way move. Binance’s public open-interest quantity sample rose from approximately 306.7 million tokens at 16:00 to 312.0 million at 18:00, an increase of about 1.7%. The most recent settled funding rate was +0.006639% at 16:00. This indicates that futures risk remains in the market and that the cost of holding positions is tilted slightly toward longs paying shorts. But rising open interest does not mean net capital inflows, nor does it show that all new positions are long. I have not found first-hand evidence sufficient to attribute this move to a single announcement about a new project, so I won’t force a catalyst to explain the price action.
For confirmation, I’d look for a completed hourly candle to reclaim the area around 0.02360, with volume backing it up. If the price remains below this area, the pressure signaled by the high-volume close at 17:00 deserves attention. Conversely, the setup would be invalidated if the recent low around 0.02228 is breached again, making the risk of further retracement clearer. These levels are conditions to monitor, not a certain trading path or price target.
1
198
·
--
In a complete scan of Binance USDT-margined perpetual contracts at 17:00 Beijing time, $NMR ranked first in gains: all 523 qualifying contracts had valid market data, and NMRUSDT rose 37.59% over the rolling 24 hours, with about 415 million USDT in quote volume. My view: the strength has already materialized, but for now I’d stay cautious and watch how the market absorbs selling after the high turnover, rather than treating the top ranking as a reason to chase the rally.
This move had two phases. The complete four-hour candle from 16:00 to 20:00 on October 6 opened near 12.084 and closed at 15.617, with about 50.24 million USDT in quote volume. The next candle, from 20:00 to 24:00, closed at 17.180 on about 113 million USDT in volume. So the rally was not just an isolated 24-hour gain figure; it was accompanied by a sustained increase in trading activity. But higher volume only indicates greater turnover—it does not mean that all the new activity came from buyers.
Today’s divergence is also clear. The complete hourly candle at 10:00 reached a high of 17.869 and a low of 15.376, with about 37.56 million USDT in volume, but ultimately closed at 16.166. The 12:00 hourly candle then closed at 17.474, but the price failed to hold there; the complete 16:00 hourly candle closed at 16.607. Repeated rallies followed by rapid pullbacks point to rising volatility and leverage pressure. Intraday highs should not be described as a new platform that has already been firmly established.
Now consider positioning and fees: Binance’s public open-interest data show that contract open interest rose from about 463,200 NMR at 16:00 on October 6 to about 866,000 NMR at 16:00 today, an increase of roughly 86.9%. The latest settled funding rate, at 16:00, was about -0.415% per four hours. The simultaneous expansion in volume and open interest means more contract risk is staying in the market. The negative funding rate indicates a clear imbalance in the cost of holding long and short positions. But neither metric alone proves that “shorts are being squeezed,” nor can they reveal the net direction of new positions or the scale of liquidations that have occurred.
NMR is the staking and settlement token for Numerai’s prediction tournaments; holding it does not mean holding an equity interest in its funds. I found no first-hand evidence sufficient to attribute this leg of the perpetual-contract rally to a single project announcement, so my assessment is based only on verified market structure. If a complete hourly candle later recaptures and holds near 17.47, with volume confirming the move, the case for continued strength would improve. If the recent pullback low near 16.09 gives way, beware of a deeper retracement after the rally. These prices are conditions to watch, not targets or a guaranteed path.
In a complete scan of Binance USDT-margined perpetual contracts at 17:00 Beijing time, $NMR ranked first in gains: all 523 qualifying contracts had valid market data, and NMRUSDT rose 37.59% over the rolling 24 hours, with about 415 million USDT in quote volume. My view: the strength has already materialized, but for now I’d stay cautious and watch how the market absorbs selling after the high turnover, rather than treating the top ranking as a reason to chase the rally.
This move had two phases. The complete four-hour candle from 16:00 to 20:00 on October 6 opened near 12.084 and closed at 15.617, with about 50.24 million USDT in quote volume. The next candle, from 20:00 to 24:00, closed at 17.180 on about 113 million USDT in volume. So the rally was not just an isolated 24-hour gain figure; it was accompanied by a sustained increase in trading activity. But higher volume only indicates greater turnover—it does not mean that all the new activity came from buyers.
Today’s divergence is also clear. The complete hourly candle at 10:00 reached a high of 17.869 and a low of 15.376, with about 37.56 million USDT in volume, but ultimately closed at 16.166. The 12:00 hourly candle then closed at 17.474, but the price failed to hold there; the complete 16:00 hourly candle closed at 16.607. Repeated rallies followed by rapid pullbacks point to rising volatility and leverage pressure. Intraday highs should not be described as a new platform that has already been firmly established.
Now consider positioning and fees: Binance’s public open-interest data show that contract open interest rose from about 463,200 NMR at 16:00 on October 6 to about 866,000 NMR at 16:00 today, an increase of roughly 86.9%. The latest settled funding rate, at 16:00, was about -0.415% per four hours. The simultaneous expansion in volume and open interest means more contract risk is staying in the market. The negative funding rate indicates a clear imbalance in the cost of holding long and short positions. But neither metric alone proves that “shorts are being squeezed,” nor can they reveal the net direction of new positions or the scale of liquidations that have occurred.
NMR is the staking and settlement token for Numerai’s prediction tournaments; holding it does not mean holding an equity interest in its funds. I found no first-hand evidence sufficient to attribute this leg of the perpetual-contract rally to a single project announcement, so my assessment is based only on verified market structure. If a complete hourly candle later recaptures and holds near 17.47, with volume confirming the move, the case for continued strength would improve. If the recent pullback low near 16.09 gives way, beware of a deeper retracement after the rally. These prices are conditions to watch, not targets or a guaranteed path.
This move had two phases. The complete four-hour candle from 16:00 to 20:00 on October 6 opened near 12.084 and closed at 15.617, with about 50.24 million USDT in quote volume. The next candle, from 20:00 to 24:00, closed at 17.180 on about 113 million USDT in volume. So the rally was not just an isolated 24-hour gain figure; it was accompanied by a sustained increase in trading activity. But higher volume only indicates greater turnover—it does not mean that all the new activity came from buyers.
Today’s divergence is also clear. The complete hourly candle at 10:00 reached a high of 17.869 and a low of 15.376, with about 37.56 million USDT in volume, but ultimately closed at 16.166. The 12:00 hourly candle then closed at 17.474, but the price failed to hold there; the complete 16:00 hourly candle closed at 16.607. Repeated rallies followed by rapid pullbacks point to rising volatility and leverage pressure. Intraday highs should not be described as a new platform that has already been firmly established.
Now consider positioning and fees: Binance’s public open-interest data show that contract open interest rose from about 463,200 NMR at 16:00 on October 6 to about 866,000 NMR at 16:00 today, an increase of roughly 86.9%. The latest settled funding rate, at 16:00, was about -0.415% per four hours. The simultaneous expansion in volume and open interest means more contract risk is staying in the market. The negative funding rate indicates a clear imbalance in the cost of holding long and short positions. But neither metric alone proves that “shorts are being squeezed,” nor can they reveal the net direction of new positions or the scale of liquidations that have occurred.
NMR is the staking and settlement token for Numerai’s prediction tournaments; holding it does not mean holding an equity interest in its funds. I found no first-hand evidence sufficient to attribute this leg of the perpetual-contract rally to a single project announcement, so my assessment is based only on verified market structure. If a complete hourly candle later recaptures and holds near 17.47, with volume confirming the move, the case for continued strength would improve. If the recent pullback low near 16.09 gives way, beware of a deeper retracement after the rally. These prices are conditions to watch, not targets or a guaranteed path.
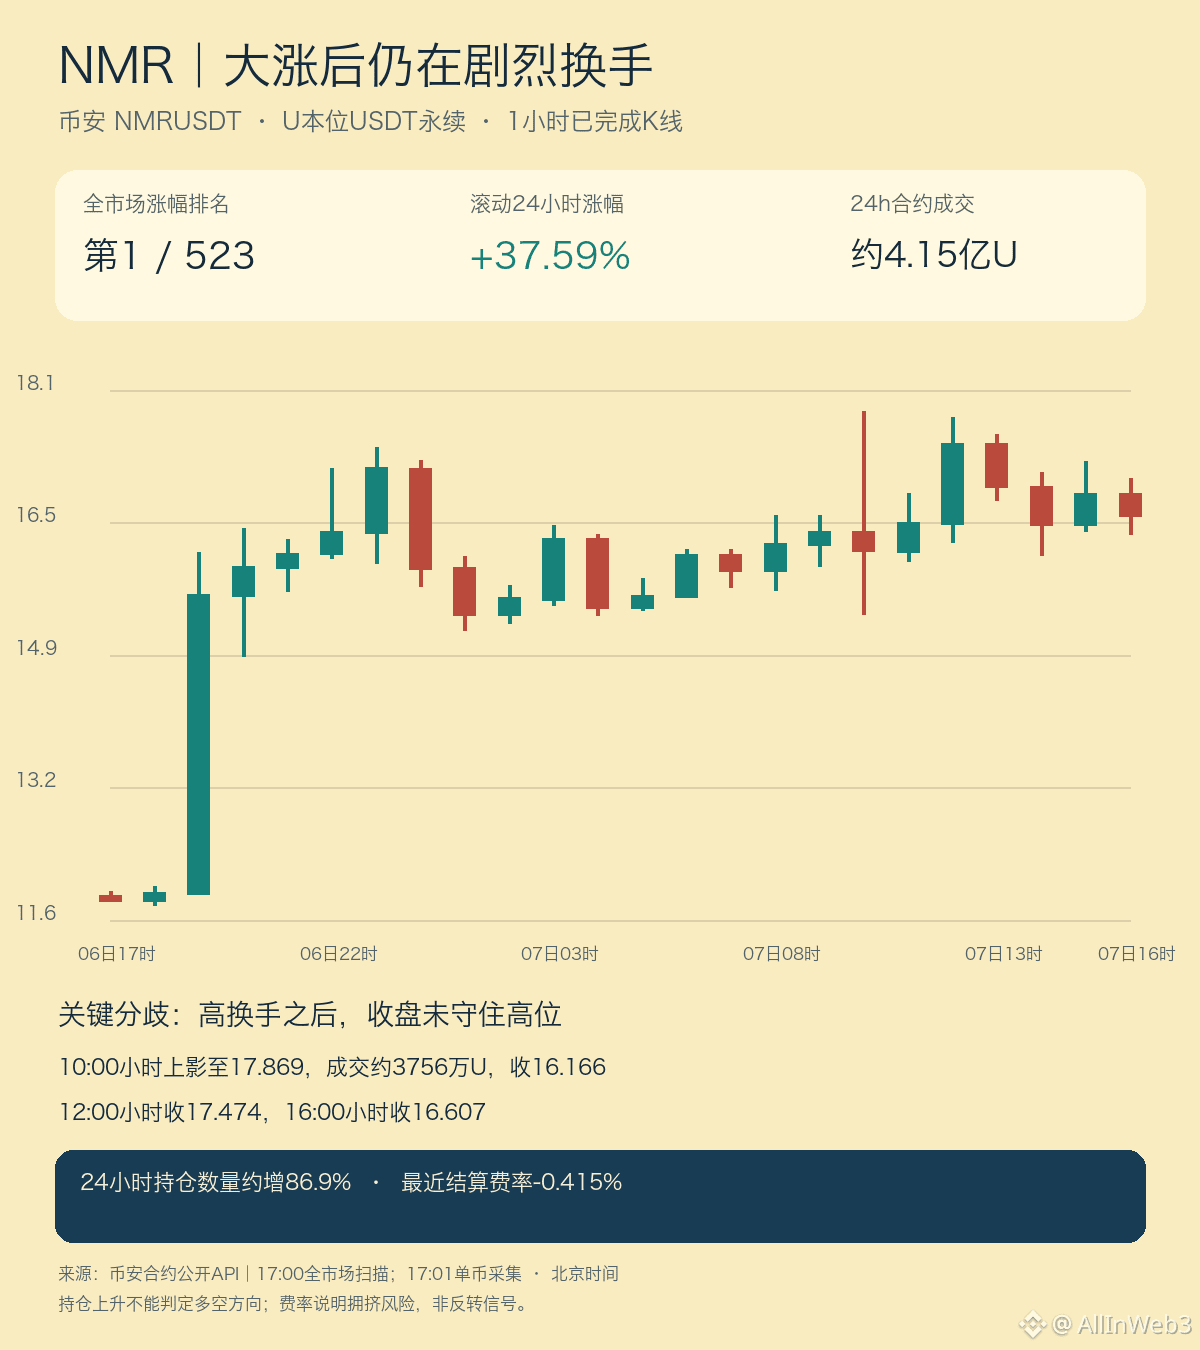
1
139
·
--
$VVV I’m leaning bearish and staying on the sidelines this round, with more focus on whether genuine buying support emerges after the decline. My October 3 post discussed the weak recovery in Aerodrome’s on-chain pool; today I’m checking price and volume using the Binance VVVUSDT perpetual contract instead. Quotes and trading conventions differ between the two markets, so the old pool’s key levels shouldn’t be mechanically carried over to the futures chart. But the new downtrend structure now warrants a separate update.
As of 16:50 Beijing time on October 7, the latest Binance contract price was around 26.60 USDT, down 5.10% over the rolling 24 hours, with about 28.13 million USDT in trading volume. The range high was 28.768 and the low was 26.430. On the hourly chart, the price reached a high of 28.768 at 22:00 last night and then pulled back. The complete hourly candle at 10:00 today touched 26.430, with about 2.74 million USDT in trading volume. By contrast, each of the three rebound hours from 13:00 to 15:00 had less than 700,000 USDT in volume. The price has bounced, but volume hasn’t shown that buyers have regained control of the pace.
The four-hour chart also can’t simply be described as “a bottom is in.” The 08:00–12:00 candle closed at 26.700; the 12:00–16:00 candle edged back up to 26.823, but the hourly candle after 16:00 was still unclosed, and the 16:50 snapshot had returned to around 26.60. Looking only at one rising candle could make it easy to overlook the heavier selling pressure in the preceding stretch and the pullback after the rebound.
Open interest in the perpetual contract rose from around 1.0513 million VVV last night to around 1.0682 million VVV at 16:00, an increase of about 1.6%, while price fell over the same period. The most recently settled funding rate was 0.005% every four hours. Rising open interest only indicates that the number of open contracts has increased; by itself, it can’t establish that “shorts are adding positions” or “longs are buying the dip.” Nor is a modestly positive funding rate enough to infer a short squeeze. The verified project announcements don’t provide a basis for attributing this decline to any particular new development. The emissions reduction plan previously announced by Venice was discussed in my last post and shouldn’t be repeated as today’s immediate catalyst.
Next, I’m watching for two confirmations. 26.43 is the low reached in this move; if a subsequent complete hourly candle breaks below it and the price fails to recover, weakness could continue. Above, the first level to watch is around today’s rebound high of 27.07. The price would need to reclaim that level and hold it on a retest, with volume picking up, for the recovery to be more convincing. Price, open interest, and funding rates all change; these are conditions to watch, not a certain path or an order recommendation.
$VVV I’m leaning bearish and staying on the sidelines this round, with more focus on whether genuine buying support emerges after the decline. My October 3 post discussed the weak recovery in Aerodrome’s on-chain pool; today I’m checking price and volume using the Binance VVVUSDT perpetual contract instead. Quotes and trading conventions differ between the two markets, so the old pool’s key levels shouldn’t be mechanically carried over to the futures chart. But the new downtrend structure now warrants a separate update.
As of 16:50 Beijing time on October 7, the latest Binance contract price was around 26.60 USDT, down 5.10% over the rolling 24 hours, with about 28.13 million USDT in trading volume. The range high was 28.768 and the low was 26.430. On the hourly chart, the price reached a high of 28.768 at 22:00 last night and then pulled back. The complete hourly candle at 10:00 today touched 26.430, with about 2.74 million USDT in trading volume. By contrast, each of the three rebound hours from 13:00 to 15:00 had less than 700,000 USDT in volume. The price has bounced, but volume hasn’t shown that buyers have regained control of the pace.
The four-hour chart also can’t simply be described as “a bottom is in.” The 08:00–12:00 candle closed at 26.700; the 12:00–16:00 candle edged back up to 26.823, but the hourly candle after 16:00 was still unclosed, and the 16:50 snapshot had returned to around 26.60. Looking only at one rising candle could make it easy to overlook the heavier selling pressure in the preceding stretch and the pullback after the rebound.
Open interest in the perpetual contract rose from around 1.0513 million VVV last night to around 1.0682 million VVV at 16:00, an increase of about 1.6%, while price fell over the same period. The most recently settled funding rate was 0.005% every four hours. Rising open interest only indicates that the number of open contracts has increased; by itself, it can’t establish that “shorts are adding positions” or “longs are buying the dip.” Nor is a modestly positive funding rate enough to infer a short squeeze. The verified project announcements don’t provide a basis for attributing this decline to any particular new development. The emissions reduction plan previously announced by Venice was discussed in my last post and shouldn’t be repeated as today’s immediate catalyst.
Next, I’m watching for two confirmations. 26.43 is the low reached in this move; if a subsequent complete hourly candle breaks below it and the price fails to recover, weakness could continue. Above, the first level to watch is around today’s rebound high of 27.07. The price would need to reclaim that level and hold it on a retest, with volume picking up, for the recovery to be more convincing. Price, open interest, and funding rates all change; these are conditions to watch, not a certain path or an order recommendation.
As of 16:50 Beijing time on October 7, the latest Binance contract price was around 26.60 USDT, down 5.10% over the rolling 24 hours, with about 28.13 million USDT in trading volume. The range high was 28.768 and the low was 26.430. On the hourly chart, the price reached a high of 28.768 at 22:00 last night and then pulled back. The complete hourly candle at 10:00 today touched 26.430, with about 2.74 million USDT in trading volume. By contrast, each of the three rebound hours from 13:00 to 15:00 had less than 700,000 USDT in volume. The price has bounced, but volume hasn’t shown that buyers have regained control of the pace.
The four-hour chart also can’t simply be described as “a bottom is in.” The 08:00–12:00 candle closed at 26.700; the 12:00–16:00 candle edged back up to 26.823, but the hourly candle after 16:00 was still unclosed, and the 16:50 snapshot had returned to around 26.60. Looking only at one rising candle could make it easy to overlook the heavier selling pressure in the preceding stretch and the pullback after the rebound.
Open interest in the perpetual contract rose from around 1.0513 million VVV last night to around 1.0682 million VVV at 16:00, an increase of about 1.6%, while price fell over the same period. The most recently settled funding rate was 0.005% every four hours. Rising open interest only indicates that the number of open contracts has increased; by itself, it can’t establish that “shorts are adding positions” or “longs are buying the dip.” Nor is a modestly positive funding rate enough to infer a short squeeze. The verified project announcements don’t provide a basis for attributing this decline to any particular new development. The emissions reduction plan previously announced by Venice was discussed in my last post and shouldn’t be repeated as today’s immediate catalyst.
Next, I’m watching for two confirmations. 26.43 is the low reached in this move; if a subsequent complete hourly candle breaks below it and the price fails to recover, weakness could continue. Above, the first level to watch is around today’s rebound high of 27.07. The price would need to reclaim that level and hold it on a retest, with volume picking up, for the recovery to be more convincing. Price, open interest, and funding rates all change; these are conditions to watch, not a certain path or an order recommendation.
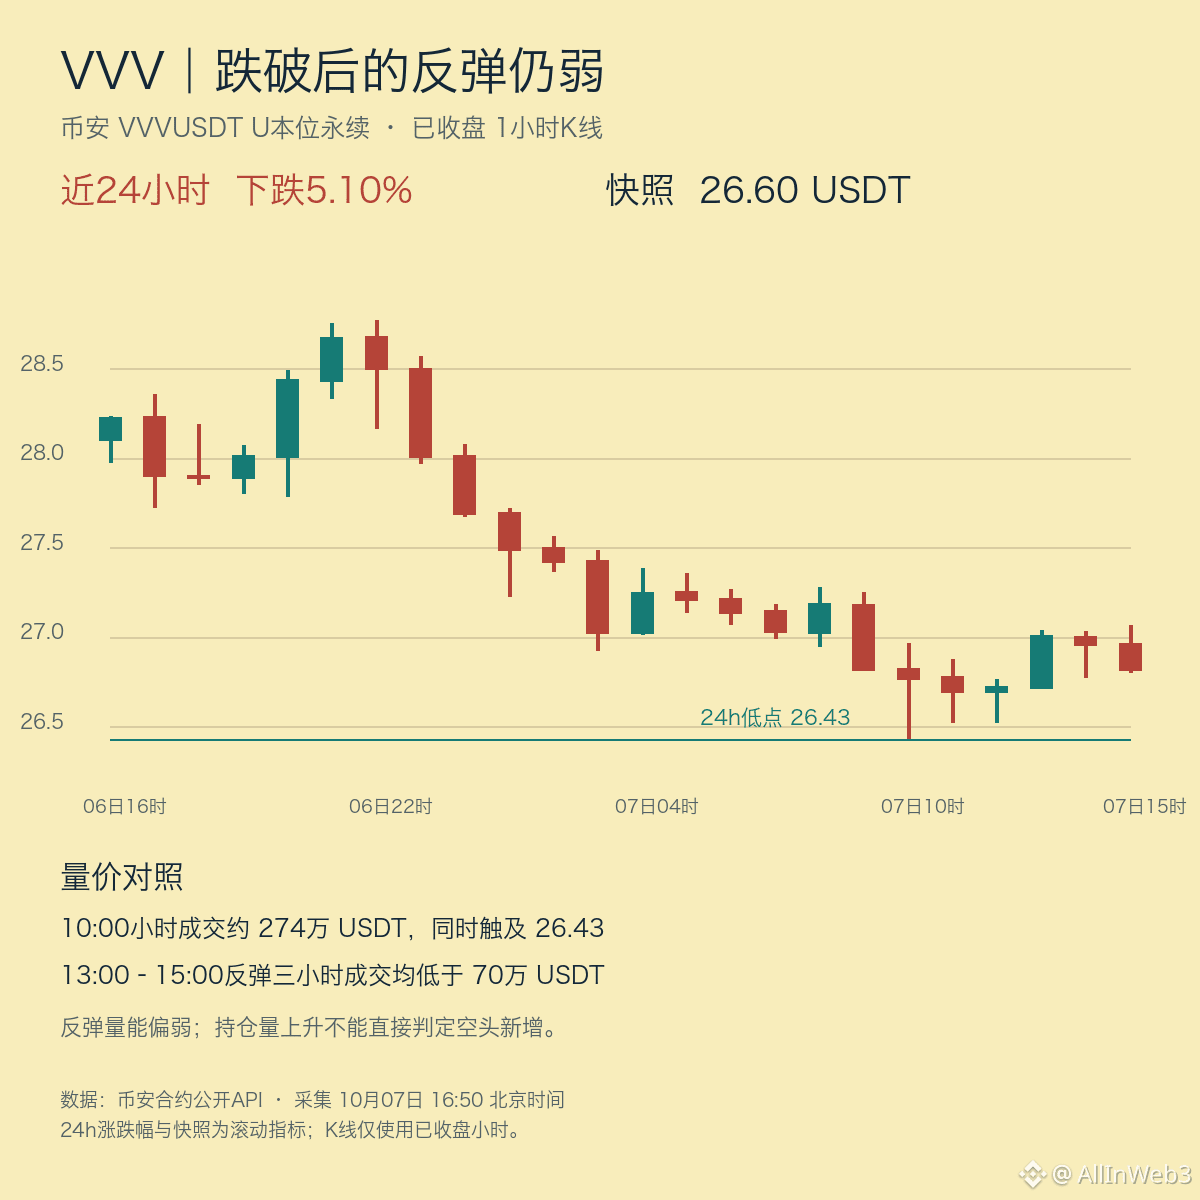
1
201
·
--
【ORCA Returns to No. 3 on the Gainers List: Vote Now Live, Price Causality Still Unconfirmed】
As of 07:08 Beijing time, a full scan of 523 eligible Binance USDⓈ-M USDT perpetuals ranked ORCAUSDT No. 3, up 35.659% over the rolling 24 hours, at 3.169 USDT, with approximately $368.5 million in quote-volume trading. A single-token snapshot at 07:04 showed a price of 3.172 and a 24-hour gain of 35.151%. These figures use different times and methodologies and should not be conflated as a single snapshot. Compared with this account’s ORCA post from October 6 at 17:05, the new developments are that the official vote has moved from discussion to the Realms voting stage, followed by a larger increase in price, volume, and open interest.
On October 6, Orca’s governance secretary said on the official forum that the tokenholder vote was live and would end on October 10 at 19:42 UTC. The proposal requires at least 3 million YES votes to pass, followed by a two-day cooling-off period, during which the execution can be blocked if the veto threshold of four Council members is reached. The proposal would change the allocation of protocol fees to 10% for the xORCA pool, 10% for discretionary team buybacks, and 80% for operations, and would transfer management of approximately 14.2 million ORCA and approximately 70,000 SOL to the team. The acquisition target has not been disclosed. These are all terms pending a vote, not changes that have already been implemented.
On the market side, the complete 00:00–04:00 four-hour candle closed at 2.826, up 6.72% from 2.648, with approximately $124.0 million in USDT-denominated trading volume. The 06:00–07:00 hourly candle closed at 3.167, up 3.36% from its open at 3.064, with approximately $26.87 million in volume. From 00:00 to 07:00, open interest increased by approximately 21.0%. The funding rate settled at -0.1738% at 04:00; the estimate at 07:04 was -0.1070%. This indicates that price, trading volume, and derivatives positioning expanded over the same period. A negative funding rate means shorts pay longs at settlement; open interest does not distinguish between long and short positions, and the funding rate does not prove a short squeeze or indicate the subsequent direction.
The launch of the official vote may be part of the backdrop drawing attention, but there is currently no evidence to identify it as the cause of this rally. Next, watch whether a full hourly close can hold above the 3.198–3.232 range and whether the hourly low near 3.020 holds. This is a structural observation, not a price target or trading recommendation.
Sources: Binance USD-M; Orca Governance Forum vote update and proposal: https://forums.orca.so/t/tokenholder-proposal-resourcing-orca-for-its-next-phase/1281
【ORCA Returns to No. 3 on the Gainers List: Vote Now Live, Price Causality Still Unconfirmed】
As of 07:08 Beijing time, a full scan of 523 eligible Binance USDⓈ-M USDT perpetuals ranked ORCAUSDT No. 3, up 35.659% over the rolling 24 hours, at 3.169 USDT, with approximately $368.5 million in quote-volume trading. A single-token snapshot at 07:04 showed a price of 3.172 and a 24-hour gain of 35.151%. These figures use different times and methodologies and should not be conflated as a single snapshot. Compared with this account’s ORCA post from October 6 at 17:05, the new developments are that the official vote has moved from discussion to the Realms voting stage, followed by a larger increase in price, volume, and open interest.
On October 6, Orca’s governance secretary said on the official forum that the tokenholder vote was live and would end on October 10 at 19:42 UTC. The proposal requires at least 3 million YES votes to pass, followed by a two-day cooling-off period, during which the execution can be blocked if the veto threshold of four Council members is reached. The proposal would change the allocation of protocol fees to 10% for the xORCA pool, 10% for discretionary team buybacks, and 80% for operations, and would transfer management of approximately 14.2 million ORCA and approximately 70,000 SOL to the team. The acquisition target has not been disclosed. These are all terms pending a vote, not changes that have already been implemented.
On the market side, the complete 00:00–04:00 four-hour candle closed at 2.826, up 6.72% from 2.648, with approximately $124.0 million in USDT-denominated trading volume. The 06:00–07:00 hourly candle closed at 3.167, up 3.36% from its open at 3.064, with approximately $26.87 million in volume. From 00:00 to 07:00, open interest increased by approximately 21.0%. The funding rate settled at -0.1738% at 04:00; the estimate at 07:04 was -0.1070%. This indicates that price, trading volume, and derivatives positioning expanded over the same period. A negative funding rate means shorts pay longs at settlement; open interest does not distinguish between long and short positions, and the funding rate does not prove a short squeeze or indicate the subsequent direction.
The launch of the official vote may be part of the backdrop drawing attention, but there is currently no evidence to identify it as the cause of this rally. Next, watch whether a full hourly close can hold above the 3.198–3.232 range and whether the hourly low near 3.020 holds. This is a structural observation, not a price target or trading recommendation.
Sources: Binance USD-M; Orca Governance Forum vote update and proposal: https://forums.orca.so/t/tokenholder-proposal-resourcing-orca-for-its-next-phase/1281
As of 07:08 Beijing time, a full scan of 523 eligible Binance USDⓈ-M USDT perpetuals ranked ORCAUSDT No. 3, up 35.659% over the rolling 24 hours, at 3.169 USDT, with approximately $368.5 million in quote-volume trading. A single-token snapshot at 07:04 showed a price of 3.172 and a 24-hour gain of 35.151%. These figures use different times and methodologies and should not be conflated as a single snapshot. Compared with this account’s ORCA post from October 6 at 17:05, the new developments are that the official vote has moved from discussion to the Realms voting stage, followed by a larger increase in price, volume, and open interest.
On October 6, Orca’s governance secretary said on the official forum that the tokenholder vote was live and would end on October 10 at 19:42 UTC. The proposal requires at least 3 million YES votes to pass, followed by a two-day cooling-off period, during which the execution can be blocked if the veto threshold of four Council members is reached. The proposal would change the allocation of protocol fees to 10% for the xORCA pool, 10% for discretionary team buybacks, and 80% for operations, and would transfer management of approximately 14.2 million ORCA and approximately 70,000 SOL to the team. The acquisition target has not been disclosed. These are all terms pending a vote, not changes that have already been implemented.
On the market side, the complete 00:00–04:00 four-hour candle closed at 2.826, up 6.72% from 2.648, with approximately $124.0 million in USDT-denominated trading volume. The 06:00–07:00 hourly candle closed at 3.167, up 3.36% from its open at 3.064, with approximately $26.87 million in volume. From 00:00 to 07:00, open interest increased by approximately 21.0%. The funding rate settled at -0.1738% at 04:00; the estimate at 07:04 was -0.1070%. This indicates that price, trading volume, and derivatives positioning expanded over the same period. A negative funding rate means shorts pay longs at settlement; open interest does not distinguish between long and short positions, and the funding rate does not prove a short squeeze or indicate the subsequent direction.
The launch of the official vote may be part of the backdrop drawing attention, but there is currently no evidence to identify it as the cause of this rally. Next, watch whether a full hourly close can hold above the 3.198–3.232 range and whether the hourly low near 3.020 holds. This is a structural observation, not a price target or trading recommendation.
Sources: Binance USD-M; Orca Governance Forum vote update and proposal: https://forums.orca.so/t/tokenholder-proposal-resourcing-orca-for-its-next-phase/1281
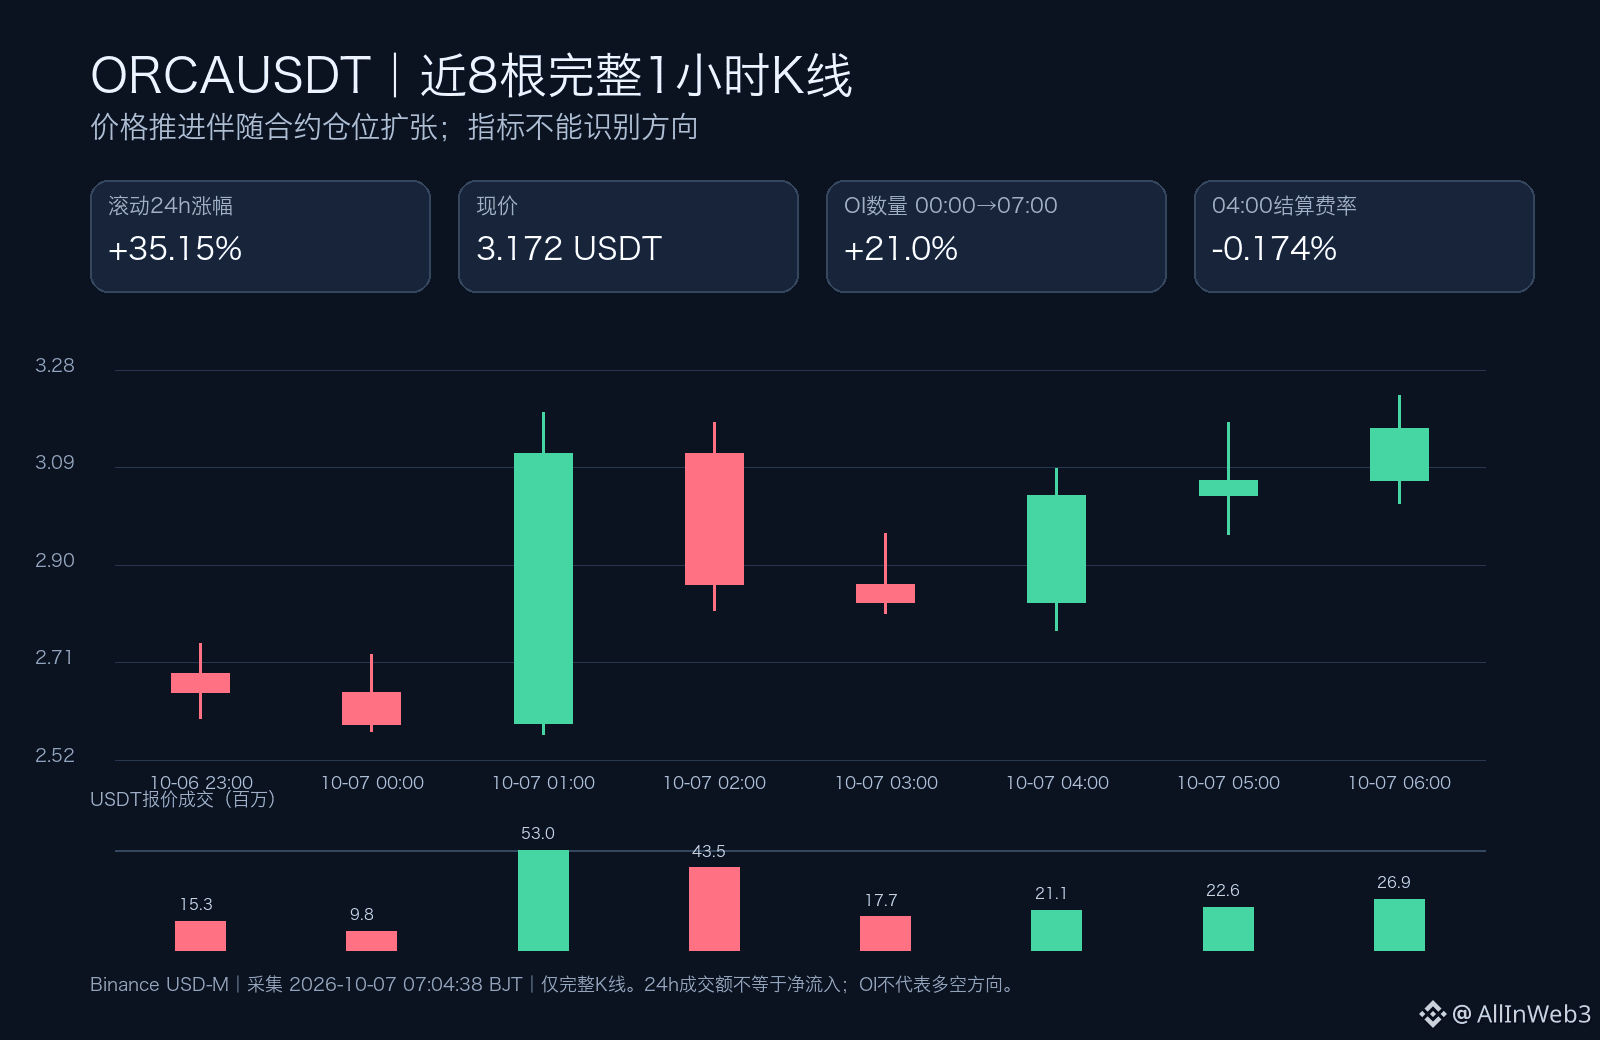
1
335
·
--
Current conclusion: stay on the sidelines; don’t chase the price. Lobster USDT ($Lobster) still ranks No. 1 on the gainers list, but its short-term structure has shifted from acceleration to retracement. At 06:23:23 Beijing time, a full scan covered all 523/523 eligible USDT perpetual contracts. Lobster was up 41.132% over 24 hours, with a scan price of 0.0615900 and $185.9 million in quote volume. After this analysis was drafted, another full scan at 06:29:37 again covered all 523/523 contracts, with Lobster still at No. 1, up 43.267% over 24 hours, at a scan price of 0.0629800, and with $187.8 million in quote volume. Compared with the scan snapshot when this account posted at 05:06 (+70.064%, 0.0740800), the latest price snapshot is about 15.0% lower, while rolling volume rose from $121.7 million to $187.8 million. Differences between snapshots are not investment returns, and trading volume is not net buying. The 06:26 single-token ticker and the full-market scan are timestamped differently, so they should not be treated as the same closing price.
The clearest turning point appears in the complete hourly candle: from 05:00 to 05:59, it opened at 0.06979, peaked at 0.08230, and closed at 0.06555—down about 6.08% from the open and 20.35% below the hourly high. Quote volume for that hour was about $56.4 million. The 06:00 hourly candle had not closed as of 06:26 and had dipped as low as 0.05770 intrahour. For now, this can only be described as an ongoing retracement; the low cannot be treated as confirmed support.
Positioning data also contracted: Binance open interest in contracts fell from about 570.7 million at 05:00 to 539.0 million at 06:00, a decrease of 5.56%. The price pullback coincided with a decline in open interest, indicating a reduction in position size, but the data does not distinguish between longs and shorts, so it cannot establish liquidations or the direction of capital flows. The most recent settled funding rate, for 04:00, was still +0.092984% per 4 hours, meaning longs paid for that period. This is information about the cost of holding positions, not proof of the next move.
No contemporaneous, first-hand project catalyst was found in this review. Binance’s March 11 futures listing announcement only confirms that it is a BNB Chain Chinese-language meme coin; it is not new information today. Next, wait for the 06:00 hourly candle to fully close, then watch whether price can reclaim the 05:00 open at 0.06979 or breaks below the intrahour low of 0.05770. These are levels to monitor, not entry signals. The top-rank label describes relative performance over the past 24 hours; when sharp declines and high turnover occur together, the ranking is especially not a reason to buy. #LobsterUSDT
Current conclusion: stay on the sidelines; don’t chase the price. Lobster USDT ($Lobster) still ranks No. 1 on the gainers list, but its short-term structure has shifted from acceleration to retracement. At 06:23:23 Beijing time, a full scan covered all 523/523 eligible USDT perpetual contracts. Lobster was up 41.132% over 24 hours, with a scan price of 0.0615900 and $185.9 million in quote volume. After this analysis was drafted, another full scan at 06:29:37 again covered all 523/523 contracts, with Lobster still at No. 1, up 43.267% over 24 hours, at a scan price of 0.0629800, and with $187.8 million in quote volume. Compared with the scan snapshot when this account posted at 05:06 (+70.064%, 0.0740800), the latest price snapshot is about 15.0% lower, while rolling volume rose from $121.7 million to $187.8 million. Differences between snapshots are not investment returns, and trading volume is not net buying. The 06:26 single-token ticker and the full-market scan are timestamped differently, so they should not be treated as the same closing price.
The clearest turning point appears in the complete hourly candle: from 05:00 to 05:59, it opened at 0.06979, peaked at 0.08230, and closed at 0.06555—down about 6.08% from the open and 20.35% below the hourly high. Quote volume for that hour was about $56.4 million. The 06:00 hourly candle had not closed as of 06:26 and had dipped as low as 0.05770 intrahour. For now, this can only be described as an ongoing retracement; the low cannot be treated as confirmed support.
Positioning data also contracted: Binance open interest in contracts fell from about 570.7 million at 05:00 to 539.0 million at 06:00, a decrease of 5.56%. The price pullback coincided with a decline in open interest, indicating a reduction in position size, but the data does not distinguish between longs and shorts, so it cannot establish liquidations or the direction of capital flows. The most recent settled funding rate, for 04:00, was still +0.092984% per 4 hours, meaning longs paid for that period. This is information about the cost of holding positions, not proof of the next move.
No contemporaneous, first-hand project catalyst was found in this review. Binance’s March 11 futures listing announcement only confirms that it is a BNB Chain Chinese-language meme coin; it is not new information today. Next, wait for the 06:00 hourly candle to fully close, then watch whether price can reclaim the 05:00 open at 0.06979 or breaks below the intrahour low of 0.05770. These are levels to monitor, not entry signals. The top-rank label describes relative performance over the past 24 hours; when sharp declines and high turnover occur together, the ranking is especially not a reason to buy. #LobsterUSDT
The clearest turning point appears in the complete hourly candle: from 05:00 to 05:59, it opened at 0.06979, peaked at 0.08230, and closed at 0.06555—down about 6.08% from the open and 20.35% below the hourly high. Quote volume for that hour was about $56.4 million. The 06:00 hourly candle had not closed as of 06:26 and had dipped as low as 0.05770 intrahour. For now, this can only be described as an ongoing retracement; the low cannot be treated as confirmed support.
Positioning data also contracted: Binance open interest in contracts fell from about 570.7 million at 05:00 to 539.0 million at 06:00, a decrease of 5.56%. The price pullback coincided with a decline in open interest, indicating a reduction in position size, but the data does not distinguish between longs and shorts, so it cannot establish liquidations or the direction of capital flows. The most recent settled funding rate, for 04:00, was still +0.092984% per 4 hours, meaning longs paid for that period. This is information about the cost of holding positions, not proof of the next move.
No contemporaneous, first-hand project catalyst was found in this review. Binance’s March 11 futures listing announcement only confirms that it is a BNB Chain Chinese-language meme coin; it is not new information today. Next, wait for the 06:00 hourly candle to fully close, then watch whether price can reclaim the 05:00 open at 0.06979 or breaks below the intrahour low of 0.05770. These are levels to monitor, not entry signals. The top-rank label describes relative performance over the past 24 hours; when sharp declines and high turnover occur together, the ranking is especially not a reason to buy. #LobsterUSDT
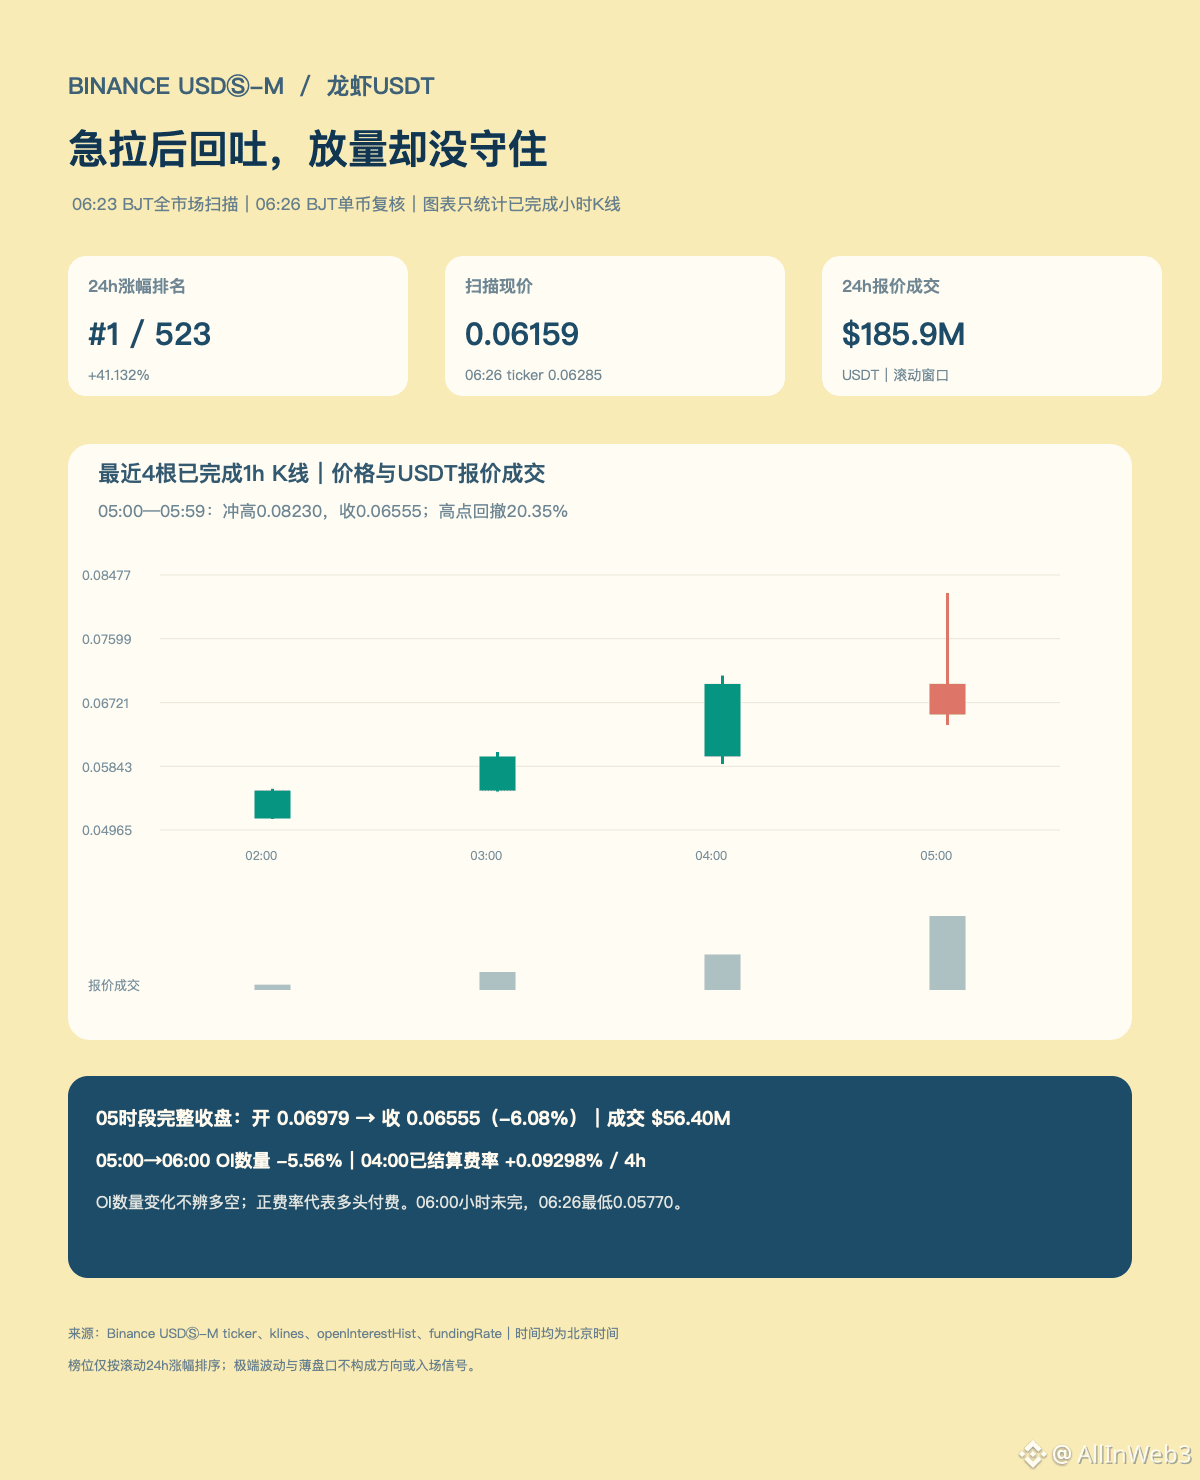
2
1k
·
--
Current assessment: wait and see; don’t chase the price. The 05:06 Beijing-time full Binance USDⓈ-M scan covered 523 eligible USDT perpetuals. LobsterUSDT ranked first in gains, up 70.064% over 24 hours, with a scan price of 0.0740800 and approximately $121.7 million in quote-volume turnover. Compared with this account’s October 6, 11:22 cooling-off watch (ranked fourth, +12.674%, at 0.04605), the market phase has changed. The roughly 61% price difference between the two snapshots is only a comparison across different times—not a rolling 24-hour return or a reproducible gain.
Over shorter periods, the completed 04:00–04:59 hour closed at 0.06977, up about 16.7% from 0.05979, with approximately $27.1 million in quote-volume turnover—close to twice that of the preceding 03:00–03:59 hour. The completed 00:00–04:00 four-hour period rose about 10.7%, with approximately $27.55 million in quote-volume turnover, slightly below the previous four-hour period. Price gains and trading volume did not rise in tandem. Neither timeframe can distinguish between aggressive buying, short covering, or two-sided turnover. The 04:00–08:00 four-hour candle is still incomplete, so its progress so far cannot be treated as a confirmed close.
Positioning and funding rates also point to crowding risk: the OI quantity in the 04:00–05:00 sample increased by about 1.02%, which does not indicate net inflows or long-side dominance. The 04:00 settled funding rate was +0.092984%/4 hours; a positive rate means longs pay shorts, not that the market is guaranteed to rise. The 05:02 single-contract ticker snapshot was about 3.4% away from the full-market scan quote from 32 seconds earlier, while a 05:05 rescan put the quote at 0.07548. These intraday snapshots should not be conflated with closing prices.
Compared with the earlier post at 11:22, which focused on cooling after a sharp rise, the new developments this time are renewed acceleration in the subsequently completed hourly candle, a return to the top spot in the full-market ranking, and a higher funding rate.
The Binance futures announcement found in this search was a historical listing notice dated March 11. No primary announcement synchronized with this sharp rise was found, so the old listing should not be treated as today’s catalyst. For now, watch only whether the next completed one-hour candle closes above the previous hour’s high of 0.07091. If it closes below the previous hour’s low of 0.05874, the current spike structure needs to be reassessed. The ranking indicates reporting order, not a buy signal. #LobsterUSDT
Current assessment: wait and see; don’t chase the price. The 05:06 Beijing-time full Binance USDⓈ-M scan covered 523 eligible USDT perpetuals. LobsterUSDT ranked first in gains, up 70.064% over 24 hours, with a scan price of 0.0740800 and approximately $121.7 million in quote-volume turnover. Compared with this account’s October 6, 11:22 cooling-off watch (ranked fourth, +12.674%, at 0.04605), the market phase has changed. The roughly 61% price difference between the two snapshots is only a comparison across different times—not a rolling 24-hour return or a reproducible gain.
Over shorter periods, the completed 04:00–04:59 hour closed at 0.06977, up about 16.7% from 0.05979, with approximately $27.1 million in quote-volume turnover—close to twice that of the preceding 03:00–03:59 hour. The completed 00:00–04:00 four-hour period rose about 10.7%, with approximately $27.55 million in quote-volume turnover, slightly below the previous four-hour period. Price gains and trading volume did not rise in tandem. Neither timeframe can distinguish between aggressive buying, short covering, or two-sided turnover. The 04:00–08:00 four-hour candle is still incomplete, so its progress so far cannot be treated as a confirmed close.
Positioning and funding rates also point to crowding risk: the OI quantity in the 04:00–05:00 sample increased by about 1.02%, which does not indicate net inflows or long-side dominance. The 04:00 settled funding rate was +0.092984%/4 hours; a positive rate means longs pay shorts, not that the market is guaranteed to rise. The 05:02 single-contract ticker snapshot was about 3.4% away from the full-market scan quote from 32 seconds earlier, while a 05:05 rescan put the quote at 0.07548. These intraday snapshots should not be conflated with closing prices.
Compared with the earlier post at 11:22, which focused on cooling after a sharp rise, the new developments this time are renewed acceleration in the subsequently completed hourly candle, a return to the top spot in the full-market ranking, and a higher funding rate.
The Binance futures announcement found in this search was a historical listing notice dated March 11. No primary announcement synchronized with this sharp rise was found, so the old listing should not be treated as today’s catalyst. For now, watch only whether the next completed one-hour candle closes above the previous hour’s high of 0.07091. If it closes below the previous hour’s low of 0.05874, the current spike structure needs to be reassessed. The ranking indicates reporting order, not a buy signal. #LobsterUSDT
Over shorter periods, the completed 04:00–04:59 hour closed at 0.06977, up about 16.7% from 0.05979, with approximately $27.1 million in quote-volume turnover—close to twice that of the preceding 03:00–03:59 hour. The completed 00:00–04:00 four-hour period rose about 10.7%, with approximately $27.55 million in quote-volume turnover, slightly below the previous four-hour period. Price gains and trading volume did not rise in tandem. Neither timeframe can distinguish between aggressive buying, short covering, or two-sided turnover. The 04:00–08:00 four-hour candle is still incomplete, so its progress so far cannot be treated as a confirmed close.
Positioning and funding rates also point to crowding risk: the OI quantity in the 04:00–05:00 sample increased by about 1.02%, which does not indicate net inflows or long-side dominance. The 04:00 settled funding rate was +0.092984%/4 hours; a positive rate means longs pay shorts, not that the market is guaranteed to rise. The 05:02 single-contract ticker snapshot was about 3.4% away from the full-market scan quote from 32 seconds earlier, while a 05:05 rescan put the quote at 0.07548. These intraday snapshots should not be conflated with closing prices.
Compared with the earlier post at 11:22, which focused on cooling after a sharp rise, the new developments this time are renewed acceleration in the subsequently completed hourly candle, a return to the top spot in the full-market ranking, and a higher funding rate.
The Binance futures announcement found in this search was a historical listing notice dated March 11. No primary announcement synchronized with this sharp rise was found, so the old listing should not be treated as today’s catalyst. For now, watch only whether the next completed one-hour candle closes above the previous hour’s high of 0.07091. If it closes below the previous hour’s low of 0.05874, the current spike structure needs to be reassessed. The ranking indicates reporting order, not a buy signal. #LobsterUSDT
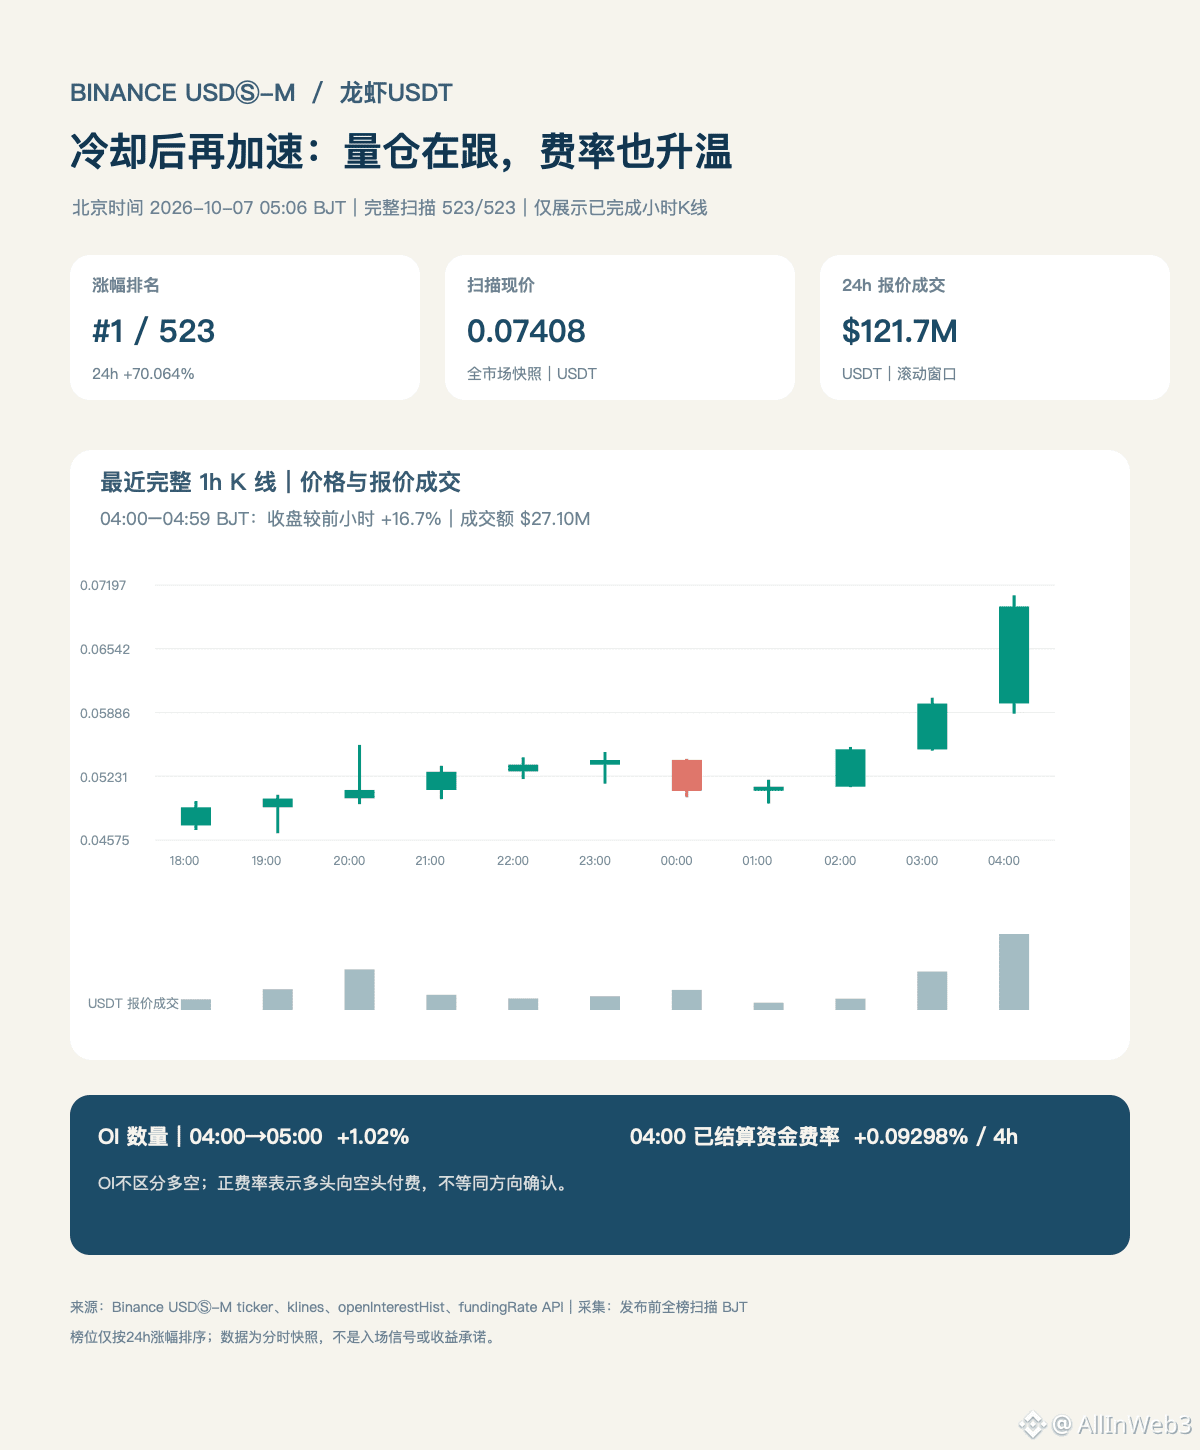
1
4
·
--
Current view on $US: wait and see; don’t chase the rally. In a full Binance USDⓈ-M USDT perpetual scan at 04:01 Beijing time, $US (Talus Network) ranked first in gains at +40.355%; a rescan at 04:09:18 still ranked it third, up +39.932%, with a price of 0.014371 and approximately $118.7 million in 24-hour volume. Its ranking slipped within minutes, showing how quickly market momentum rankings can change. The key point is that the rebound came after the previous structure had already broken down.
On October 2, Post A from this account, 372963204875391, marked 0.025801 as the lower bound to watch in the pullback range. At 04:09, the price was about 0.014371, roughly 44.3% below that level. Although it rebounded nearly 40% over the rolling 24 hours, it still had not returned to the previously observed range. Compared with the earlier post, what’s new isn’t simply that “it went up again”; rather, a fresh rapid rebound followed a break below the previous low. This looks more like a recovery after a steep decline and cannot be called a trend reversal outright.
Intraday volume and price action are also cooling. Over the four hours from 16:00 to 20:00, the closing price rose about 16.9%, with approximately $40.81 million in trading volume. From 20:00 to 00:00, the gain narrowed to about 3.4%, with volume of approximately $25.95 million. From 00:00 to 04:00, it closed at 0.014381, down 0.69% from the previous close, with volume of approximately $19.98 million. The 03:00–04:00 hourly candle closed down 1.80%, while volume rose from $3.12 million in the previous hour to $4.86 million. This indicates more active trading during the decline, but volume alone is not enough to conclude that sellers had the upper hand.
OI increased from 739.1 million to 752.7 million US between 00:00 and 04:00 (+1.84%); the 04:00 funding rate was +0.00562%. Positions expanded only slightly, and the rate was mildly positive; neither proves net inflows or a short squeeze.
Bithumb announced a US/KRW listing plan on October 2, with trading scheduled to open at 15:00 KST, about five days ago. I couldn’t find a project announcement timed with this rally around 04:00, so the earlier listing should not be treated as today’s catalyst. Current view: wait and see; don’t chase the rally. Only a full hourly candle’s price and volume reclaiming 0.014921 would confirm that the rebound is continuing. A break below 0.014113, the four-hour low, would invalidate the current rebound structure. No participation until confirmation; these are conditions to watch, not price targets. #US
Current view on $US : wait and see; don’t chase the rally. In a full Binance USDⓈ-M USDT perpetual scan at 04:01 Beijing time, $US (Talus Network) ranked first in gains at +40.355%; a rescan at 04:09:18 still ranked it third, up +39.932%, with a price of 0.014371 and approximately $118.7 million in 24-hour volume. Its ranking slipped within minutes, showing how quickly market momentum rankings can change. The key point is that the rebound came after the previous structure had already broken down.
On October 2, Post A from this account, 372963204875391, marked 0.025801 as the lower bound to watch in the pullback range. At 04:09, the price was about 0.014371, roughly 44.3% below that level. Although it rebounded nearly 40% over the rolling 24 hours, it still had not returned to the previously observed range. Compared with the earlier post, what’s new isn’t simply that “it went up again”; rather, a fresh rapid rebound followed a break below the previous low. This looks more like a recovery after a steep decline and cannot be called a trend reversal outright.
Intraday volume and price action are also cooling. Over the four hours from 16:00 to 20:00, the closing price rose about 16.9%, with approximately $40.81 million in trading volume. From 20:00 to 00:00, the gain narrowed to about 3.4%, with volume of approximately $25.95 million. From 00:00 to 04:00, it closed at 0.014381, down 0.69% from the previous close, with volume of approximately $19.98 million. The 03:00–04:00 hourly candle closed down 1.80%, while volume rose from $3.12 million in the previous hour to $4.86 million. This indicates more active trading during the decline, but volume alone is not enough to conclude that sellers had the upper hand.
OI increased from 739.1 million to 752.7 million US between 00:00 and 04:00 (+1.84%); the 04:00 funding rate was +0.00562%. Positions expanded only slightly, and the rate was mildly positive; neither proves net inflows or a short squeeze.
Bithumb announced a US/KRW listing plan on October 2, with trading scheduled to open at 15:00 KST, about five days ago. I couldn’t find a project announcement timed with this rally around 04:00, so the earlier listing should not be treated as today’s catalyst. Current view: wait and see; don’t chase the rally. Only a full hourly candle’s price and volume reclaiming 0.014921 would confirm that the rebound is continuing. A break below 0.014113, the four-hour low, would invalidate the current rebound structure. No participation until confirmation; these are conditions to watch, not price targets. #US
On October 2, Post A from this account, 372963204875391, marked 0.025801 as the lower bound to watch in the pullback range. At 04:09, the price was about 0.014371, roughly 44.3% below that level. Although it rebounded nearly 40% over the rolling 24 hours, it still had not returned to the previously observed range. Compared with the earlier post, what’s new isn’t simply that “it went up again”; rather, a fresh rapid rebound followed a break below the previous low. This looks more like a recovery after a steep decline and cannot be called a trend reversal outright.
Intraday volume and price action are also cooling. Over the four hours from 16:00 to 20:00, the closing price rose about 16.9%, with approximately $40.81 million in trading volume. From 20:00 to 00:00, the gain narrowed to about 3.4%, with volume of approximately $25.95 million. From 00:00 to 04:00, it closed at 0.014381, down 0.69% from the previous close, with volume of approximately $19.98 million. The 03:00–04:00 hourly candle closed down 1.80%, while volume rose from $3.12 million in the previous hour to $4.86 million. This indicates more active trading during the decline, but volume alone is not enough to conclude that sellers had the upper hand.
OI increased from 739.1 million to 752.7 million US between 00:00 and 04:00 (+1.84%); the 04:00 funding rate was +0.00562%. Positions expanded only slightly, and the rate was mildly positive; neither proves net inflows or a short squeeze.
Bithumb announced a US/KRW listing plan on October 2, with trading scheduled to open at 15:00 KST, about five days ago. I couldn’t find a project announcement timed with this rally around 04:00, so the earlier listing should not be treated as today’s catalyst. Current view: wait and see; don’t chase the rally. Only a full hourly candle’s price and volume reclaiming 0.014921 would confirm that the rebound is continuing. A break below 0.014113, the four-hour low, would invalidate the current rebound structure. No participation until confirmation; these are conditions to watch, not price targets. #US
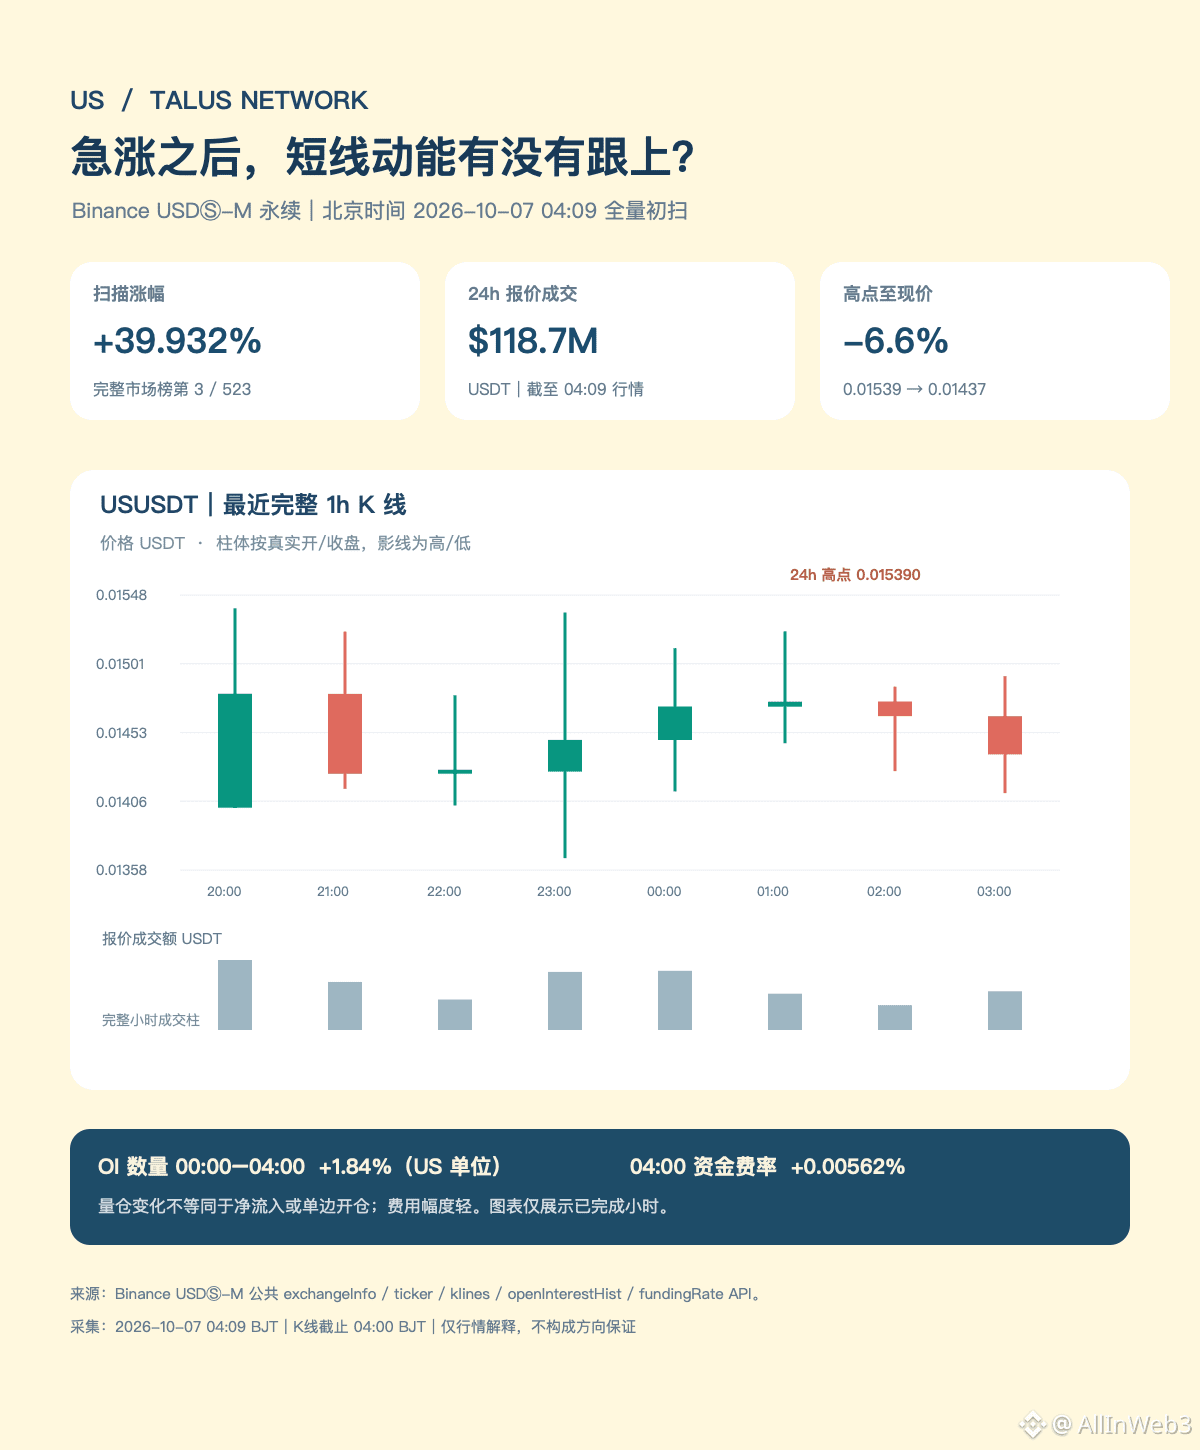
182
·
--
【$BR | Reclaimed at the hourly close, then lost again; rank returns to No. 2】
For now, stay on the sidelines. The full Binance USDT-margined perpetual scan at 01:01 Beijing time covered 523/523 pairs, with BRUSDT ranked No. 1 and up 54.202% over 24 hours; this is a news ranking, not a bullish call. In the scan at 01:09:34 before publication, BR was still No. 1; however, the complete scan at 01:15:20 showed RLC rising to No. 1 (+45.558%), with BR slipping to No. 2 (+44.673%) at a scanned price of 0.57982. The observations below are described according to their respective collection times.
Compared with this account’s just-published BR post (ID 374422331166021), the new information is the completed 00:00–01:00 hourly candle: it closed at 0.63825, about 3.87% above the previous 23:00–00:00 close of 0.61449; the hour’s high was 0.64887 and low was 0.58876. The question raised in the previous post—“Can it hold 0.61449 over the next hour?”—has a preliminary answer: this completed hourly candle did close above the reference level.
But by 01:15:20, the price in Binance’s full scan had returned to 0.57982, about 5.64% below 0.61449 and about 9.15% below the most recent completed hourly close. So the more accurate description is that the reference level was reclaimed at the completed hourly close, then lost again; this does not confirm stable support. The 01:00–02:00 hourly candle is still forming, so an intrahour price should not be treated as its closing price. The next thing to watch is where that candle ultimately closes relative to 0.61449, rather than declaring a reversal prematurely.
Volume and price data also do not support a one-sided interpretation: turnover during 00:00–01:00 was about $28.498 million, around 25.9% lower than the previous hour’s $38.475 million; open-interest contract count fell from 24,725,632 in the 01:00 sample to 24,092,360 in the live interface around 01:07, a decline of about 2.56%. Turnover is the total value of both sides of trades, while OI is the number of outstanding contracts; neither can establish net buying, net inflows, or which side was more aggressive. Turnover in the still-forming 01:00–02:00 candle also cannot be directly compared with that of a completed hour.
The new information this time is not another gain figure, but that “the hourly candle first reclaimed the level at the close, then the price fell back below it.” This is a reminder to distinguish a single close from sustained support. This round of research found no primary-source evidence that a simultaneous project announcement triggered this price-and-volume move. Going forward, we will check only the next completed hourly close and changes in turnover and OI; an unfinished candle should not be treated as confirmation. This is a market record as of 01:15:20, not an entry recommendation, price target, or promise of returns.
【$BR | Reclaimed at the hourly close, then lost again; rank returns to No. 2】
For now, stay on the sidelines. The full Binance USDT-margined perpetual scan at 01:01 Beijing time covered 523/523 pairs, with BRUSDT ranked No. 1 and up 54.202% over 24 hours; this is a news ranking, not a bullish call. In the scan at 01:09:34 before publication, BR was still No. 1; however, the complete scan at 01:15:20 showed RLC rising to No. 1 (+45.558%), with BR slipping to No. 2 (+44.673%) at a scanned price of 0.57982. The observations below are described according to their respective collection times.
Compared with this account’s just-published BR post (ID 374422331166021), the new information is the completed 00:00–01:00 hourly candle: it closed at 0.63825, about 3.87% above the previous 23:00–00:00 close of 0.61449; the hour’s high was 0.64887 and low was 0.58876. The question raised in the previous post—“Can it hold 0.61449 over the next hour?”—has a preliminary answer: this completed hourly candle did close above the reference level.
But by 01:15:20, the price in Binance’s full scan had returned to 0.57982, about 5.64% below 0.61449 and about 9.15% below the most recent completed hourly close. So the more accurate description is that the reference level was reclaimed at the completed hourly close, then lost again; this does not confirm stable support. The 01:00–02:00 hourly candle is still forming, so an intrahour price should not be treated as its closing price. The next thing to watch is where that candle ultimately closes relative to 0.61449, rather than declaring a reversal prematurely.
Volume and price data also do not support a one-sided interpretation: turnover during 00:00–01:00 was about $28.498 million, around 25.9% lower than the previous hour’s $38.475 million; open-interest contract count fell from 24,725,632 in the 01:00 sample to 24,092,360 in the live interface around 01:07, a decline of about 2.56%. Turnover is the total value of both sides of trades, while OI is the number of outstanding contracts; neither can establish net buying, net inflows, or which side was more aggressive. Turnover in the still-forming 01:00–02:00 candle also cannot be directly compared with that of a completed hour.
The new information this time is not another gain figure, but that “the hourly candle first reclaimed the level at the close, then the price fell back below it.” This is a reminder to distinguish a single close from sustained support. This round of research found no primary-source evidence that a simultaneous project announcement triggered this price-and-volume move. Going forward, we will check only the next completed hourly close and changes in turnover and OI; an unfinished candle should not be treated as confirmation. This is a market record as of 01:15:20, not an entry recommendation, price target, or promise of returns.
For now, stay on the sidelines. The full Binance USDT-margined perpetual scan at 01:01 Beijing time covered 523/523 pairs, with BRUSDT ranked No. 1 and up 54.202% over 24 hours; this is a news ranking, not a bullish call. In the scan at 01:09:34 before publication, BR was still No. 1; however, the complete scan at 01:15:20 showed RLC rising to No. 1 (+45.558%), with BR slipping to No. 2 (+44.673%) at a scanned price of 0.57982. The observations below are described according to their respective collection times.
Compared with this account’s just-published BR post (ID 374422331166021), the new information is the completed 00:00–01:00 hourly candle: it closed at 0.63825, about 3.87% above the previous 23:00–00:00 close of 0.61449; the hour’s high was 0.64887 and low was 0.58876. The question raised in the previous post—“Can it hold 0.61449 over the next hour?”—has a preliminary answer: this completed hourly candle did close above the reference level.
But by 01:15:20, the price in Binance’s full scan had returned to 0.57982, about 5.64% below 0.61449 and about 9.15% below the most recent completed hourly close. So the more accurate description is that the reference level was reclaimed at the completed hourly close, then lost again; this does not confirm stable support. The 01:00–02:00 hourly candle is still forming, so an intrahour price should not be treated as its closing price. The next thing to watch is where that candle ultimately closes relative to 0.61449, rather than declaring a reversal prematurely.
Volume and price data also do not support a one-sided interpretation: turnover during 00:00–01:00 was about $28.498 million, around 25.9% lower than the previous hour’s $38.475 million; open-interest contract count fell from 24,725,632 in the 01:00 sample to 24,092,360 in the live interface around 01:07, a decline of about 2.56%. Turnover is the total value of both sides of trades, while OI is the number of outstanding contracts; neither can establish net buying, net inflows, or which side was more aggressive. Turnover in the still-forming 01:00–02:00 candle also cannot be directly compared with that of a completed hour.
The new information this time is not another gain figure, but that “the hourly candle first reclaimed the level at the close, then the price fell back below it.” This is a reminder to distinguish a single close from sustained support. This round of research found no primary-source evidence that a simultaneous project announcement triggered this price-and-volume move. Going forward, we will check only the next completed hourly close and changes in turnover and OI; an unfinished candle should not be treated as confirmation. This is a market record as of 01:15:20, not an entry recommendation, price target, or promise of returns.
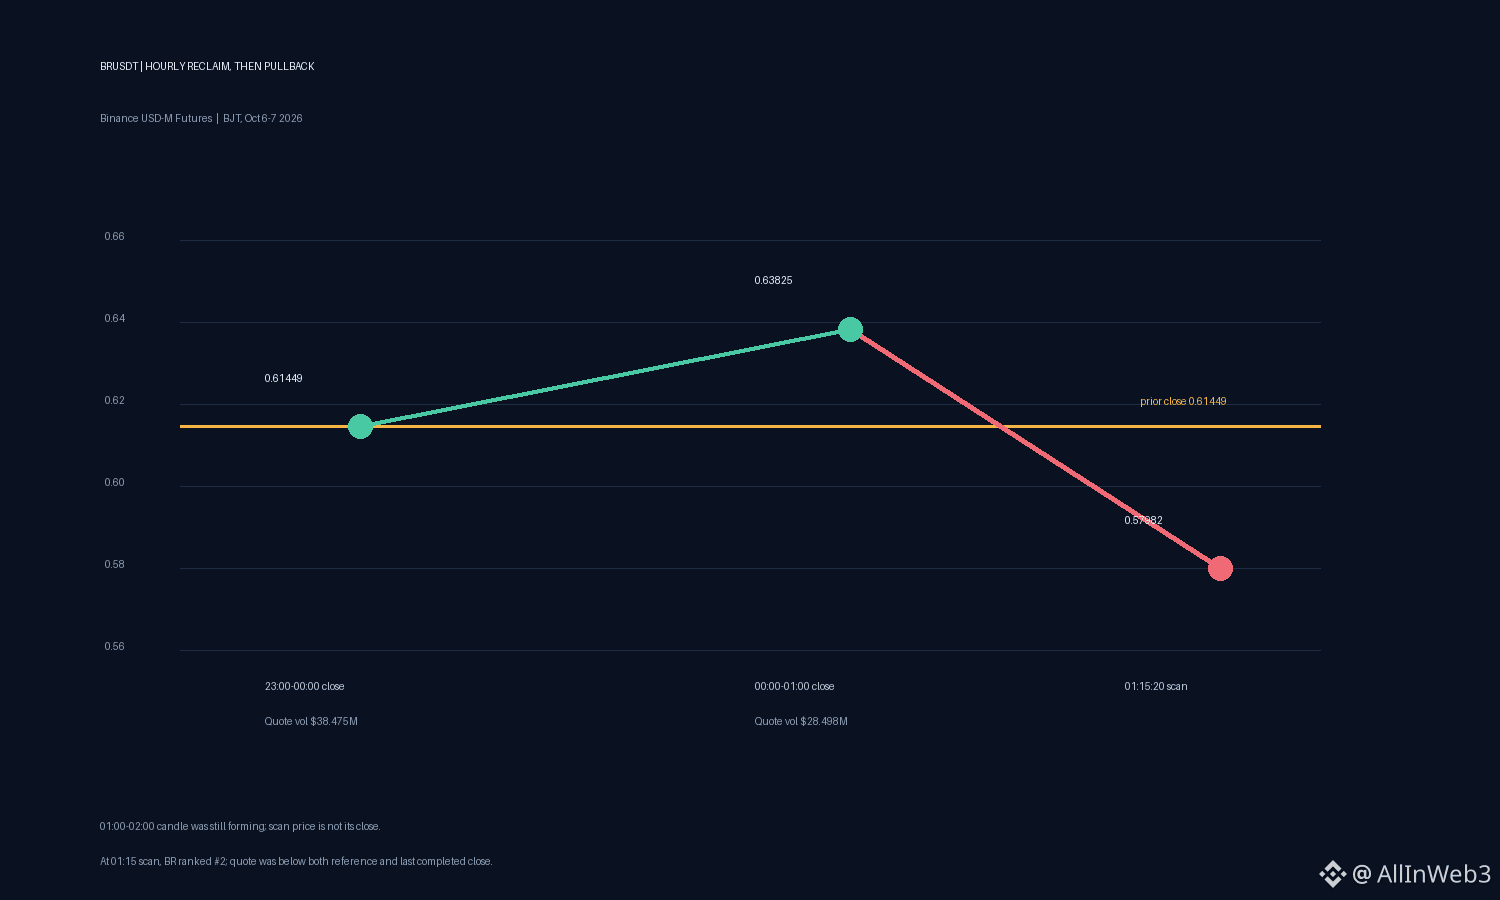
261
·
--
#BR short-term wait-and-see: $BR after the latest hourly rebound closed, the 00:05 scan price has already fallen back below the close; the next full hour is needed for confirmation.
At 00:00:25 Beijing time, Binance perpetual USD-M scan coverage included 523/523 USDT-margined COIN perpetual contracts within the relevant range. BRUSDT ranked first in gains, with a rolling 24-hour increase of +59.076% and a scan price of 0.6172, with quote turnover of about USD 400 million. By 00:05:27, BR still ranked first, but the gain had eased to +54.382%, and the scan price had returned to 0.60093. The top spot did not change, but within a short time the price had already pulled back about 2.6% from the scan point, so the ranking cannot be read as sustained acceleration.
What has been updated compared with the previous article is a newly completed hourly candle: 23:00—00:00 opened at 0.56774 and closed at 0.61449, about 8.23% higher than the 22:00—23:00 close of 0.56772; quote turnover in that hour was about USD 38.47 million, versus about USD 30.81 million in the previous hour, an increase of about 24.9%. This shows a rebound and higher total turnover during the hourly close, but turnover is not the same as net buying. By 00:05, the scan price had fallen about 2.2% below 0.61449; the 00:00—01:00 hour had not yet finished, so it cannot yet be written as a confirmed breakdown. The intraday high of 0.677 has also not been reclaimed.
The open interest sample increased from 23.466 million BR at 23:00 to 24.165 million at 00:00, up about 2.98%. OI includes both long and short positions, so it cannot show which side the newly added positions are on, nor can it be used to judge a short squeeze or liquidations. The next step is to see whether the full hour can reclaim 0.61449, whether turnover continues, and whether OI keeps changing; before that, the judgment is limited to “a rebound hour closed higher, followed by a pullback in the scan price.”
The Bedrock DAO governance homepage currently shows that voting is scheduled to begin at 09:00 on October 8 (Beijing time), but the page does not state the specific proposal on the homepage; this can only be treated as a recent governance time point and cannot be taken as the cause of this round of volatility. Binance’s 2025 futures announcements and Bedrock documentation map BR to Bedrock, and Binance futures trading does not mean spot listing. No synchronized new announcement has been verified that could explain this round of sharp price movement, so the price change and the governance schedule should not be forced into a causal relationship.
#BR short-term wait-and-see: $BR after the latest hourly rebound closed, the 00:05 scan price has already fallen back below the close; the next full hour is needed for confirmation.
At 00:00:25 Beijing time, Binance perpetual USD-M scan coverage included 523/523 USDT-margined COIN perpetual contracts within the relevant range. BRUSDT ranked first in gains, with a rolling 24-hour increase of +59.076% and a scan price of 0.6172, with quote turnover of about USD 400 million. By 00:05:27, BR still ranked first, but the gain had eased to +54.382%, and the scan price had returned to 0.60093. The top spot did not change, but within a short time the price had already pulled back about 2.6% from the scan point, so the ranking cannot be read as sustained acceleration.
What has been updated compared with the previous article is a newly completed hourly candle: 23:00—00:00 opened at 0.56774 and closed at 0.61449, about 8.23% higher than the 22:00—23:00 close of 0.56772; quote turnover in that hour was about USD 38.47 million, versus about USD 30.81 million in the previous hour, an increase of about 24.9%. This shows a rebound and higher total turnover during the hourly close, but turnover is not the same as net buying. By 00:05, the scan price had fallen about 2.2% below 0.61449; the 00:00—01:00 hour had not yet finished, so it cannot yet be written as a confirmed breakdown. The intraday high of 0.677 has also not been reclaimed.
The open interest sample increased from 23.466 million BR at 23:00 to 24.165 million at 00:00, up about 2.98%. OI includes both long and short positions, so it cannot show which side the newly added positions are on, nor can it be used to judge a short squeeze or liquidations. The next step is to see whether the full hour can reclaim 0.61449, whether turnover continues, and whether OI keeps changing; before that, the judgment is limited to “a rebound hour closed higher, followed by a pullback in the scan price.”
The Bedrock DAO governance homepage currently shows that voting is scheduled to begin at 09:00 on October 8 (Beijing time), but the page does not state the specific proposal on the homepage; this can only be treated as a recent governance time point and cannot be taken as the cause of this round of volatility. Binance’s 2025 futures announcements and Bedrock documentation map BR to Bedrock, and Binance futures trading does not mean spot listing. No synchronized new announcement has been verified that could explain this round of sharp price movement, so the price change and the governance schedule should not be forced into a causal relationship.
At 00:00:25 Beijing time, Binance perpetual USD-M scan coverage included 523/523 USDT-margined COIN perpetual contracts within the relevant range. BRUSDT ranked first in gains, with a rolling 24-hour increase of +59.076% and a scan price of 0.6172, with quote turnover of about USD 400 million. By 00:05:27, BR still ranked first, but the gain had eased to +54.382%, and the scan price had returned to 0.60093. The top spot did not change, but within a short time the price had already pulled back about 2.6% from the scan point, so the ranking cannot be read as sustained acceleration.
What has been updated compared with the previous article is a newly completed hourly candle: 23:00—00:00 opened at 0.56774 and closed at 0.61449, about 8.23% higher than the 22:00—23:00 close of 0.56772; quote turnover in that hour was about USD 38.47 million, versus about USD 30.81 million in the previous hour, an increase of about 24.9%. This shows a rebound and higher total turnover during the hourly close, but turnover is not the same as net buying. By 00:05, the scan price had fallen about 2.2% below 0.61449; the 00:00—01:00 hour had not yet finished, so it cannot yet be written as a confirmed breakdown. The intraday high of 0.677 has also not been reclaimed.
The open interest sample increased from 23.466 million BR at 23:00 to 24.165 million at 00:00, up about 2.98%. OI includes both long and short positions, so it cannot show which side the newly added positions are on, nor can it be used to judge a short squeeze or liquidations. The next step is to see whether the full hour can reclaim 0.61449, whether turnover continues, and whether OI keeps changing; before that, the judgment is limited to “a rebound hour closed higher, followed by a pullback in the scan price.”
The Bedrock DAO governance homepage currently shows that voting is scheduled to begin at 09:00 on October 8 (Beijing time), but the page does not state the specific proposal on the homepage; this can only be treated as a recent governance time point and cannot be taken as the cause of this round of volatility. Binance’s 2025 futures announcements and Bedrock documentation map BR to Bedrock, and Binance futures trading does not mean spot listing. No synchronized new announcement has been verified that could explain this round of sharp price movement, so the price change and the governance schedule should not be forced into a causal relationship.
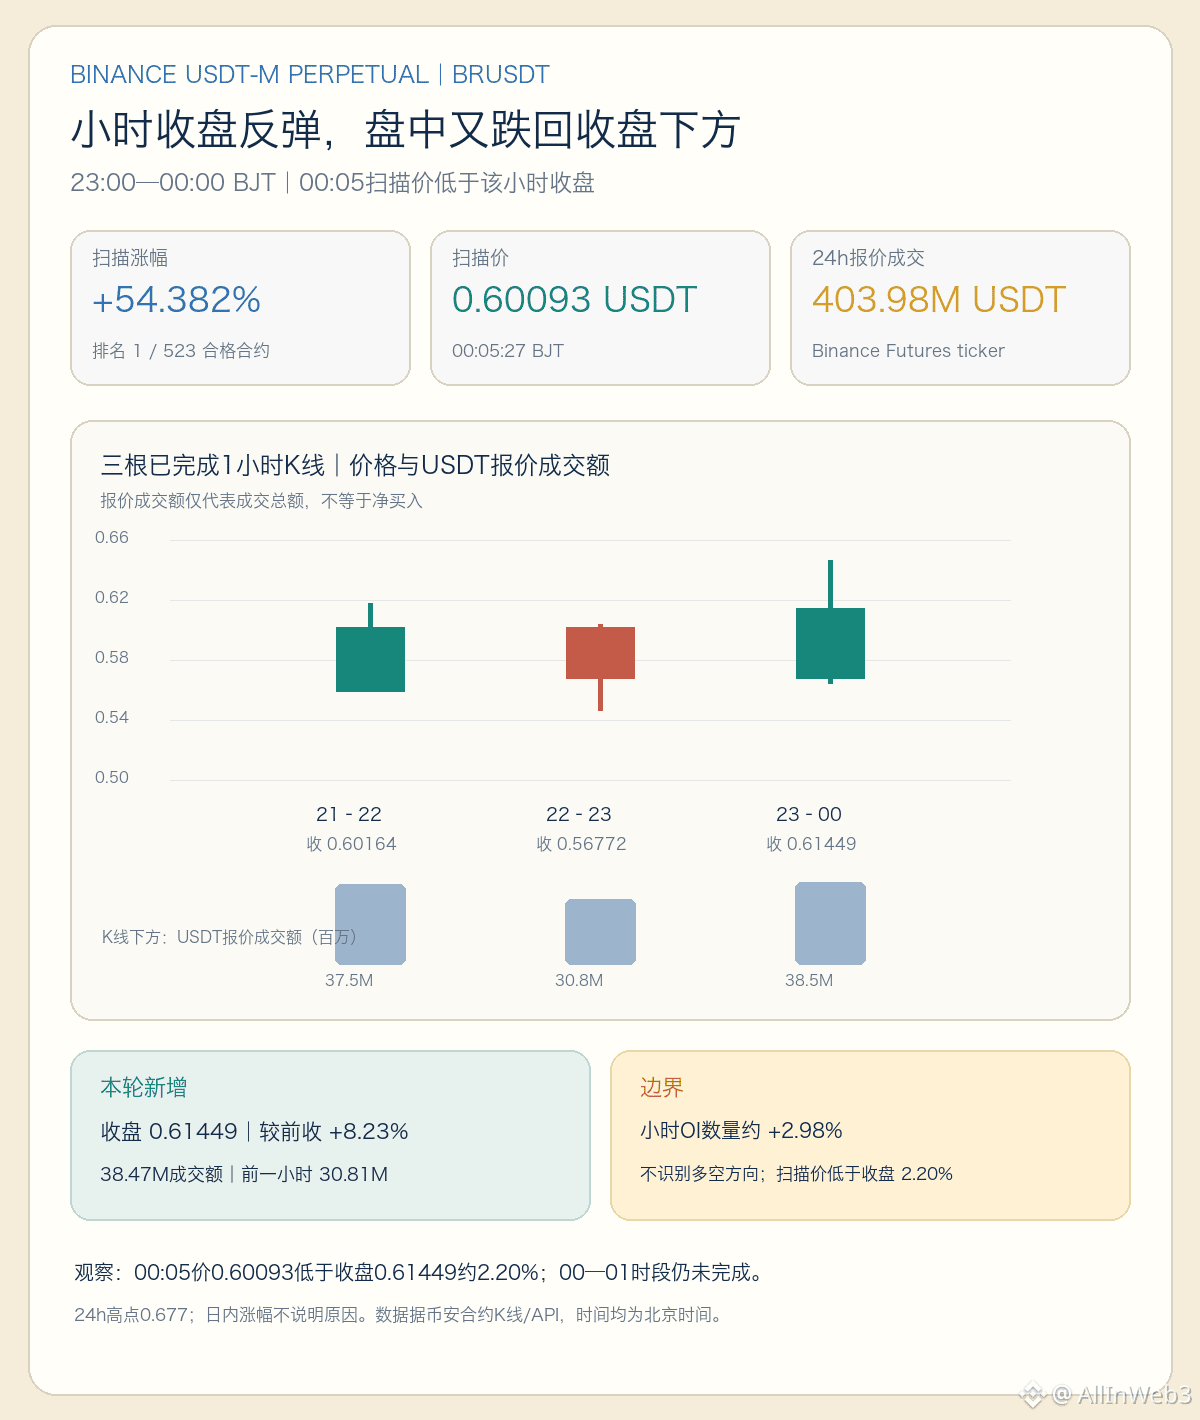
267
·
--
【$BR | The hourly candle closed lower, turning an intraday pullback into a confirmed closing move】
Compared with our 22:24 post, the new information is not another intraday dip, but that the 22:00–23:00 hourly candle has now closed. Binance Futures data shows it closed at 0.56772 USDT, 5.64% below the previous hour’s close of 0.60164. USDT-quoted trading volume this hour was about $30.81 million, down 17.85% from about $37.50 million in the previous hour. As of 23:11, the price was around 0.5707 near the mark price, slightly above the hourly close but still below 0.60164.
What does this change? Until now, the pullback could still have been erased by an intraday rebound; we can now at least confirm that this hour failed to hold above the previous close. Trading volume also declined, indicating lower activity in this window than in the previous hour, but this alone cannot prove that selling pressure increased or buyers pulled back. A more reliable focus is whether a subsequent full hourly candle can reclaim 0.60164, and whether trading volume recovers along with any rebound.
The same hour’s open-interest quantity sample fell from 24,468,369 BR at 22:00 to 23,466,125 at 23:00, a decrease of about 4.10%. This is a change in the number of open contracts; it does not tell us which side—longs or shorts—reduced positions, much less justify calling it a long liquidation. The funding rate settled at 20:00 was -0.186489%. That is a historical figure for that settlement, not a forecast for the next one, and it is not enough to prove that a short squeeze is underway.
The 20:00–24:00 four-hour window had not closed as of 23:11, so I’m not using an unfinished four-hour candle to reinforce the assessment. The rolling 24-hour gain in that scan was +53.668%, so this one hourly candle closing lower does not by itself amount to a trend reversal. The earlier high of 0.677 is also just a range datapoint, not a price target. I haven’t found any new, concurrent project catalyst that adequately explains this move. Next, I’ll watch whether a full hourly candle can reclaim 0.60164, whether trading volume returns to the previous hour’s level, and whether open interest continues to change. Until those signals appear, all we can say is that the short-term recovery has stalled; the direction remains unconfirmed.
【$BR | The hourly candle closed lower, turning an intraday pullback into a confirmed closing move】
Compared with our 22:24 post, the new information is not another intraday dip, but that the 22:00–23:00 hourly candle has now closed. Binance Futures data shows it closed at 0.56772 USDT, 5.64% below the previous hour’s close of 0.60164. USDT-quoted trading volume this hour was about $30.81 million, down 17.85% from about $37.50 million in the previous hour. As of 23:11, the price was around 0.5707 near the mark price, slightly above the hourly close but still below 0.60164.
What does this change? Until now, the pullback could still have been erased by an intraday rebound; we can now at least confirm that this hour failed to hold above the previous close. Trading volume also declined, indicating lower activity in this window than in the previous hour, but this alone cannot prove that selling pressure increased or buyers pulled back. A more reliable focus is whether a subsequent full hourly candle can reclaim 0.60164, and whether trading volume recovers along with any rebound.
The same hour’s open-interest quantity sample fell from 24,468,369 BR at 22:00 to 23,466,125 at 23:00, a decrease of about 4.10%. This is a change in the number of open contracts; it does not tell us which side—longs or shorts—reduced positions, much less justify calling it a long liquidation. The funding rate settled at 20:00 was -0.186489%. That is a historical figure for that settlement, not a forecast for the next one, and it is not enough to prove that a short squeeze is underway.
The 20:00–24:00 four-hour window had not closed as of 23:11, so I’m not using an unfinished four-hour candle to reinforce the assessment. The rolling 24-hour gain in that scan was +53.668%, so this one hourly candle closing lower does not by itself amount to a trend reversal. The earlier high of 0.677 is also just a range datapoint, not a price target. I haven’t found any new, concurrent project catalyst that adequately explains this move. Next, I’ll watch whether a full hourly candle can reclaim 0.60164, whether trading volume returns to the previous hour’s level, and whether open interest continues to change. Until those signals appear, all we can say is that the short-term recovery has stalled; the direction remains unconfirmed.
Compared with our 22:24 post, the new information is not another intraday dip, but that the 22:00–23:00 hourly candle has now closed. Binance Futures data shows it closed at 0.56772 USDT, 5.64% below the previous hour’s close of 0.60164. USDT-quoted trading volume this hour was about $30.81 million, down 17.85% from about $37.50 million in the previous hour. As of 23:11, the price was around 0.5707 near the mark price, slightly above the hourly close but still below 0.60164.
What does this change? Until now, the pullback could still have been erased by an intraday rebound; we can now at least confirm that this hour failed to hold above the previous close. Trading volume also declined, indicating lower activity in this window than in the previous hour, but this alone cannot prove that selling pressure increased or buyers pulled back. A more reliable focus is whether a subsequent full hourly candle can reclaim 0.60164, and whether trading volume recovers along with any rebound.
The same hour’s open-interest quantity sample fell from 24,468,369 BR at 22:00 to 23,466,125 at 23:00, a decrease of about 4.10%. This is a change in the number of open contracts; it does not tell us which side—longs or shorts—reduced positions, much less justify calling it a long liquidation. The funding rate settled at 20:00 was -0.186489%. That is a historical figure for that settlement, not a forecast for the next one, and it is not enough to prove that a short squeeze is underway.
The 20:00–24:00 four-hour window had not closed as of 23:11, so I’m not using an unfinished four-hour candle to reinforce the assessment. The rolling 24-hour gain in that scan was +53.668%, so this one hourly candle closing lower does not by itself amount to a trend reversal. The earlier high of 0.677 is also just a range datapoint, not a price target. I haven’t found any new, concurrent project catalyst that adequately explains this move. Next, I’ll watch whether a full hourly candle can reclaim 0.60164, whether trading volume returns to the previous hour’s level, and whether open interest continues to change. Until those signals appear, all we can say is that the short-term recovery has stalled; the direction remains unconfirmed.
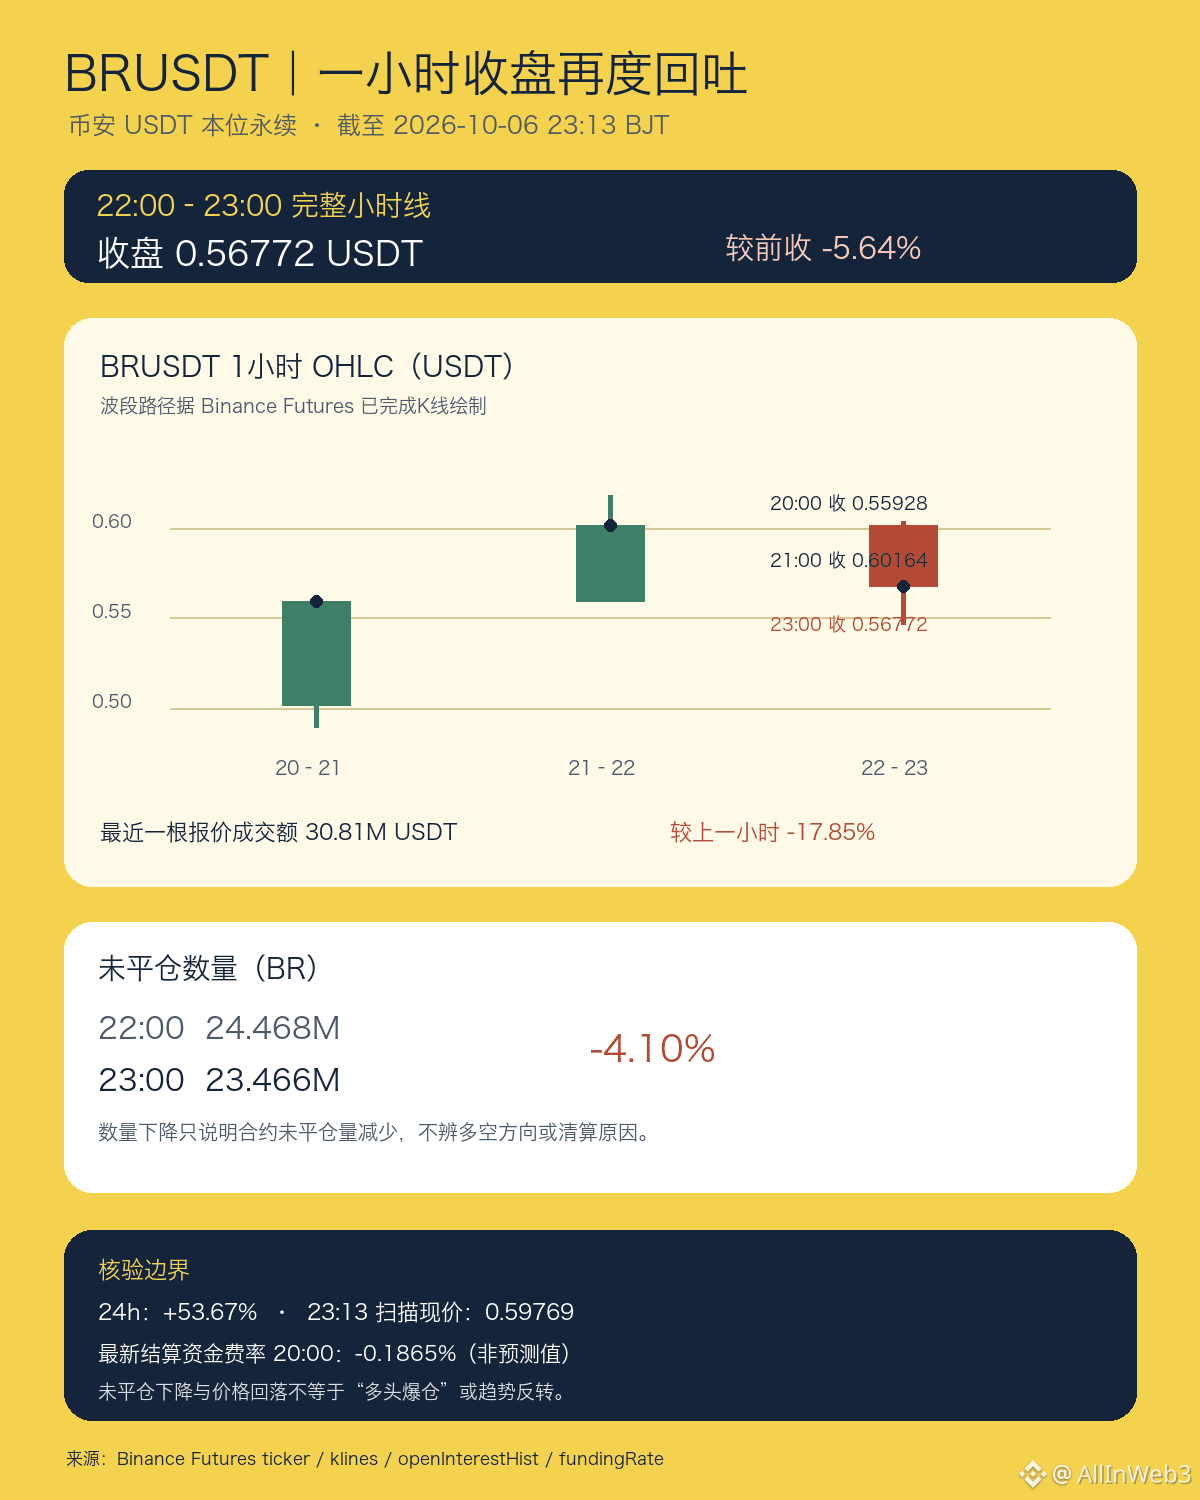
164
·
--
【Trending #6 | ETH exit-status snapshot shows a slight uptick】
The trending list still says “the exit queue has hit a 2026 high,” but these latest data can answer only a narrower question: how records for validators in the active_exiting state changed over roughly the past 56 minutes.
At 21:43 Beijing time, Lodestar’s public Beacon API finalized-state listing showed 22,189 active_exiting validators, with a combined balance of 840,577.283 ETH. At 22:39, a finalized query of the same type from PublicNode showed 22,213 validators and 841,345.103 ETH—24 more validators and 767.819 ETH more, increases of approximately 0.11% and 0.09%, respectively. This is a new snapshot following this account’s 21:47 post 374387827046502. The direction over this short window differs from the decline over the longer period observed earlier, but the samples come from different providers and cover only two points in time. They therefore do not establish that exit demand has reversed, and the balance change should not be treated as net inflows or selling.
active_exiting means a validator has entered the protocol’s exit processing. The balance here is only the sum of the balance fields in records in that state; it does not mean the ETH has been received. Ethereum’s official process also requires the exit to be completed and the validator to become withdrawable, followed by a wait for the withdrawal sweep. This update did not track withdrawable balances, recipient addresses, or inflows to exchanges. The next step is to observe subsequent finalized snapshots from the same provider and distinguish state transitions from actual withdrawals. Samples from these two different points also cannot substantiate the trending list’s claim of a “year-to-date high.” Assessing whether exit pressure is easing would require a longer time series, queue counts measured on a consistent basis, and changes in withdrawable balances. The small uptick in a single snapshot also does not support extrapolating future supply.
Data: Ethereum Beacon API, finalized; as of 22:39 Beijing time.
【Trending #6 | ETH exit-status snapshot shows a slight uptick】
The trending list still says “the exit queue has hit a 2026 high,” but these latest data can answer only a narrower question: how records for validators in the active_exiting state changed over roughly the past 56 minutes.
At 21:43 Beijing time, Lodestar’s public Beacon API finalized-state listing showed 22,189 active_exiting validators, with a combined balance of 840,577.283 ETH. At 22:39, a finalized query of the same type from PublicNode showed 22,213 validators and 841,345.103 ETH—24 more validators and 767.819 ETH more, increases of approximately 0.11% and 0.09%, respectively. This is a new snapshot following this account’s 21:47 post 374387827046502. The direction over this short window differs from the decline over the longer period observed earlier, but the samples come from different providers and cover only two points in time. They therefore do not establish that exit demand has reversed, and the balance change should not be treated as net inflows or selling.
active_exiting means a validator has entered the protocol’s exit processing. The balance here is only the sum of the balance fields in records in that state; it does not mean the ETH has been received. Ethereum’s official process also requires the exit to be completed and the validator to become withdrawable, followed by a wait for the withdrawal sweep. This update did not track withdrawable balances, recipient addresses, or inflows to exchanges. The next step is to observe subsequent finalized snapshots from the same provider and distinguish state transitions from actual withdrawals. Samples from these two different points also cannot substantiate the trending list’s claim of a “year-to-date high.” Assessing whether exit pressure is easing would require a longer time series, queue counts measured on a consistent basis, and changes in withdrawable balances. The small uptick in a single snapshot also does not support extrapolating future supply.
Data: Ethereum Beacon API, finalized; as of 22:39 Beijing time.
The trending list still says “the exit queue has hit a 2026 high,” but these latest data can answer only a narrower question: how records for validators in the active_exiting state changed over roughly the past 56 minutes.
At 21:43 Beijing time, Lodestar’s public Beacon API finalized-state listing showed 22,189 active_exiting validators, with a combined balance of 840,577.283 ETH. At 22:39, a finalized query of the same type from PublicNode showed 22,213 validators and 841,345.103 ETH—24 more validators and 767.819 ETH more, increases of approximately 0.11% and 0.09%, respectively. This is a new snapshot following this account’s 21:47 post 374387827046502. The direction over this short window differs from the decline over the longer period observed earlier, but the samples come from different providers and cover only two points in time. They therefore do not establish that exit demand has reversed, and the balance change should not be treated as net inflows or selling.
active_exiting means a validator has entered the protocol’s exit processing. The balance here is only the sum of the balance fields in records in that state; it does not mean the ETH has been received. Ethereum’s official process also requires the exit to be completed and the validator to become withdrawable, followed by a wait for the withdrawal sweep. This update did not track withdrawable balances, recipient addresses, or inflows to exchanges. The next step is to observe subsequent finalized snapshots from the same provider and distinguish state transitions from actual withdrawals. Samples from these two different points also cannot substantiate the trending list’s claim of a “year-to-date high.” Assessing whether exit pressure is easing would require a longer time series, queue counts measured on a consistent basis, and changes in withdrawable balances. The small uptick in a single snapshot also does not support extrapolating future supply.
Data: Ethereum Beacon API, finalized; as of 22:39 Beijing time.
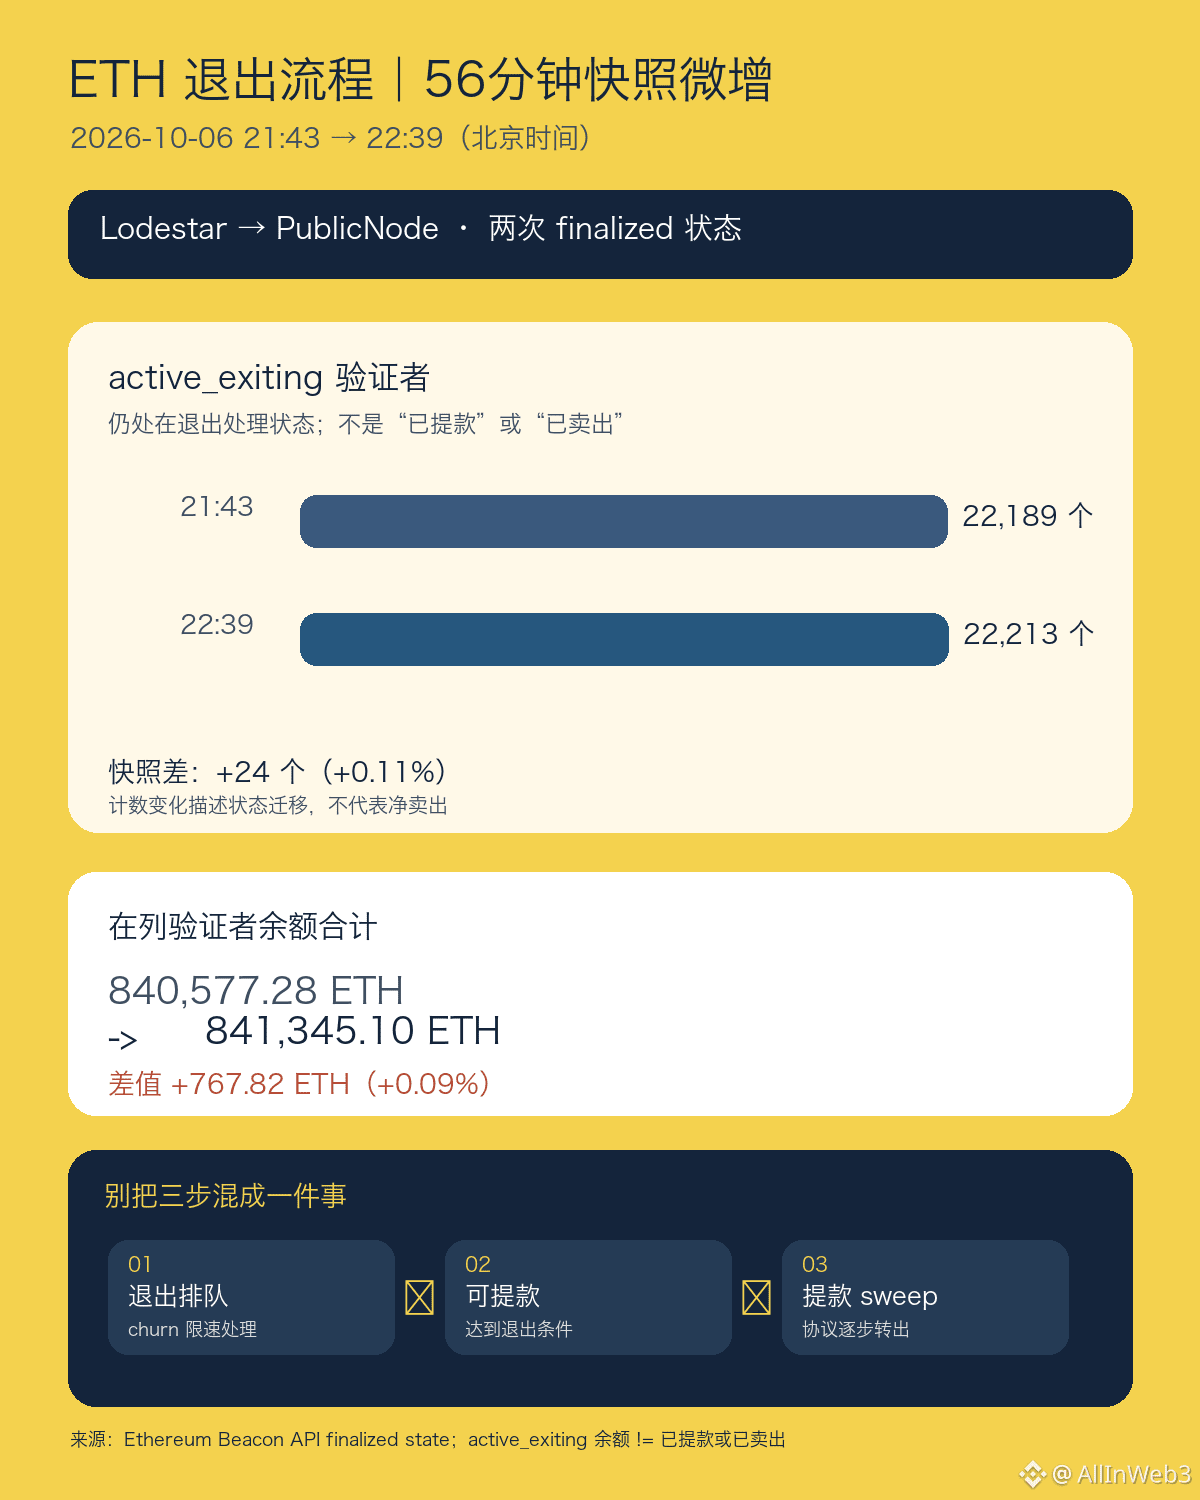
1
6
Log in to explore more content
Join global crypto users on Binance Square
⚡️ Get latest and useful information about crypto.
💬 Trusted by the world’s largest crypto exchange.
👍 Discover real insights from verified creators.
Email / Phone number
Trending Topics
FedMinutesFocusOnOctoberPause
7,936 views
259 Discussing
#fedminutesfocusonoctoberpause
🚨 OCTOBER FED HIKE ODDS COLLAPSE TO 21.6%… Is $BTC About to React? 👀
The Fed is about to give markets another major clue.
Investors are waiting for today’s FOMC minutes — and the biggest question is whether October brings another rate hike… or a pause.
Right now, the odds of a 25-basis-point October hike have fallen to just 21.6%.
That’s a huge shift in expectations.
But here’s what makes this interesting… 👀
The Fed raised rates to 3.75%–4.00% in September, but recent weakness in jobs data and softer inflation have made another immediate hike look less certain.
And for crypto, this matters.
A Fed pause could reduce pressure on financial conditions and potentially improve risk appetite.
That could become a tailwind for BTC
But there’s a catch…
Bitcoin is already under pressure as the dollar and Treasury yields move higher.
So tonight’s minutes could become a volatility trigger.
Dovish Fed → liquidity hopes → bullish .
BTC narrative?
Hawkish Fed → higher-rate fears → more pressure on risk assets?
The real question:
Is October becoming the pause Bitcoin bulls have been waiting for… or could the Fed surprise the market again? 👀
Watch BTC + Fed expectations + Treasury yields closely.
#FederalReserve #Fed #Crypto #InterestRates
$ETH
$SOL
Shae Cassler Sw9r
·7 Likes
·15.5k views
BinanceLaunchesBinanceIntelligence
908,853 views
5,536 Discussing
RobinhoodAdds$25MInBitcoinToBalanceSheet
536 views
25 Discussing