
Abo Malak
2.1k Posts

Abo Malak
 Square Verified+
Report
Block User
ابسط لك الأسواق المالية والاستثمار رائد محتوى اقتصادي ومؤثر مالي معتمد ومسجل لدى SCA في الإمارات قناة التيلجرام @AboMalllak
34 Following
39.5K+ Followers
16.4K+ Liked
Posts
All
Quotes
Videos
Live
PINNED
·
--
Binance’s million-dollar campaign has officially begun! 🔥
In this video, you’ll learn:
🐪 What the “Caravan” campaign is and how its 1 million USDC in rewards are distributed
✅ How to find out which activities are available in your country
🎁 How to get a voucher worth up to 20 USDC from your first trade
🏆 How to enter trading competitions with 75,000 USDC in prizes
📈 Which activities are related to bStocks and Earn
The campaign runs until November 30.
Campaign link:
[https://www.binance.com/referral/mystery-box/join-my-qafila/claim?ref=BBW12](https://www.binance.com/referral/mystery-box/join-my-qafila/claim?ref=BBW12)
Visit and read the terms yourself before participating.
Binance’s million-dollar campaign has officially begun! 🔥
In this video, you’ll learn:
🐪 What the “Caravan” campaign is and how its 1 million USDC in rewards are distributed
✅ How to find out which activities are available in your country
🎁 How to get a voucher worth up to 20 USDC from your first trade
🏆 How to enter trading competitions with 75,000 USDC in prizes
📈 Which activities are related to bStocks and Earn
The campaign runs until November 30.
Campaign link:
https://www.binance.com/referral/mystery-box/join-my-qafila/claim?ref=BBW12
Visit and read the terms yourself before participating.
In this video, you’ll learn:
🐪 What the “Caravan” campaign is and how its 1 million USDC in rewards are distributed
✅ How to find out which activities are available in your country
🎁 How to get a voucher worth up to 20 USDC from your first trade
🏆 How to enter trading competitions with 75,000 USDC in prizes
📈 Which activities are related to bStocks and Earn
The campaign runs until November 30.
Campaign link:
https://www.binance.com/referral/mystery-box/join-my-qafila/claim?ref=BBW12
Visit and read the terms yourself before participating.
6
8
54
13.4k
·
--
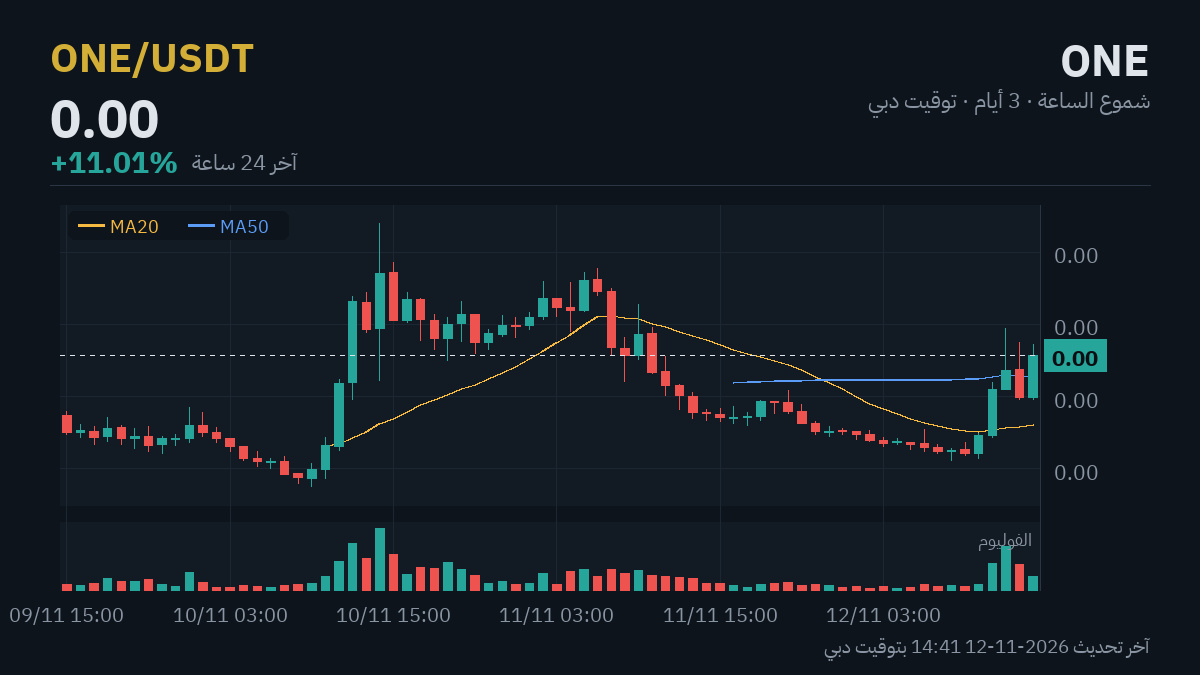
🚀 Pump watch: $ONE up +14.7% in 4 hours
Move strength: 77/100
✅ $10M liquidity | ✅ Holding 95% of its peak | ✅ Volume is confirming
▪️ Current price: $0.001714
▪️ 24-hour change: +10.9%
📊 Levels driving the move:
▪️ Holding above $0.001304 = the move is still intact
▪️ Breaking above $0.001797 = the door remains open for continuation
▪️ Falling back below $0.0014938716 (the start of the wave) = consider it over
ONE is posting a notable gain of +14.7% in 4 hours, backed by liquidity that has reached $10 million, with the price currently at $0.001714.
The continuation of the uptrend depends on the price breaking through the nearby resistance at $0.001797 with sustained trading volume, which could open the door to another upward move.
On the other hand, if the price fails to break through resistance and starts pulling back, that could signal weakening momentum. The support level at $0.001304 would then be the key level to watch for any potential decline.
The move is still in the testing phase, and watching these two levels matters more than chasing the gain that has already happened.
If you're planning to enter after a rally like this, scaling in can help protect you from putting everything in at the top:
1- First tranche if it returns to $0.0016589679
2- Second at $0.0016039358
3- Third at $0.0015489037
If it closes below $0.0014938716, the plan has failed and you should exit. Your loss would then be around 7% of the amount, not the whole thing.
The exit level is the start of the wave above—below it, the move is considered over.
Do your own research (DYOR)—this is a risk-management approach, not a recommendation.
Will the move continue, or is this the top? The chart is right in front of you 👇 $ONE
⚠️ These pump moves can swing violently in both directions—getting in late is riskier than missing out.
📉 The surrounding market: $BTC moved -0.7% during the same hours.
#ONE #Altcoins #Cryptocurrency
⚠️ Educational content for monitoring purposes—not investment advice. Your decisions are your responsibility.
🚀 Pump watch: $ONE up +14.7% in 4 hours
Move strength: 77/100
✅ $10M liquidity | ✅ Holding 95% of its peak | ✅ Volume is confirming
▪️ Current price: $0.001714
▪️ 24-hour change: +10.9%
📊 Levels driving the move:
▪️ Holding above $0.001304 = the move is still intact
▪️ Breaking above $0.001797 = the door remains open for continuation
▪️ Falling back below $0.0014938716 (the start of the wave) = consider it over
ONE is posting a notable gain of +14.7% in 4 hours, backed by liquidity that has reached $10 million, with the price currently at $0.001714.
The continuation of the uptrend depends on the price breaking through the nearby resistance at $0.001797 with sustained trading volume, which could open the door to another upward move.
On the other hand, if the price fails to break through resistance and starts pulling back, that could signal weakening momentum. The support level at $0.001304 would then be the key level to watch for any potential decline.
The move is still in the testing phase, and watching these two levels matters more than chasing the gain that has already happened.
If you're planning to enter after a rally like this, scaling in can help protect you from putting everything in at the top:
1- First tranche if it returns to $0.0016589679
2- Second at $0.0016039358
3- Third at $0.0015489037
If it closes below $0.0014938716, the plan has failed and you should exit. Your loss would then be around 7% of the amount, not the whole thing.
The exit level is the start of the wave above—below it, the move is considered over.
Do your own research (DYOR)—this is a risk-management approach, not a recommendation.
Will the move continue, or is this the top? The chart is right in front of you 👇 $ONE
⚠️ These pump moves can swing violently in both directions—getting in late is riskier than missing out.
📉 The surrounding market: $BTC moved -0.7% during the same hours.
#ONE #Altcoins #Cryptocurrency
⚠️ Educational content for monitoring purposes—not investment advice. Your decisions are your responsibility.
Move strength: 77/100
✅ $10M liquidity | ✅ Holding 95% of its peak | ✅ Volume is confirming
▪️ Current price: $0.001714
▪️ 24-hour change: +10.9%
📊 Levels driving the move:
▪️ Holding above $0.001304 = the move is still intact
▪️ Breaking above $0.001797 = the door remains open for continuation
▪️ Falling back below $0.0014938716 (the start of the wave) = consider it over
ONE is posting a notable gain of +14.7% in 4 hours, backed by liquidity that has reached $10 million, with the price currently at $0.001714.
The continuation of the uptrend depends on the price breaking through the nearby resistance at $0.001797 with sustained trading volume, which could open the door to another upward move.
On the other hand, if the price fails to break through resistance and starts pulling back, that could signal weakening momentum. The support level at $0.001304 would then be the key level to watch for any potential decline.
The move is still in the testing phase, and watching these two levels matters more than chasing the gain that has already happened.
If you're planning to enter after a rally like this, scaling in can help protect you from putting everything in at the top:
1- First tranche if it returns to $0.0016589679
2- Second at $0.0016039358
3- Third at $0.0015489037
If it closes below $0.0014938716, the plan has failed and you should exit. Your loss would then be around 7% of the amount, not the whole thing.
The exit level is the start of the wave above—below it, the move is considered over.
Do your own research (DYOR)—this is a risk-management approach, not a recommendation.
Will the move continue, or is this the top? The chart is right in front of you 👇 $ONE
⚠️ These pump moves can swing violently in both directions—getting in late is riskier than missing out.
📉 The surrounding market: $BTC moved -0.7% during the same hours.
#ONE #Altcoins #Cryptocurrency
⚠️ Educational content for monitoring purposes—not investment advice. Your decisions are your responsibility.
2
535
·
--
Lesson 83 of 100 — From my experience in the market
Chart patterns — triangles, flags, and head and shoulders: how useful are they?
Chart patterns are shapes that repeat on charts because people’s behavior repeats—not because they’re rules.
The most popular ones:
1️⃣ Triangle: price narrows between lower highs and higher lows—the movement builds up before a strong breakout in some direction
2️⃣ Flag: a sharp rise followed by a short, sloping pause—often a continuation of the move
3️⃣ Head and shoulders: three peaks, with the middle one being the highest—one of the best-known reversal patterns for an uptrend, with an inverted version at the bottom
How to use them correctly:
· The pattern isn’t complete until there’s a breakout confirmed by a close—acting before the breakout is just guessing
· Volume during the breakout matters: a breakout on weak volume is more likely to be false
· Place your stop where, if the price reaches it, the pattern has failed
A pattern gives you a higher-probability scenario—not a promise. And the patterns you see everywhere are often just your eyes drawing them.
Bottom line: chart patterns reflect repeated behavior, not rules—wait for a breakout confirmed by a close and volume, and identify where the pattern fails before relying on it.
Which of these points was new to you? Write its number in the comments 👇
#العملات_الرقمية #تعلم_الكريبتو #Binance
⚠️ Educational content — not investment advice
Lesson 83 of 100 — From my experience in the market
Chart patterns — triangles, flags, and head and shoulders: how useful are they?
Chart patterns are shapes that repeat on charts because people’s behavior repeats—not because they’re rules.
The most popular ones:
1️⃣ Triangle: price narrows between lower highs and higher lows—the movement builds up before a strong breakout in some direction
2️⃣ Flag: a sharp rise followed by a short, sloping pause—often a continuation of the move
3️⃣ Head and shoulders: three peaks, with the middle one being the highest—one of the best-known reversal patterns for an uptrend, with an inverted version at the bottom
How to use them correctly:
· The pattern isn’t complete until there’s a breakout confirmed by a close—acting before the breakout is just guessing
· Volume during the breakout matters: a breakout on weak volume is more likely to be false
· Place your stop where, if the price reaches it, the pattern has failed
A pattern gives you a higher-probability scenario—not a promise. And the patterns you see everywhere are often just your eyes drawing them.
Bottom line: chart patterns reflect repeated behavior, not rules—wait for a breakout confirmed by a close and volume, and identify where the pattern fails before relying on it.
Which of these points was new to you? Write its number in the comments 👇
#العملات_الرقمية #تعلم_الكريبتو #Binance
⚠️ Educational content — not investment advice
Chart patterns — triangles, flags, and head and shoulders: how useful are they?
Chart patterns are shapes that repeat on charts because people’s behavior repeats—not because they’re rules.
The most popular ones:
1️⃣ Triangle: price narrows between lower highs and higher lows—the movement builds up before a strong breakout in some direction
2️⃣ Flag: a sharp rise followed by a short, sloping pause—often a continuation of the move
3️⃣ Head and shoulders: three peaks, with the middle one being the highest—one of the best-known reversal patterns for an uptrend, with an inverted version at the bottom
How to use them correctly:
· The pattern isn’t complete until there’s a breakout confirmed by a close—acting before the breakout is just guessing
· Volume during the breakout matters: a breakout on weak volume is more likely to be false
· Place your stop where, if the price reaches it, the pattern has failed
A pattern gives you a higher-probability scenario—not a promise. And the patterns you see everywhere are often just your eyes drawing them.
Bottom line: chart patterns reflect repeated behavior, not rules—wait for a breakout confirmed by a close and volume, and identify where the pattern fails before relying on it.
Which of these points was new to you? Write its number in the comments 👇
#العملات_الرقمية #تعلم_الكريبتو #Binance
⚠️ Educational content — not investment advice
1
2
614
·
--
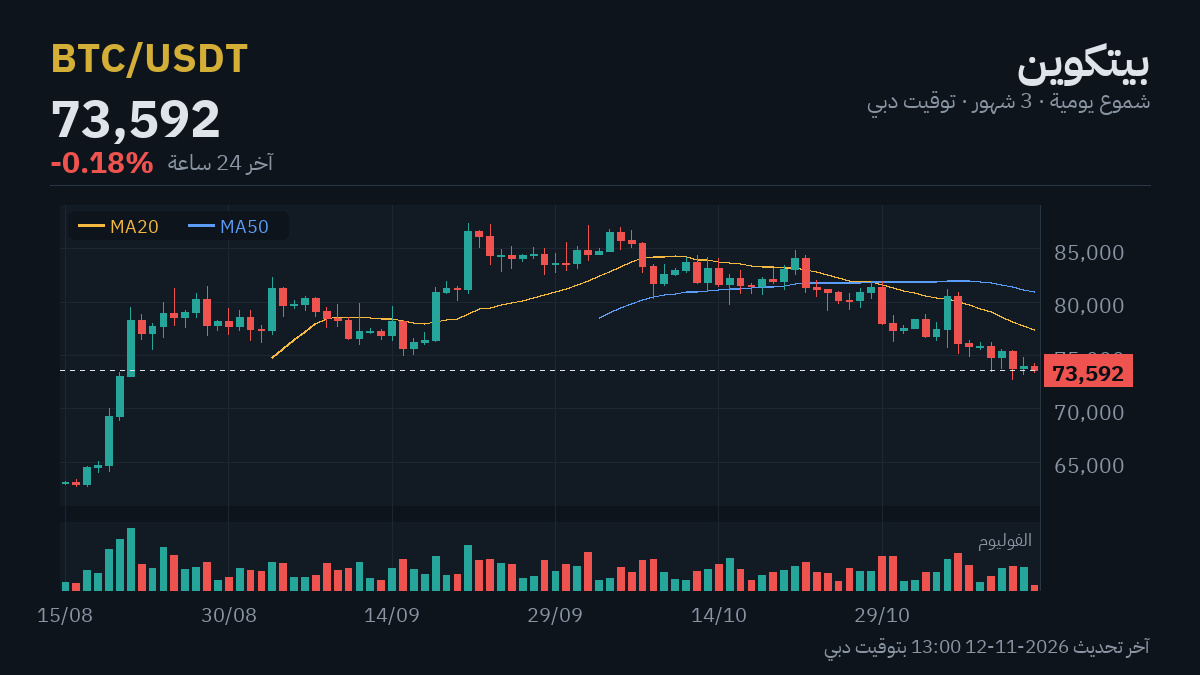
$BTC at $73,596 (-0.2%) · $ETH at $2,050 (-0.4%)
The market is volatile, and the question that keeps coming up is: should we wait, or has the picture become clearer?
Resistance: $74,815, then $75,614
Support: $73,212, then $72,410
As long as we’re below the falling average, caution is the default.
If it closes above $74,815, the outlook improves.
If you’re planning to enter Bitcoin, buying in stages can protect you:
1- First tranche if it pulls back to $71,388
2- Second at $69,181
3- Third at $66,973
If it closes below $64,765, the plan has failed and you should exit. At that point, your loss would be about 6% of the amount, not all of it.
The gap between tranches is 3% because that’s Bitcoin’s average daily move over the last 14 days.
Do your own research (DYOR) — this is a risk-management approach, not a recommendation.
What level are you watching?
💛 Join Abu Malak’s team: sign up on Binance with code ABOMALAK — get a permanent discount on trading fees and access to our services and offers.
#CryptoNews #العملات_الرقمية #Binance
⚠️ Educational content for informational purposes — not investment advice. You are responsible for your decisions.
$BTC at $73,596 (-0.2%) · $ETH at $2,050 (-0.4%)
The market is volatile, and the question that keeps coming up is: should we wait, or has the picture become clearer?
Resistance: $74,815, then $75,614
Support: $73,212, then $72,410
As long as we’re below the falling average, caution is the default.
If it closes above $74,815, the outlook improves.
If you’re planning to enter Bitcoin, buying in stages can protect you:
1- First tranche if it pulls back to $71,388
2- Second at $69,181
3- Third at $66,973
If it closes below $64,765, the plan has failed and you should exit. At that point, your loss would be about 6% of the amount, not all of it.
The gap between tranches is 3% because that’s Bitcoin’s average daily move over the last 14 days.
Do your own research (DYOR) — this is a risk-management approach, not a recommendation.
What level are you watching?
💛 Join Abu Malak’s team: sign up on Binance with code ABOMALAK — get a permanent discount on trading fees and access to our services and offers.
#CryptoNews #العملات_الرقمية #Binance
⚠️ Educational content for informational purposes — not investment advice. You are responsible for your decisions.
The market is volatile, and the question that keeps coming up is: should we wait, or has the picture become clearer?
Resistance: $74,815, then $75,614
Support: $73,212, then $72,410
As long as we’re below the falling average, caution is the default.
If it closes above $74,815, the outlook improves.
If you’re planning to enter Bitcoin, buying in stages can protect you:
1- First tranche if it pulls back to $71,388
2- Second at $69,181
3- Third at $66,973
If it closes below $64,765, the plan has failed and you should exit. At that point, your loss would be about 6% of the amount, not all of it.
The gap between tranches is 3% because that’s Bitcoin’s average daily move over the last 14 days.
Do your own research (DYOR) — this is a risk-management approach, not a recommendation.
What level are you watching?
💛 Join Abu Malak’s team: sign up on Binance with code ABOMALAK — get a permanent discount on trading fees and access to our services and offers.
#CryptoNews #العملات_الرقمية #Binance
⚠️ Educational content for informational purposes — not investment advice. You are responsible for your decisions.
384
·
--
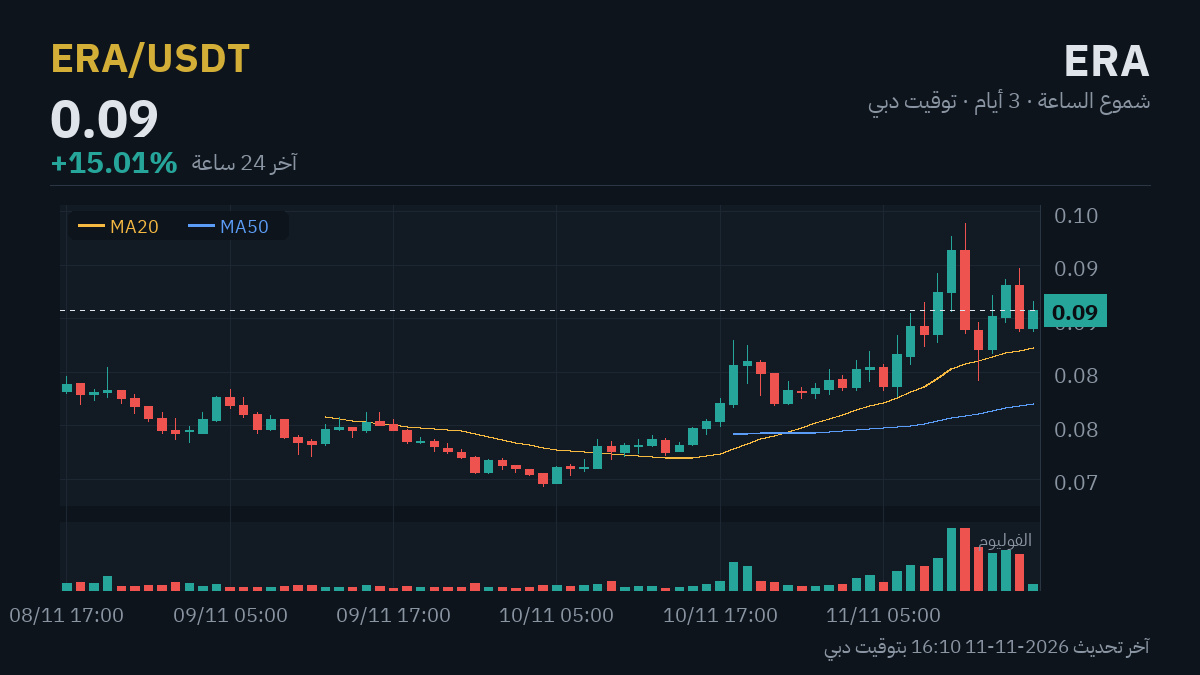
🚀 Pump watch: $ERA up +14.9% in 24 hours
Momentum strength: 66/100
✅ $14M liquidity | ✅ Holding 95% of its peak | ✅ Volume is keeping pace
▪️ Current price: $0.0858
📊 Key levels to watch:
▪️ Holding above $0.072 = the move is still intact
▪️ Breaking above $0.0857 = the door remains open for continuation
▪️ Falling back below $0.074687 (the start of the move) = consider it over
ERA is up +14.9% over 24 hours, and current liquidity of $14 million is giving the move relatively solid momentum.
Scenario one: If the price manages to hold above the $0.0857 area and turns it from resistance into support, that opens the door for the upward momentum to continue—as long as liquidity remains at the same level or increases.
Scenario two: If the price falls back below $0.072, that would signal weakness and the end of the current rally, especially if accompanied by a clear liquidity outflow.
The next few hours will show which scenario actually plays out.
If you’re planning to enter after a move like this, scaling in protects you from putting everything in at the top:
1- First entry if it pulls back to $0.083022
2- Second at $0.080244
3- Third at $0.077465
If it closes below $0.074687, the plan has failed and you exit. Your loss would then be around 7% of the amount, not the whole thing.
The exit level is where the move started above—below it, the move is considered over.
Do your own research (DYOR)—this is a risk management approach, not a recommendation.
Will the move continue, or is this the peak? The chart is in front of you 👇 $ERA
⚠️ These pump moves can swing violently in both directions—late entries are riskier than missing out.
📉 The surrounding market: $BTC moved -0.5% over the same hours.
#ERA #Altcoins #Cryptocurrencies
⚠️ Educational content for tracking purposes—not investment advice. The decision is yours.
🚀 Pump watch: $ERA up +14.9% in 24 hours
Momentum strength: 66/100
✅ $14M liquidity | ✅ Holding 95% of its peak | ✅ Volume is keeping pace
▪️ Current price: $0.0858
📊 Key levels to watch:
▪️ Holding above $0.072 = the move is still intact
▪️ Breaking above $0.0857 = the door remains open for continuation
▪️ Falling back below $0.074687 (the start of the move) = consider it over
ERA is up +14.9% over 24 hours, and current liquidity of $14 million is giving the move relatively solid momentum.
Scenario one: If the price manages to hold above the $0.0857 area and turns it from resistance into support, that opens the door for the upward momentum to continue—as long as liquidity remains at the same level or increases.
Scenario two: If the price falls back below $0.072, that would signal weakness and the end of the current rally, especially if accompanied by a clear liquidity outflow.
The next few hours will show which scenario actually plays out.
If you’re planning to enter after a move like this, scaling in protects you from putting everything in at the top:
1- First entry if it pulls back to $0.083022
2- Second at $0.080244
3- Third at $0.077465
If it closes below $0.074687, the plan has failed and you exit. Your loss would then be around 7% of the amount, not the whole thing.
The exit level is where the move started above—below it, the move is considered over.
Do your own research (DYOR)—this is a risk management approach, not a recommendation.
Will the move continue, or is this the peak? The chart is in front of you 👇 $ERA
⚠️ These pump moves can swing violently in both directions—late entries are riskier than missing out.
📉 The surrounding market: $BTC moved -0.5% over the same hours.
#ERA #Altcoins #Cryptocurrencies
⚠️ Educational content for tracking purposes—not investment advice. The decision is yours.
Momentum strength: 66/100
✅ $14M liquidity | ✅ Holding 95% of its peak | ✅ Volume is keeping pace
▪️ Current price: $0.0858
📊 Key levels to watch:
▪️ Holding above $0.072 = the move is still intact
▪️ Breaking above $0.0857 = the door remains open for continuation
▪️ Falling back below $0.074687 (the start of the move) = consider it over
ERA is up +14.9% over 24 hours, and current liquidity of $14 million is giving the move relatively solid momentum.
Scenario one: If the price manages to hold above the $0.0857 area and turns it from resistance into support, that opens the door for the upward momentum to continue—as long as liquidity remains at the same level or increases.
Scenario two: If the price falls back below $0.072, that would signal weakness and the end of the current rally, especially if accompanied by a clear liquidity outflow.
The next few hours will show which scenario actually plays out.
If you’re planning to enter after a move like this, scaling in protects you from putting everything in at the top:
1- First entry if it pulls back to $0.083022
2- Second at $0.080244
3- Third at $0.077465
If it closes below $0.074687, the plan has failed and you exit. Your loss would then be around 7% of the amount, not the whole thing.
The exit level is where the move started above—below it, the move is considered over.
Do your own research (DYOR)—this is a risk management approach, not a recommendation.
Will the move continue, or is this the peak? The chart is in front of you 👇 $ERA
⚠️ These pump moves can swing violently in both directions—late entries are riskier than missing out.
📉 The surrounding market: $BTC moved -0.5% over the same hours.
#ERA #Altcoins #Cryptocurrencies
⚠️ Educational content for tracking purposes—not investment advice. The decision is yours.
1
1
400
·
--
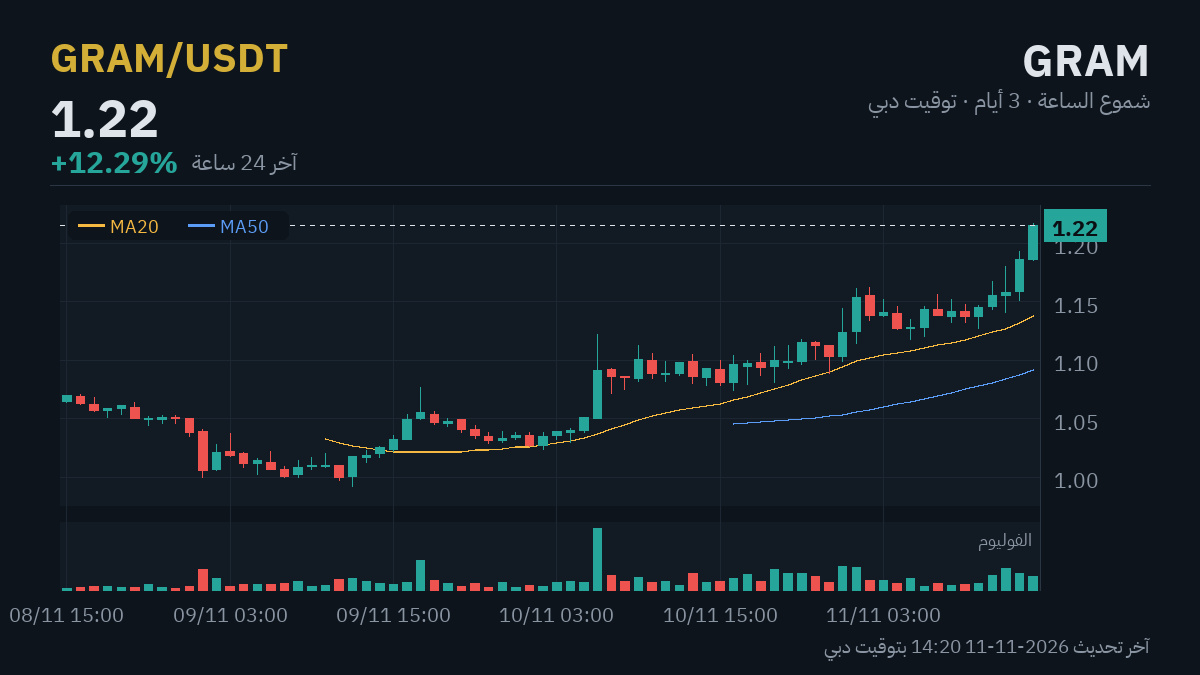
🚀 Pump watch: $GRAM up +12.2% in 24 hours
Move strength: 85/100
✅ $19M liquidity | ✅ Holding 99% of its peak | ✅ Volume is supporting the move
▪️ Current price: $1.22
📊 Key levels guiding the move:
▪️ Holding above $1.06 = the move is still intact
▪️ Breaking above $1.19 = the door is open for further gains
▪️ Falling back below $1.08 (the start of the wave) = consider it over
**GRAM move watch**
The coin rose +12.2% over 24 hours, with liquidity reaching $19 million. It is currently priced at $1.22 after breaking through the resistance level at $1.19.
**Continuation scenario:** If the price manages to hold above the $1.19 area and turn it into new support, that signals that momentum is still there and liquidity is supporting the upward move.
**End-of-move scenario:** If the price reverses, breaks back below the $1.19 area, and heads toward the next support at $1.06, that indicates the pump has lost strength and selling pressure is starting to take over.
Monitoring liquidity and volume over the next few hours will show which scenario is playing out.
If you're planning to enter after a rise like this, buying in stages can protect you from putting everything in at the peak:
1- First portion if it returns to $1.18
2- Second at $1.15
3- Third at $1.12
If it closes below $1.08, the plan has failed and you exit. At that point, your loss is about 6% of the amount, not all of it.
The exit level is the start of the wave above — below it, consider the move over.
Do your own research (DYOR) — this is a risk-management approach, not a recommendation.
Will the move continue, or is this the peak? The chart is in front of you 👇 $GRAM
⚠️ These pump moves can swing violently in both directions — entering late is riskier than missing out.
📉 The surrounding market: $BTC down -0.6% over the same hours.
#GRAM #Altcoins #cryptocurrencies
⚠️ Educational content for monitoring purposes — not investment advice. The decision is yours.
🚀 Pump watch: $GRAM up +12.2% in 24 hours
Move strength: 85/100
✅ $19M liquidity | ✅ Holding 99% of its peak | ✅ Volume is supporting the move
▪️ Current price: $1.22
📊 Key levels guiding the move:
▪️ Holding above $1.06 = the move is still intact
▪️ Breaking above $1.19 = the door is open for further gains
▪️ Falling back below $1.08 (the start of the wave) = consider it over
**GRAM move watch**
The coin rose +12.2% over 24 hours, with liquidity reaching $19 million. It is currently priced at $1.22 after breaking through the resistance level at $1.19.
**Continuation scenario:** If the price manages to hold above the $1.19 area and turn it into new support, that signals that momentum is still there and liquidity is supporting the upward move.
**End-of-move scenario:** If the price reverses, breaks back below the $1.19 area, and heads toward the next support at $1.06, that indicates the pump has lost strength and selling pressure is starting to take over.
Monitoring liquidity and volume over the next few hours will show which scenario is playing out.
If you're planning to enter after a rise like this, buying in stages can protect you from putting everything in at the peak:
1- First portion if it returns to $1.18
2- Second at $1.15
3- Third at $1.12
If it closes below $1.08, the plan has failed and you exit. At that point, your loss is about 6% of the amount, not all of it.
The exit level is the start of the wave above — below it, consider the move over.
Do your own research (DYOR) — this is a risk-management approach, not a recommendation.
Will the move continue, or is this the peak? The chart is in front of you 👇 $GRAM
⚠️ These pump moves can swing violently in both directions — entering late is riskier than missing out.
📉 The surrounding market: $BTC down -0.6% over the same hours.
#GRAM #Altcoins #cryptocurrencies
⚠️ Educational content for monitoring purposes — not investment advice. The decision is yours.
Move strength: 85/100
✅ $19M liquidity | ✅ Holding 99% of its peak | ✅ Volume is supporting the move
▪️ Current price: $1.22
📊 Key levels guiding the move:
▪️ Holding above $1.06 = the move is still intact
▪️ Breaking above $1.19 = the door is open for further gains
▪️ Falling back below $1.08 (the start of the wave) = consider it over
**GRAM move watch**
The coin rose +12.2% over 24 hours, with liquidity reaching $19 million. It is currently priced at $1.22 after breaking through the resistance level at $1.19.
**Continuation scenario:** If the price manages to hold above the $1.19 area and turn it into new support, that signals that momentum is still there and liquidity is supporting the upward move.
**End-of-move scenario:** If the price reverses, breaks back below the $1.19 area, and heads toward the next support at $1.06, that indicates the pump has lost strength and selling pressure is starting to take over.
Monitoring liquidity and volume over the next few hours will show which scenario is playing out.
If you're planning to enter after a rise like this, buying in stages can protect you from putting everything in at the peak:
1- First portion if it returns to $1.18
2- Second at $1.15
3- Third at $1.12
If it closes below $1.08, the plan has failed and you exit. At that point, your loss is about 6% of the amount, not all of it.
The exit level is the start of the wave above — below it, consider the move over.
Do your own research (DYOR) — this is a risk-management approach, not a recommendation.
Will the move continue, or is this the peak? The chart is in front of you 👇 $GRAM
⚠️ These pump moves can swing violently in both directions — entering late is riskier than missing out.
📉 The surrounding market: $BTC down -0.6% over the same hours.
#GRAM #Altcoins #cryptocurrencies
⚠️ Educational content for monitoring purposes — not investment advice. The decision is yours.
1
3
590
·
--
Lesson 82 of 100 — From my experience in the market
Peaks and troughs — how can you tell the trend is changing before everyone else?
The simplest way to read a trend without any indicators is to follow the peaks and troughs.
· Uptrend: each peak is higher than the previous one, and each trough is higher than the previous one
· Downtrend: lower peaks and lower troughs
· Sideways: peaks and troughs are close together in the same area
Signs that an uptrend is weakening:
1️⃣ The price fails to make a higher peak — it stalls below the previous peak
2️⃣ Then it breaks the last significant trough — this is the first confirmation that the structure has changed
3️⃣ Volume decreases during the rise and increases during the fall
The reverse applies in a downtrend: the first trough higher than the previous one, followed by a break above the last peak.
Keep in mind: a single break can turn out to be a false breakout—as we learned. Confirmation comes from a candle closing on a significant timeframe, not from a quick touch.
Bottom line: a trend is the sequence of peaks and troughs. Failing to make a higher peak, then breaking the last significant trough, is the clearest sign that the direction is changing. Confirmation comes from the close, not the touch.
Which of these points was new to you? Write its number in the comments 👇
#العملات_الرقمية #تعلم_الكريبتو #Binance
⚠️ Educational content—not investment advice
Lesson 82 of 100 — From my experience in the market
Peaks and troughs — how can you tell the trend is changing before everyone else?
The simplest way to read a trend without any indicators is to follow the peaks and troughs.
· Uptrend: each peak is higher than the previous one, and each trough is higher than the previous one
· Downtrend: lower peaks and lower troughs
· Sideways: peaks and troughs are close together in the same area
Signs that an uptrend is weakening:
1️⃣ The price fails to make a higher peak — it stalls below the previous peak
2️⃣ Then it breaks the last significant trough — this is the first confirmation that the structure has changed
3️⃣ Volume decreases during the rise and increases during the fall
The reverse applies in a downtrend: the first trough higher than the previous one, followed by a break above the last peak.
Keep in mind: a single break can turn out to be a false breakout—as we learned. Confirmation comes from a candle closing on a significant timeframe, not from a quick touch.
Bottom line: a trend is the sequence of peaks and troughs. Failing to make a higher peak, then breaking the last significant trough, is the clearest sign that the direction is changing. Confirmation comes from the close, not the touch.
Which of these points was new to you? Write its number in the comments 👇
#العملات_الرقمية #تعلم_الكريبتو #Binance
⚠️ Educational content—not investment advice
Peaks and troughs — how can you tell the trend is changing before everyone else?
The simplest way to read a trend without any indicators is to follow the peaks and troughs.
· Uptrend: each peak is higher than the previous one, and each trough is higher than the previous one
· Downtrend: lower peaks and lower troughs
· Sideways: peaks and troughs are close together in the same area
Signs that an uptrend is weakening:
1️⃣ The price fails to make a higher peak — it stalls below the previous peak
2️⃣ Then it breaks the last significant trough — this is the first confirmation that the structure has changed
3️⃣ Volume decreases during the rise and increases during the fall
The reverse applies in a downtrend: the first trough higher than the previous one, followed by a break above the last peak.
Keep in mind: a single break can turn out to be a false breakout—as we learned. Confirmation comes from a candle closing on a significant timeframe, not from a quick touch.
Bottom line: a trend is the sequence of peaks and troughs. Failing to make a higher peak, then breaking the last significant trough, is the clearest sign that the direction is changing. Confirmation comes from the close, not the touch.
Which of these points was new to you? Write its number in the comments 👇
#العملات_الرقمية #تعلم_الكريبتو #Binance
⚠️ Educational content—not investment advice
1
595
·
--
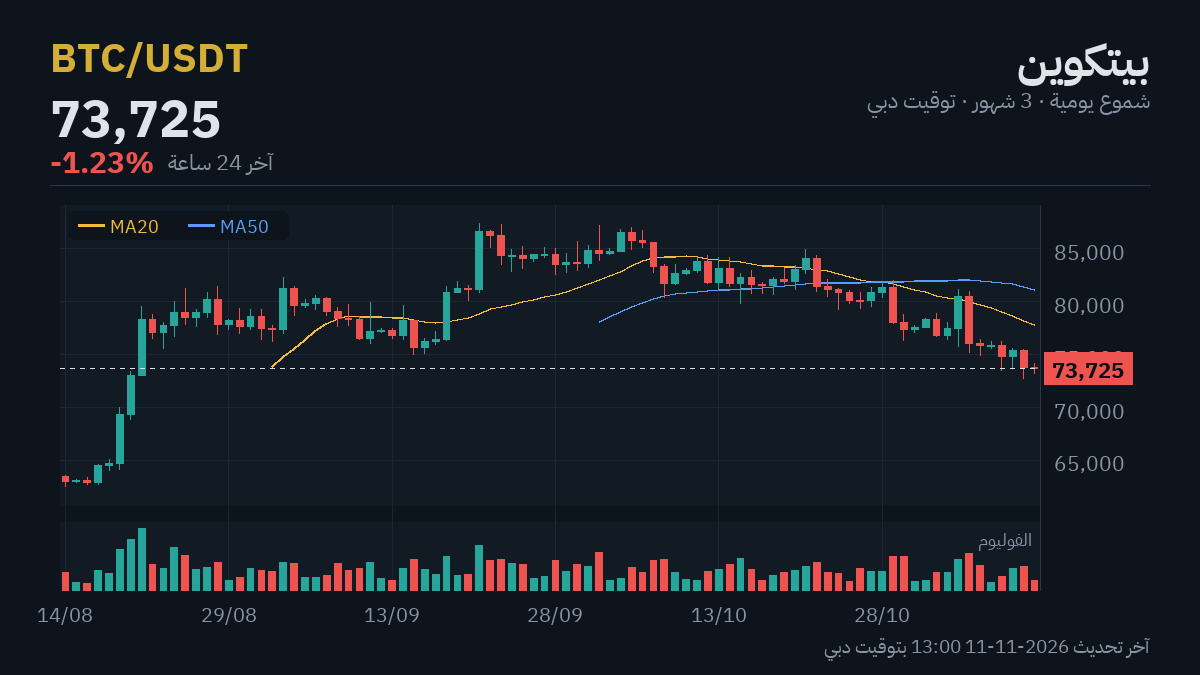
$BTC at $73,728 (-1.3%) · $ETH at $2,058 (-2.8%)
The market is volatile, and the question that keeps coming up is whether to wait or whether things have become clearer.
If you want to boil it down to two numbers: $72,535 below and $75,250 above. Breaking out of this range is what determines what comes next.
The price is below its average, and the average is declining. There’s no need to rush into interpreting the rebound.
The sign that this reading is wrong would be a break below $72,535 on volume.
If you’re planning to buy Bitcoin, buying in installments can protect you:
1- First installment if it returns to $71,516
2- Second at $69,305
3- Third at $67,093
If it closes below $64,881, the plan has failed and you exit. At that point, your loss would be around 6% of the amount, not all of it.
The distance between installments is 3% because that’s Bitcoin’s average daily move over the last 14 days.
Do your own research (DYOR) — this is a risk management approach, not a recommendation.
If there’s another level you’re watching in the market, write it in the comments.
💛 Join Abu Malak’s team: sign up on Binance with code ABOMALAK — get a permanent discount on trading fees and access to our services and offers
#CryptoNews #العملات_الرقمية #Binance
⚠️ Educational content for keeping up with the market — not investment advice. Your decision is your responsibility.
$BTC at $73,728 (-1.3%) · $ETH at $2,058 (-2.8%)
The market is volatile, and the question that keeps coming up is whether to wait or whether things have become clearer.
If you want to boil it down to two numbers: $72,535 below and $75,250 above. Breaking out of this range is what determines what comes next.
The price is below its average, and the average is declining. There’s no need to rush into interpreting the rebound.
The sign that this reading is wrong would be a break below $72,535 on volume.
If you’re planning to buy Bitcoin, buying in installments can protect you:
1- First installment if it returns to $71,516
2- Second at $69,305
3- Third at $67,093
If it closes below $64,881, the plan has failed and you exit. At that point, your loss would be around 6% of the amount, not all of it.
The distance between installments is 3% because that’s Bitcoin’s average daily move over the last 14 days.
Do your own research (DYOR) — this is a risk management approach, not a recommendation.
If there’s another level you’re watching in the market, write it in the comments.
💛 Join Abu Malak’s team: sign up on Binance with code ABOMALAK — get a permanent discount on trading fees and access to our services and offers
#CryptoNews #العملات_الرقمية #Binance
⚠️ Educational content for keeping up with the market — not investment advice. Your decision is your responsibility.
The market is volatile, and the question that keeps coming up is whether to wait or whether things have become clearer.
If you want to boil it down to two numbers: $72,535 below and $75,250 above. Breaking out of this range is what determines what comes next.
The price is below its average, and the average is declining. There’s no need to rush into interpreting the rebound.
The sign that this reading is wrong would be a break below $72,535 on volume.
If you’re planning to buy Bitcoin, buying in installments can protect you:
1- First installment if it returns to $71,516
2- Second at $69,305
3- Third at $67,093
If it closes below $64,881, the plan has failed and you exit. At that point, your loss would be around 6% of the amount, not all of it.
The distance between installments is 3% because that’s Bitcoin’s average daily move over the last 14 days.
Do your own research (DYOR) — this is a risk management approach, not a recommendation.
If there’s another level you’re watching in the market, write it in the comments.
💛 Join Abu Malak’s team: sign up on Binance with code ABOMALAK — get a permanent discount on trading fees and access to our services and offers
#CryptoNews #العملات_الرقمية #Binance
⚠️ Educational content for keeping up with the market — not investment advice. Your decision is your responsibility.
1
252
·
--
Lesson 81 of 100 — From my experience in the market
Timeframes — Why does the chart say one thing on the hourly chart and the opposite on the daily chart?
The same currency at the same moment can be rising on the hourly chart and falling on the daily chart — and both can be right.
Each timeframe tells a story at its own scale:
· Weekly and daily: the big trend — what moves investors’ money
· Four-hour and hourly: the waves within the trend
· Minutes: mostly noise, unless you’re a scalper
A practical approach, from big to small:
1️⃣ Start with the big timeframe: Where’s the overall trend? What are the key support and resistance levels?
2️⃣ Move down to a smaller timeframe to find more precise timing within the bigger picture
3️⃣ If the two timeframes conflict — that’s usually a time to wait, not enter
A common mistake: someone invests for years but makes decisions based on a 15-minute chart — so every little wiggle looks like a disaster. Choose a timeframe that matches your investment horizon.
Bottom line: Each timeframe tells a story at its own scale — start with the big one for the trend, move down to the small one for timing, and choose a timeframe that matches how long you plan to hold your trade.
Which point was new to you? Write its number in the comments 👇
#العملات_الرقمية #تعلم_الكريبتو #Binance
⚠️ Educational content — not investment advice
Lesson 81 of 100 — From my experience in the market
Timeframes — Why does the chart say one thing on the hourly chart and the opposite on the daily chart?
The same currency at the same moment can be rising on the hourly chart and falling on the daily chart — and both can be right.
Each timeframe tells a story at its own scale:
· Weekly and daily: the big trend — what moves investors’ money
· Four-hour and hourly: the waves within the trend
· Minutes: mostly noise, unless you’re a scalper
A practical approach, from big to small:
1️⃣ Start with the big timeframe: Where’s the overall trend? What are the key support and resistance levels?
2️⃣ Move down to a smaller timeframe to find more precise timing within the bigger picture
3️⃣ If the two timeframes conflict — that’s usually a time to wait, not enter
A common mistake: someone invests for years but makes decisions based on a 15-minute chart — so every little wiggle looks like a disaster. Choose a timeframe that matches your investment horizon.
Bottom line: Each timeframe tells a story at its own scale — start with the big one for the trend, move down to the small one for timing, and choose a timeframe that matches how long you plan to hold your trade.
Which point was new to you? Write its number in the comments 👇
#العملات_الرقمية #تعلم_الكريبتو #Binance
⚠️ Educational content — not investment advice
Timeframes — Why does the chart say one thing on the hourly chart and the opposite on the daily chart?
The same currency at the same moment can be rising on the hourly chart and falling on the daily chart — and both can be right.
Each timeframe tells a story at its own scale:
· Weekly and daily: the big trend — what moves investors’ money
· Four-hour and hourly: the waves within the trend
· Minutes: mostly noise, unless you’re a scalper
A practical approach, from big to small:
1️⃣ Start with the big timeframe: Where’s the overall trend? What are the key support and resistance levels?
2️⃣ Move down to a smaller timeframe to find more precise timing within the bigger picture
3️⃣ If the two timeframes conflict — that’s usually a time to wait, not enter
A common mistake: someone invests for years but makes decisions based on a 15-minute chart — so every little wiggle looks like a disaster. Choose a timeframe that matches your investment horizon.
Bottom line: Each timeframe tells a story at its own scale — start with the big one for the trend, move down to the small one for timing, and choose a timeframe that matches how long you plan to hold your trade.
Which point was new to you? Write its number in the comments 👇
#العملات_الرقمية #تعلم_الكريبتو #Binance
⚠️ Educational content — not investment advice
3
774
·
--
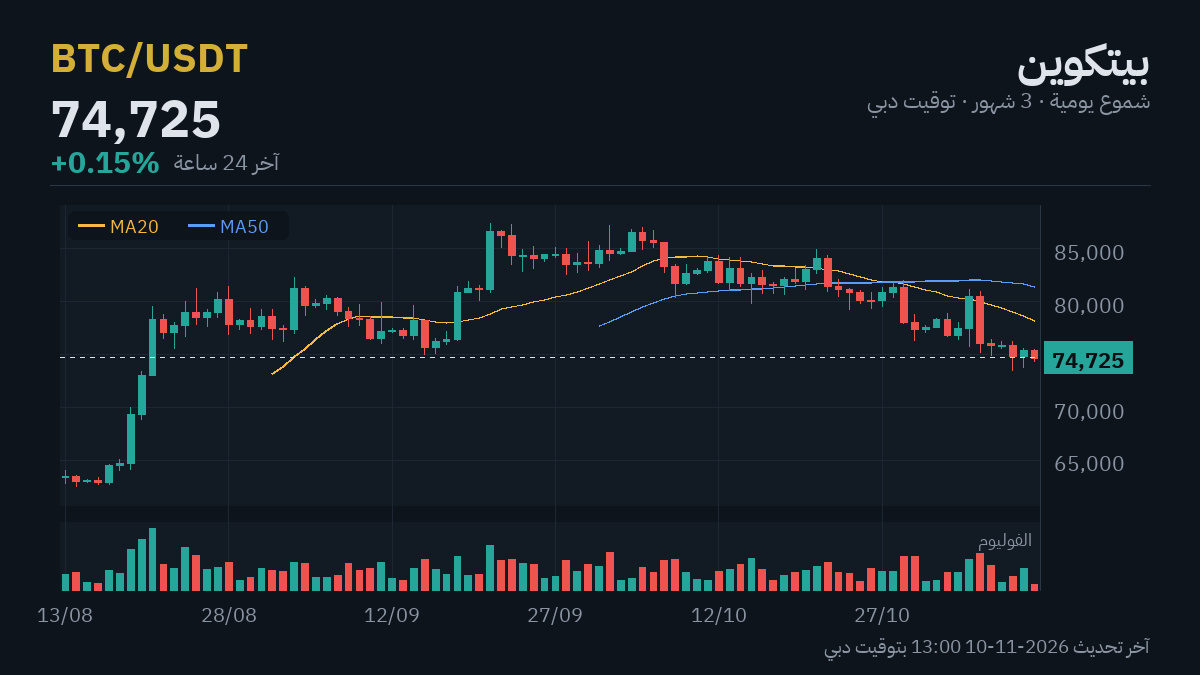
$BTC At $74,725 (+0.2%) · $ETH At $2,118 (-0.2%)
The market is volatile, and the question that keeps coming up is: should we wait, or has the picture become clearer?
The first line of defense is at $74,213, and the second is at $73,057. Overhead, we have $76,062, followed by $76,755.
As long as we're below the falling average, caution is the default.
What would change my mind: a drop below $73,057 and staying there.
If you're planning to get into Bitcoin, scaling in protects you:
1- First entry if it comes back to $72,483
2- Second at $70,241
3- Third at $68,000
If it closes below $65,758, the plan has failed and you exit. Your loss would then be around 6% of the amount, not all of it.
The distance between entries is 3% because that's Bitcoin's average daily move over the last 14 days.
Do your own research (DYOR) — this is a risk-management approach, not a recommendation.
Do you agree with this analysis, or do you see something else?
💛 Join Abu Malak's team: sign up on Binance with code ABOMALAK — get a permanent discount on trading fees and access to our services and offers.
#CryptoNews #العملات_الرقمية #Binance
⚠️ Educational content for informational purposes — not investment advice. Your decisions are your responsibility.
$BTC At $74,725 (+0.2%) · $ETH At $2,118 (-0.2%)
The market is volatile, and the question that keeps coming up is: should we wait, or has the picture become clearer?
The first line of defense is at $74,213, and the second is at $73,057. Overhead, we have $76,062, followed by $76,755.
As long as we're below the falling average, caution is the default.
What would change my mind: a drop below $73,057 and staying there.
If you're planning to get into Bitcoin, scaling in protects you:
1- First entry if it comes back to $72,483
2- Second at $70,241
3- Third at $68,000
If it closes below $65,758, the plan has failed and you exit. Your loss would then be around 6% of the amount, not all of it.
The distance between entries is 3% because that's Bitcoin's average daily move over the last 14 days.
Do your own research (DYOR) — this is a risk-management approach, not a recommendation.
Do you agree with this analysis, or do you see something else?
💛 Join Abu Malak's team: sign up on Binance with code ABOMALAK — get a permanent discount on trading fees and access to our services and offers.
#CryptoNews #العملات_الرقمية #Binance
⚠️ Educational content for informational purposes — not investment advice. Your decisions are your responsibility.
The market is volatile, and the question that keeps coming up is: should we wait, or has the picture become clearer?
The first line of defense is at $74,213, and the second is at $73,057. Overhead, we have $76,062, followed by $76,755.
As long as we're below the falling average, caution is the default.
What would change my mind: a drop below $73,057 and staying there.
If you're planning to get into Bitcoin, scaling in protects you:
1- First entry if it comes back to $72,483
2- Second at $70,241
3- Third at $68,000
If it closes below $65,758, the plan has failed and you exit. Your loss would then be around 6% of the amount, not all of it.
The distance between entries is 3% because that's Bitcoin's average daily move over the last 14 days.
Do your own research (DYOR) — this is a risk-management approach, not a recommendation.
Do you agree with this analysis, or do you see something else?
💛 Join Abu Malak's team: sign up on Binance with code ABOMALAK — get a permanent discount on trading fees and access to our services and offers.
#CryptoNews #العملات_الرقمية #Binance
⚠️ Educational content for informational purposes — not investment advice. Your decisions are your responsibility.
1
764
·
--
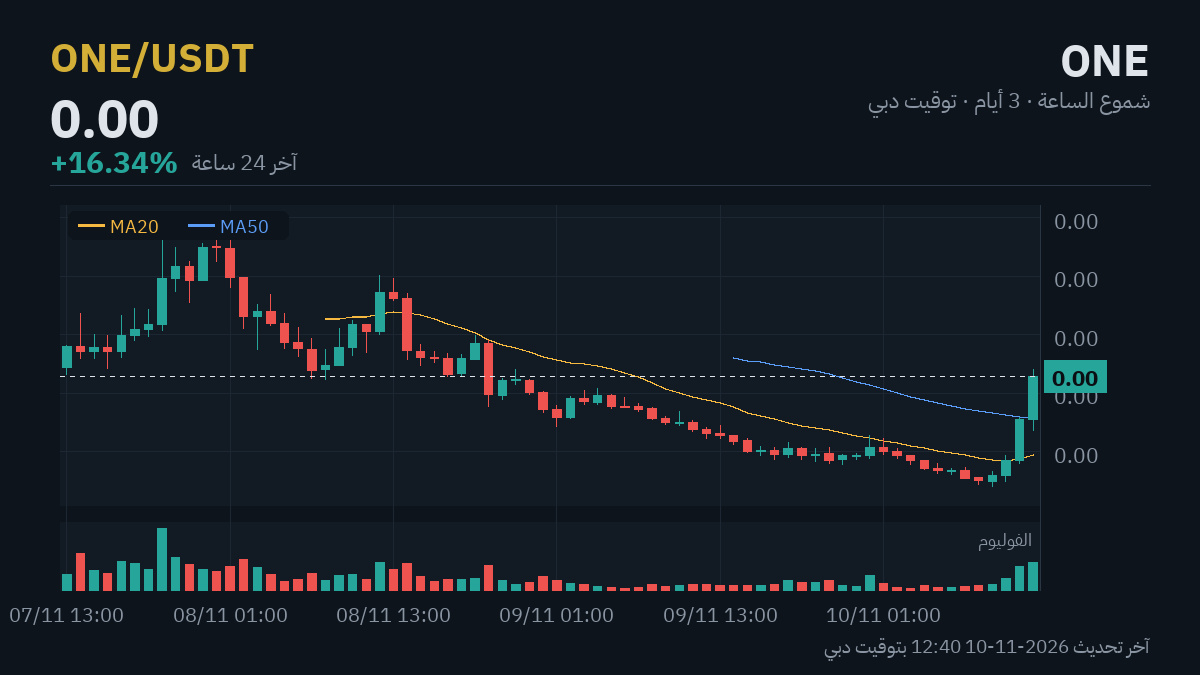
🚀 Pump watch: $ONE up +32.9% in 4 hours
Momentum strength: 83/100
✅ $11M liquidity | ✅ Holding 98% of its peak | ✅ Volume is backing the move
▪️ Current price: $0.001823
▪️ 24-hour change: +16.5%
📊 Key levels guiding the move:
▪️ Holding above $0.001347 = the move is still intact
▪️ Breaking above $0.001672 = the door remains open for continuation
▪️ Falling back below $0.0013714861 (the start of the wave) = consider the move over
📊 Tracking the #ONE move
The coin made a notable jump of +32.9% in 4 hours, with liquidity reaching $11 million and the current price at $0.001823.
Continuation scenario: If the price can hold above the $0.001672 area and stabilize there, that signals buying momentum is still present and opens the door for the upward move to continue.
End scenario: If there is a clear break and drop below the $0.001347 support area, along with weakening liquidity, that indicates the upward wave is starting to lose strength and raises the likelihood of a correction.
Monitoring the move and how it develops is essential before drawing any final conclusions. Highly volatile asset markets require extreme caution and continuous monitoring.
If you’re planning to enter after a rise like this, scaling in protects you from putting everything in at the top:
1- First entry if it returns to $0.0017101215
2- Second at $0.001597243
3- Third at $0.0014843645
If it closes below $0.0013714861, the plan has failed and you should exit. Your loss then would be around 14% of the amount, not the whole thing.
The exit level is the start of the wave mentioned above — below it, the move is considered over.
Do your own research (DYOR) — this is a risk-management approach, not a recommendation.
Will the move continue, or is this the top? The chart is in front of you 👇 $ONE
⚠️ These pump moves can swing violently in both directions — entering late is riskier than missing out.
📉 The market around it: $BTC moved +0.4% over the same hours.
#ONE #Altcoins #cryptocurrency
⚠️ Educational content for monitoring purposes — not investment advice. The decision is your responsibility.
🚀 Pump watch: $ONE up +32.9% in 4 hours
Momentum strength: 83/100
✅ $11M liquidity | ✅ Holding 98% of its peak | ✅ Volume is backing the move
▪️ Current price: $0.001823
▪️ 24-hour change: +16.5%
📊 Key levels guiding the move:
▪️ Holding above $0.001347 = the move is still intact
▪️ Breaking above $0.001672 = the door remains open for continuation
▪️ Falling back below $0.0013714861 (the start of the wave) = consider the move over
📊 Tracking the #ONE move
The coin made a notable jump of +32.9% in 4 hours, with liquidity reaching $11 million and the current price at $0.001823.
Continuation scenario: If the price can hold above the $0.001672 area and stabilize there, that signals buying momentum is still present and opens the door for the upward move to continue.
End scenario: If there is a clear break and drop below the $0.001347 support area, along with weakening liquidity, that indicates the upward wave is starting to lose strength and raises the likelihood of a correction.
Monitoring the move and how it develops is essential before drawing any final conclusions. Highly volatile asset markets require extreme caution and continuous monitoring.
If you’re planning to enter after a rise like this, scaling in protects you from putting everything in at the top:
1- First entry if it returns to $0.0017101215
2- Second at $0.001597243
3- Third at $0.0014843645
If it closes below $0.0013714861, the plan has failed and you should exit. Your loss then would be around 14% of the amount, not the whole thing.
The exit level is the start of the wave mentioned above — below it, the move is considered over.
Do your own research (DYOR) — this is a risk-management approach, not a recommendation.
Will the move continue, or is this the top? The chart is in front of you 👇 $ONE
⚠️ These pump moves can swing violently in both directions — entering late is riskier than missing out.
📉 The market around it: $BTC moved +0.4% over the same hours.
#ONE #Altcoins #cryptocurrency
⚠️ Educational content for monitoring purposes — not investment advice. The decision is your responsibility.
Momentum strength: 83/100
✅ $11M liquidity | ✅ Holding 98% of its peak | ✅ Volume is backing the move
▪️ Current price: $0.001823
▪️ 24-hour change: +16.5%
📊 Key levels guiding the move:
▪️ Holding above $0.001347 = the move is still intact
▪️ Breaking above $0.001672 = the door remains open for continuation
▪️ Falling back below $0.0013714861 (the start of the wave) = consider the move over
📊 Tracking the #ONE move
The coin made a notable jump of +32.9% in 4 hours, with liquidity reaching $11 million and the current price at $0.001823.
Continuation scenario: If the price can hold above the $0.001672 area and stabilize there, that signals buying momentum is still present and opens the door for the upward move to continue.
End scenario: If there is a clear break and drop below the $0.001347 support area, along with weakening liquidity, that indicates the upward wave is starting to lose strength and raises the likelihood of a correction.
Monitoring the move and how it develops is essential before drawing any final conclusions. Highly volatile asset markets require extreme caution and continuous monitoring.
If you’re planning to enter after a rise like this, scaling in protects you from putting everything in at the top:
1- First entry if it returns to $0.0017101215
2- Second at $0.001597243
3- Third at $0.0014843645
If it closes below $0.0013714861, the plan has failed and you should exit. Your loss then would be around 14% of the amount, not the whole thing.
The exit level is the start of the wave mentioned above — below it, the move is considered over.
Do your own research (DYOR) — this is a risk-management approach, not a recommendation.
Will the move continue, or is this the top? The chart is in front of you 👇 $ONE
⚠️ These pump moves can swing violently in both directions — entering late is riskier than missing out.
📉 The market around it: $BTC moved +0.4% over the same hours.
#ONE #Altcoins #cryptocurrency
⚠️ Educational content for monitoring purposes — not investment advice. The decision is your responsibility.
1.4k
·
--
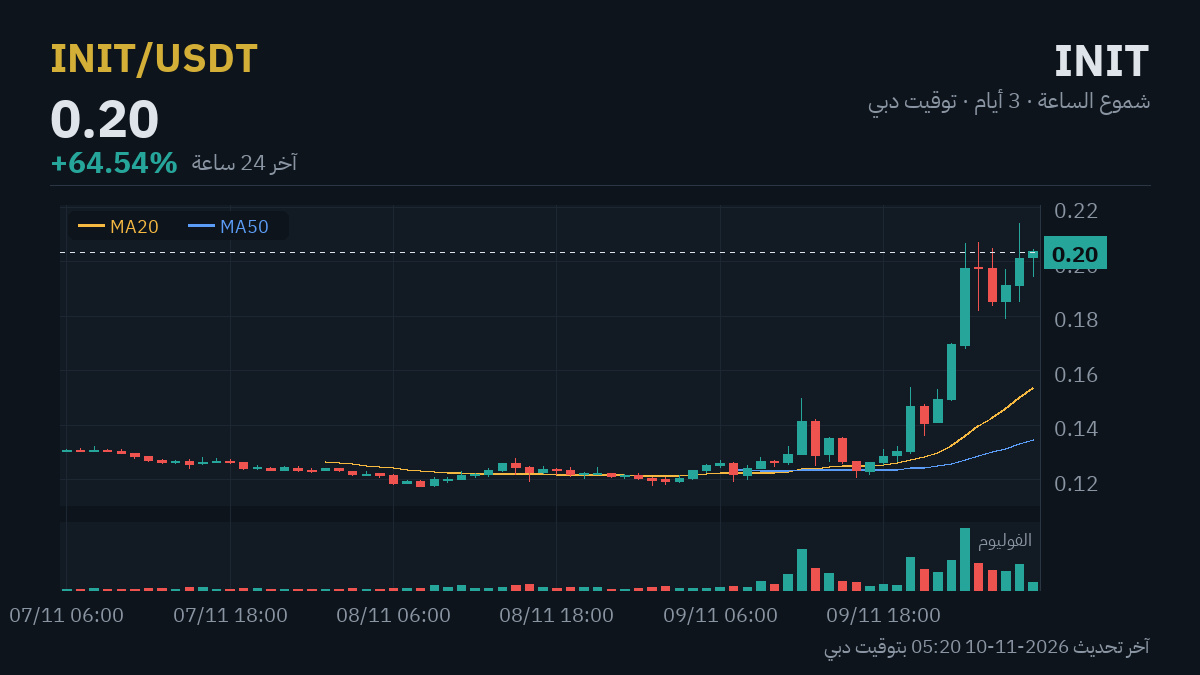
🚀 Pump watch: $INIT up +64.5% in 24 hours
Move strength: 65/100
✅ $13M liquidity | ✅ Holding 95% of its peak | ✅ Volume backing the move
▪️ Current price: $0.20347
📊 Key levels to watch:
▪️ Holding above $0.138027 = the move is still intact
▪️ Breaking above $0.225627 = the door is open for further gains
▪️ Dropping below $0.123655 (the start of the wave) = consider it over
INIT is posting a strong +64.5% gain over 24 hours, backed by liquidity of $13 million, with the price currently at $0.20347.
Scenario one: The continuation of bullish momentum depends on the price firmly breaking through the nearby resistance at $0.225627 while trading volume remains strong. This could open the way for another upward wave.
Scenario two: If the price fails to break through resistance and starts falling below support at $0.138027, that would signal weakening momentum and could mean the move is entering a correction or consolidation phase after the sharp jump.
Watching liquidity and volume over the coming hours should clarify which scenario is more likely.
If you're planning to enter after a rally like this, buying in stages can help protect you from putting everything in at the top:
1- First tranche if it pulls back to $0.183516
2- Second at $0.163563
3- Third at $0.143609
If it closes below $0.123655, the plan has failed and you should exit. Your loss would then be around 24% of the amount, not the whole thing.
The exit level is the start of the wave above — below it, the move is considered over.
Do your own research (DYOR) — this is a risk management approach, not a recommendation.
Will the move continue, or is this the top? The chart is right in front of you 👇 $INIT
⚠️ These pump moves can be violent in either direction — chasing them late is riskier than missing out.
📉 The broader market is around $BTC moving +0.1% over the same hours.
#INIT #Altcoins #Crypto
⚠️ Educational content for monitoring purposes — not investment advice. You're responsible for your own decisions.
🚀 Pump watch: $INIT up +64.5% in 24 hours
Move strength: 65/100
✅ $13M liquidity | ✅ Holding 95% of its peak | ✅ Volume backing the move
▪️ Current price: $0.20347
📊 Key levels to watch:
▪️ Holding above $0.138027 = the move is still intact
▪️ Breaking above $0.225627 = the door is open for further gains
▪️ Dropping below $0.123655 (the start of the wave) = consider it over
INIT is posting a strong +64.5% gain over 24 hours, backed by liquidity of $13 million, with the price currently at $0.20347.
Scenario one: The continuation of bullish momentum depends on the price firmly breaking through the nearby resistance at $0.225627 while trading volume remains strong. This could open the way for another upward wave.
Scenario two: If the price fails to break through resistance and starts falling below support at $0.138027, that would signal weakening momentum and could mean the move is entering a correction or consolidation phase after the sharp jump.
Watching liquidity and volume over the coming hours should clarify which scenario is more likely.
If you're planning to enter after a rally like this, buying in stages can help protect you from putting everything in at the top:
1- First tranche if it pulls back to $0.183516
2- Second at $0.163563
3- Third at $0.143609
If it closes below $0.123655, the plan has failed and you should exit. Your loss would then be around 24% of the amount, not the whole thing.
The exit level is the start of the wave above — below it, the move is considered over.
Do your own research (DYOR) — this is a risk management approach, not a recommendation.
Will the move continue, or is this the top? The chart is right in front of you 👇 $INIT
⚠️ These pump moves can be violent in either direction — chasing them late is riskier than missing out.
📉 The broader market is around $BTC moving +0.1% over the same hours.
#INIT #Altcoins #Crypto
⚠️ Educational content for monitoring purposes — not investment advice. You're responsible for your own decisions.
Move strength: 65/100
✅ $13M liquidity | ✅ Holding 95% of its peak | ✅ Volume backing the move
▪️ Current price: $0.20347
📊 Key levels to watch:
▪️ Holding above $0.138027 = the move is still intact
▪️ Breaking above $0.225627 = the door is open for further gains
▪️ Dropping below $0.123655 (the start of the wave) = consider it over
INIT is posting a strong +64.5% gain over 24 hours, backed by liquidity of $13 million, with the price currently at $0.20347.
Scenario one: The continuation of bullish momentum depends on the price firmly breaking through the nearby resistance at $0.225627 while trading volume remains strong. This could open the way for another upward wave.
Scenario two: If the price fails to break through resistance and starts falling below support at $0.138027, that would signal weakening momentum and could mean the move is entering a correction or consolidation phase after the sharp jump.
Watching liquidity and volume over the coming hours should clarify which scenario is more likely.
If you're planning to enter after a rally like this, buying in stages can help protect you from putting everything in at the top:
1- First tranche if it pulls back to $0.183516
2- Second at $0.163563
3- Third at $0.143609
If it closes below $0.123655, the plan has failed and you should exit. Your loss would then be around 24% of the amount, not the whole thing.
The exit level is the start of the wave above — below it, the move is considered over.
Do your own research (DYOR) — this is a risk management approach, not a recommendation.
Will the move continue, or is this the top? The chart is right in front of you 👇 $INIT
⚠️ These pump moves can be violent in either direction — chasing them late is riskier than missing out.
📉 The broader market is around $BTC moving +0.1% over the same hours.
#INIT #Altcoins #Crypto
⚠️ Educational content for monitoring purposes — not investment advice. You're responsible for your own decisions.
284
·
--
Lesson 80 of 100 — From My Market Experience
Exchange Tokens — Where Does Their Value Come From, and What’s the Hidden Risk?
Most major exchanges have their own token. The question is: where does this token get its value from?
Common sources of value:
1️⃣ Trading fee discounts when you pay with the token
2️⃣ Access to exchange events, such as new token launches
3️⃣ Burn programs: the exchange buys some of the token and burns it, reducing the supply
4️⃣ Network fees, if the exchange has its own blockchain
The hidden risk: the token’s value is tied to the fate of the exchange itself. When FTX collapsed in 2022, its FTT token fell by more than 90% in a matter of days. A large part of its sister company’s balance sheet was also made up of the same token.
How to approach them:
· Treat it as a bet on the exchange, not as an independent currency
· Don’t let an exchange token make up a large part of your portfolio while also keeping your funds on that same exchange — that doubles your concentration risk
Bottom line: An exchange token gets its value from the exchange’s discounts and services — so it’s a bet on the exchange’s fate and shouldn’t make up a large part of your portfolio.
Which point was new to you? Write its number in the comments 👇
#العملات_الرقمية #تعلم_الكريبتو #Binance
⚠️ Educational content — not investment advice
Lesson 80 of 100 — From My Market Experience
Exchange Tokens — Where Does Their Value Come From, and What’s the Hidden Risk?
Most major exchanges have their own token. The question is: where does this token get its value from?
Common sources of value:
1️⃣ Trading fee discounts when you pay with the token
2️⃣ Access to exchange events, such as new token launches
3️⃣ Burn programs: the exchange buys some of the token and burns it, reducing the supply
4️⃣ Network fees, if the exchange has its own blockchain
The hidden risk: the token’s value is tied to the fate of the exchange itself. When FTX collapsed in 2022, its FTT token fell by more than 90% in a matter of days. A large part of its sister company’s balance sheet was also made up of the same token.
How to approach them:
· Treat it as a bet on the exchange, not as an independent currency
· Don’t let an exchange token make up a large part of your portfolio while also keeping your funds on that same exchange — that doubles your concentration risk
Bottom line: An exchange token gets its value from the exchange’s discounts and services — so it’s a bet on the exchange’s fate and shouldn’t make up a large part of your portfolio.
Which point was new to you? Write its number in the comments 👇
#العملات_الرقمية #تعلم_الكريبتو #Binance
⚠️ Educational content — not investment advice
Exchange Tokens — Where Does Their Value Come From, and What’s the Hidden Risk?
Most major exchanges have their own token. The question is: where does this token get its value from?
Common sources of value:
1️⃣ Trading fee discounts when you pay with the token
2️⃣ Access to exchange events, such as new token launches
3️⃣ Burn programs: the exchange buys some of the token and burns it, reducing the supply
4️⃣ Network fees, if the exchange has its own blockchain
The hidden risk: the token’s value is tied to the fate of the exchange itself. When FTX collapsed in 2022, its FTT token fell by more than 90% in a matter of days. A large part of its sister company’s balance sheet was also made up of the same token.
How to approach them:
· Treat it as a bet on the exchange, not as an independent currency
· Don’t let an exchange token make up a large part of your portfolio while also keeping your funds on that same exchange — that doubles your concentration risk
Bottom line: An exchange token gets its value from the exchange’s discounts and services — so it’s a bet on the exchange’s fate and shouldn’t make up a large part of your portfolio.
Which point was new to you? Write its number in the comments 👇
#العملات_الرقمية #تعلم_الكريبتو #Binance
⚠️ Educational content — not investment advice
2
1
687
·
--
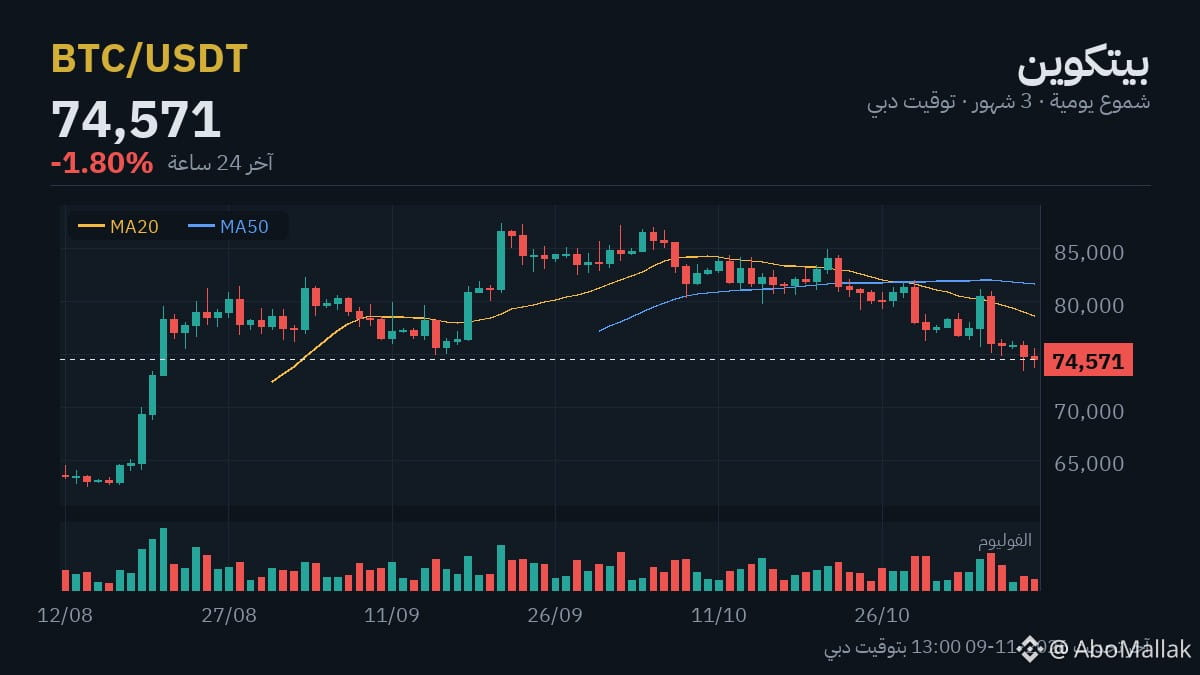
$BTC at $74,571 (-1.8%) · $ETH at $2,123 (-5.2%)
The market is volatile, and the question that keeps coming up is: should we wait, or is the picture becoming clearer?
The levels I’m watching:
Above $76,198, the way opens toward $77,544
Below $73,508, we go back to test $72,164
The price is below its average, and the average is declining. There’s no need to rush to interpret the rebound.
If $76,198 is broken on a closing basis, the outlook improves.
If you’re planning to enter Bitcoin, buying in stages can protect you:
1- First tranche if it returns to $72,334
2- Second at $70,097
3- Third at $67,860
If it closes below $65,623, the plan has failed and you exit. At that point, your loss would be around 6% of the amount, not all of it.
The spacing between tranches is 3% because that’s Bitcoin’s average daily move over the last 14 days.
Do your own research (DYOR) — this is a risk-management approach, not a recommendation.
Where do you think the market is headed? Share your opinion.
💛 Join Abu Malak’s team: Sign up on Binance with code ABOMALAK — get a permanent discount on trading fees and access to our services and offers.
#CryptoNews #العملات_الرقمية #Binance
⚠️ Educational content for informational purposes — not investment advice. You are responsible for your own decisions.
$BTC at $74,571 (-1.8%) · $ETH at $2,123 (-5.2%)
The market is volatile, and the question that keeps coming up is: should we wait, or is the picture becoming clearer?
The levels I’m watching:
Above $76,198, the way opens toward $77,544
Below $73,508, we go back to test $72,164
The price is below its average, and the average is declining. There’s no need to rush to interpret the rebound.
If $76,198 is broken on a closing basis, the outlook improves.
If you’re planning to enter Bitcoin, buying in stages can protect you:
1- First tranche if it returns to $72,334
2- Second at $70,097
3- Third at $67,860
If it closes below $65,623, the plan has failed and you exit. At that point, your loss would be around 6% of the amount, not all of it.
The spacing between tranches is 3% because that’s Bitcoin’s average daily move over the last 14 days.
Do your own research (DYOR) — this is a risk-management approach, not a recommendation.
Where do you think the market is headed? Share your opinion.
💛 Join Abu Malak’s team: Sign up on Binance with code ABOMALAK — get a permanent discount on trading fees and access to our services and offers.
#CryptoNews #العملات_الرقمية #Binance
⚠️ Educational content for informational purposes — not investment advice. You are responsible for your own decisions.
The market is volatile, and the question that keeps coming up is: should we wait, or is the picture becoming clearer?
The levels I’m watching:
Above $76,198, the way opens toward $77,544
Below $73,508, we go back to test $72,164
The price is below its average, and the average is declining. There’s no need to rush to interpret the rebound.
If $76,198 is broken on a closing basis, the outlook improves.
If you’re planning to enter Bitcoin, buying in stages can protect you:
1- First tranche if it returns to $72,334
2- Second at $70,097
3- Third at $67,860
If it closes below $65,623, the plan has failed and you exit. At that point, your loss would be around 6% of the amount, not all of it.
The spacing between tranches is 3% because that’s Bitcoin’s average daily move over the last 14 days.
Do your own research (DYOR) — this is a risk-management approach, not a recommendation.
Where do you think the market is headed? Share your opinion.
💛 Join Abu Malak’s team: Sign up on Binance with code ABOMALAK — get a permanent discount on trading fees and access to our services and offers.
#CryptoNews #العملات_الرقمية #Binance
⚠️ Educational content for informational purposes — not investment advice. You are responsible for your own decisions.
306
·
--
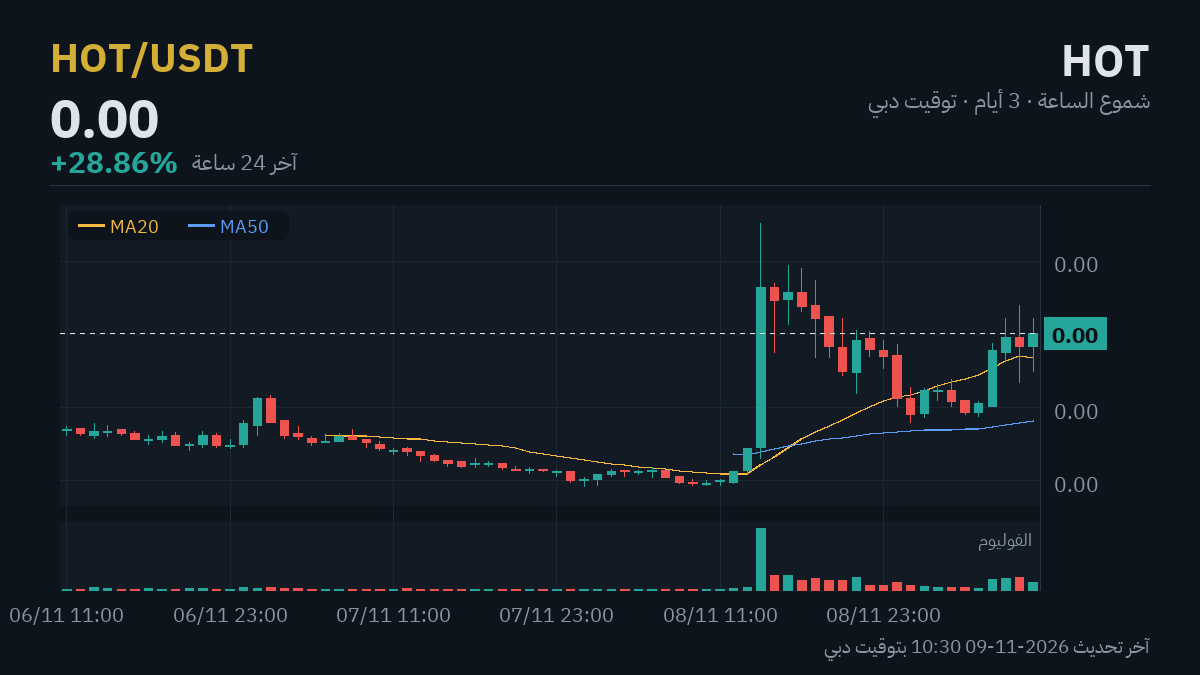
🚀 Pump watch: $HOT up +28.9% in 24 hours
Move strength: 77/100
✅ $10M liquidity | ✅ Holding 95% of its peak | ✅ Volume is confirming
▪️ Current price: $0.000451
📊 Key levels driving the move:
▪️ Holding above $0.0003306667 = the move is still intact
▪️ Breaking above $0.0005096667 = the door is open for continuation
▪️ Falling back below $0.0003500004 (the start of the wave) = consider it over
HOT coin is up +28.9% in 24 hours, with trading liquidity reaching $10 million and the price currently at $0.000451.
Scenario 1: If the price manages to break the $0.0005096667 resistance and hold above it with strong trading volume, the uptrend could continue and open the way for a new wave.
Scenario 2: If it fails to break resistance and starts falling below support at $0.0003306667, that would signal that momentum is weakening and the move could enter a correction phase.
Monitoring liquidity flows and price behavior around these two levels will determine the next direction, with no guarantees of any particular outcome.
If you’re planning to enter after a rally like this, buying in increments can protect you from putting everything in at the top:
1- First entry if it pulls back to $0.0004257501
2- Second at $0.0004005002
3- Third at $0.0003752503
If it closes below $0.0003500004, the plan has failed and you exit. At that point, your loss would be around 12% of the amount, not all of it.
The exit level is the start of the wave mentioned above — below it, the move is considered over.
Do your own research (DYOR) — this is a risk-management approach, not a recommendation.
Will the move continue, or is this the peak? The chart is in front of you 👇 $HOT
⚠️ These pump moves can swing violently in both directions — chasing late is riskier than missing out.
📉 The broader market is $BTC down -2.0% over the same hours.
#HOT #Altcoins #Crypto
⚠️ Educational content for monitoring purposes — not investment advice; you are responsible for your own decisions.
🚀 Pump watch: $HOT up +28.9% in 24 hours
Move strength: 77/100
✅ $10M liquidity | ✅ Holding 95% of its peak | ✅ Volume is confirming
▪️ Current price: $0.000451
📊 Key levels driving the move:
▪️ Holding above $0.0003306667 = the move is still intact
▪️ Breaking above $0.0005096667 = the door is open for continuation
▪️ Falling back below $0.0003500004 (the start of the wave) = consider it over
HOT coin is up +28.9% in 24 hours, with trading liquidity reaching $10 million and the price currently at $0.000451.
Scenario 1: If the price manages to break the $0.0005096667 resistance and hold above it with strong trading volume, the uptrend could continue and open the way for a new wave.
Scenario 2: If it fails to break resistance and starts falling below support at $0.0003306667, that would signal that momentum is weakening and the move could enter a correction phase.
Monitoring liquidity flows and price behavior around these two levels will determine the next direction, with no guarantees of any particular outcome.
If you’re planning to enter after a rally like this, buying in increments can protect you from putting everything in at the top:
1- First entry if it pulls back to $0.0004257501
2- Second at $0.0004005002
3- Third at $0.0003752503
If it closes below $0.0003500004, the plan has failed and you exit. At that point, your loss would be around 12% of the amount, not all of it.
The exit level is the start of the wave mentioned above — below it, the move is considered over.
Do your own research (DYOR) — this is a risk-management approach, not a recommendation.
Will the move continue, or is this the peak? The chart is in front of you 👇 $HOT
⚠️ These pump moves can swing violently in both directions — chasing late is riskier than missing out.
📉 The broader market is $BTC down -2.0% over the same hours.
#HOT #Altcoins #Crypto
⚠️ Educational content for monitoring purposes — not investment advice; you are responsible for your own decisions.
Move strength: 77/100
✅ $10M liquidity | ✅ Holding 95% of its peak | ✅ Volume is confirming
▪️ Current price: $0.000451
📊 Key levels driving the move:
▪️ Holding above $0.0003306667 = the move is still intact
▪️ Breaking above $0.0005096667 = the door is open for continuation
▪️ Falling back below $0.0003500004 (the start of the wave) = consider it over
HOT coin is up +28.9% in 24 hours, with trading liquidity reaching $10 million and the price currently at $0.000451.
Scenario 1: If the price manages to break the $0.0005096667 resistance and hold above it with strong trading volume, the uptrend could continue and open the way for a new wave.
Scenario 2: If it fails to break resistance and starts falling below support at $0.0003306667, that would signal that momentum is weakening and the move could enter a correction phase.
Monitoring liquidity flows and price behavior around these two levels will determine the next direction, with no guarantees of any particular outcome.
If you’re planning to enter after a rally like this, buying in increments can protect you from putting everything in at the top:
1- First entry if it pulls back to $0.0004257501
2- Second at $0.0004005002
3- Third at $0.0003752503
If it closes below $0.0003500004, the plan has failed and you exit. At that point, your loss would be around 12% of the amount, not all of it.
The exit level is the start of the wave mentioned above — below it, the move is considered over.
Do your own research (DYOR) — this is a risk-management approach, not a recommendation.
Will the move continue, or is this the peak? The chart is in front of you 👇 $HOT
⚠️ These pump moves can swing violently in both directions — chasing late is riskier than missing out.
📉 The broader market is $BTC down -2.0% over the same hours.
#HOT #Altcoins #Crypto
⚠️ Educational content for monitoring purposes — not investment advice; you are responsible for your own decisions.
1
1
1.8k
·
--
🚀 Pump watch: $BMT up +13.3% in 24 hours
Move strength: 73/100
✅ $15M liquidity | ✅ Holding 98% of its peak | ✅ Volume is keeping pace
▪️ Current price: $0.0256
📊 Key levels guiding the move:
▪️ Holding above $0.022513 = the move is still intact
▪️ Breaking above $0.027583 = the door is open to further gains
▪️ Falling back below $0.02259 (the start of the wave) = consider it over
BMT is up +13.3% in just 24 hours, trading at $0.0256 with around $15M in trading liquidity, leaving two possible scenarios.
Scenario one: If the price can break above $0.027583 and hold there, with supportive trading volume, that would signal that the upward momentum could continue and open the door to testing higher levels.
Scenario two: If the price turns down and loses the $0.022513 area, that would be a clear sign of weakness, suggesting the upward move is losing momentum and could enter a correction phase.
Watching price action around these two levels will clarify the next direction.
If you're planning to enter after a rally like this, buying in installments can protect you from putting everything in at the top:
1- First installment if it returns to $0.024848
2- Second at $0.024095
3- Third at $0.023343
If it closes below $0.02259, the plan has failed and you should exit. Your loss then would be around 6% of the amount, not the whole thing.
The exit level is the start of the wave above — below it, the move is considered over.
Do your own research (DYOR) — this is a risk-management approach, not a recommendation.
Will the move continue, or is this the top? The chart is in front of you 👇 $BMT
⚠️ These pump moves can swing violently in both directions — entering late is riskier than missing out.
📉 The broader market: $BTC is down -1.2% over the same hours.
#BMT #Altcoins #CryptoCurrencies
⚠️ Educational content for informational purposes — not investment advice. The decision is your responsibility.
🚀 Pump watch: $BMT up +13.3% in 24 hours
Move strength: 73/100
✅ $15M liquidity | ✅ Holding 98% of its peak | ✅ Volume is keeping pace
▪️ Current price: $0.0256
📊 Key levels guiding the move:
▪️ Holding above $0.022513 = the move is still intact
▪️ Breaking above $0.027583 = the door is open to further gains
▪️ Falling back below $0.02259 (the start of the wave) = consider it over
BMT is up +13.3% in just 24 hours, trading at $0.0256 with around $15M in trading liquidity, leaving two possible scenarios.
Scenario one: If the price can break above $0.027583 and hold there, with supportive trading volume, that would signal that the upward momentum could continue and open the door to testing higher levels.
Scenario two: If the price turns down and loses the $0.022513 area, that would be a clear sign of weakness, suggesting the upward move is losing momentum and could enter a correction phase.
Watching price action around these two levels will clarify the next direction.
If you're planning to enter after a rally like this, buying in installments can protect you from putting everything in at the top:
1- First installment if it returns to $0.024848
2- Second at $0.024095
3- Third at $0.023343
If it closes below $0.02259, the plan has failed and you should exit. Your loss then would be around 6% of the amount, not the whole thing.
The exit level is the start of the wave above — below it, the move is considered over.
Do your own research (DYOR) — this is a risk-management approach, not a recommendation.
Will the move continue, or is this the top? The chart is in front of you 👇 $BMT
⚠️ These pump moves can swing violently in both directions — entering late is riskier than missing out.
📉 The broader market: $BTC is down -1.2% over the same hours.
#BMT #Altcoins #CryptoCurrencies
⚠️ Educational content for informational purposes — not investment advice. The decision is your responsibility.
Move strength: 73/100
✅ $15M liquidity | ✅ Holding 98% of its peak | ✅ Volume is keeping pace
▪️ Current price: $0.0256
📊 Key levels guiding the move:
▪️ Holding above $0.022513 = the move is still intact
▪️ Breaking above $0.027583 = the door is open to further gains
▪️ Falling back below $0.02259 (the start of the wave) = consider it over
BMT is up +13.3% in just 24 hours, trading at $0.0256 with around $15M in trading liquidity, leaving two possible scenarios.
Scenario one: If the price can break above $0.027583 and hold there, with supportive trading volume, that would signal that the upward momentum could continue and open the door to testing higher levels.
Scenario two: If the price turns down and loses the $0.022513 area, that would be a clear sign of weakness, suggesting the upward move is losing momentum and could enter a correction phase.
Watching price action around these two levels will clarify the next direction.
If you're planning to enter after a rally like this, buying in installments can protect you from putting everything in at the top:
1- First installment if it returns to $0.024848
2- Second at $0.024095
3- Third at $0.023343
If it closes below $0.02259, the plan has failed and you should exit. Your loss then would be around 6% of the amount, not the whole thing.
The exit level is the start of the wave above — below it, the move is considered over.
Do your own research (DYOR) — this is a risk-management approach, not a recommendation.
Will the move continue, or is this the top? The chart is in front of you 👇 $BMT
⚠️ These pump moves can swing violently in both directions — entering late is riskier than missing out.
📉 The broader market: $BTC is down -1.2% over the same hours.
#BMT #Altcoins #CryptoCurrencies
⚠️ Educational content for informational purposes — not investment advice. The decision is your responsibility.
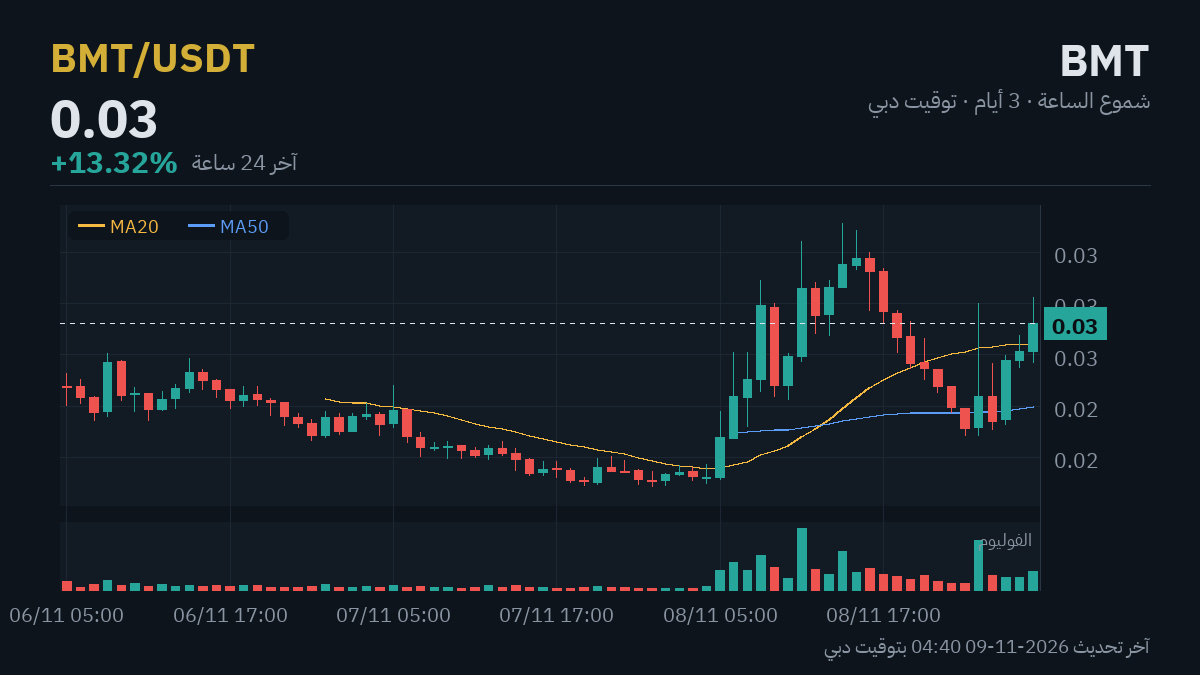
2
1
693
·
--
Lesson 79 of 100 — From My Experience in the Market
Meme coins — why do they skyrocket, and why do most of them disappear?
A coin created as a joke or inspired by a dog picture, with no product or plan — and it multiplies in value in just a few days. That’s the world of meme coins.
Why do they rise like that?
1️⃣ Their entire value comes from attention: the more people talk about them, the higher the demand
2️⃣ A very low price per coin makes it feel “cheap,” even if its market cap is huge
3️⃣ Stories about people making huge gains spread — but nobody talks about the people who lost everything
Why do most of them disappear?
· There’s no real use to support the price once attention shifts to a new coin
· Early holders often own a huge amount and sell to latecomers
· Thousands of new coins launch every day — the competition for attention never ends
In other words: meme coins are speculation on attention — not an investment. Anyone getting involved should understand that they could lose the entire amount.
Bottom line: meme coins are pure speculation on attention, with no real use to support their price — and most disappear when attention moves elsewhere.
Which point was new to you? Write its number in the comments 👇
#العملات_الرقمية #تعلم_الكريبتو #Binance
⚠️ Educational content — not investment advice
Lesson 79 of 100 — From My Experience in the Market
Meme coins — why do they skyrocket, and why do most of them disappear?
A coin created as a joke or inspired by a dog picture, with no product or plan — and it multiplies in value in just a few days. That’s the world of meme coins.
Why do they rise like that?
1️⃣ Their entire value comes from attention: the more people talk about them, the higher the demand
2️⃣ A very low price per coin makes it feel “cheap,” even if its market cap is huge
3️⃣ Stories about people making huge gains spread — but nobody talks about the people who lost everything
Why do most of them disappear?
· There’s no real use to support the price once attention shifts to a new coin
· Early holders often own a huge amount and sell to latecomers
· Thousands of new coins launch every day — the competition for attention never ends
In other words: meme coins are speculation on attention — not an investment. Anyone getting involved should understand that they could lose the entire amount.
Bottom line: meme coins are pure speculation on attention, with no real use to support their price — and most disappear when attention moves elsewhere.
Which point was new to you? Write its number in the comments 👇
#العملات_الرقمية #تعلم_الكريبتو #Binance
⚠️ Educational content — not investment advice
Meme coins — why do they skyrocket, and why do most of them disappear?
A coin created as a joke or inspired by a dog picture, with no product or plan — and it multiplies in value in just a few days. That’s the world of meme coins.
Why do they rise like that?
1️⃣ Their entire value comes from attention: the more people talk about them, the higher the demand
2️⃣ A very low price per coin makes it feel “cheap,” even if its market cap is huge
3️⃣ Stories about people making huge gains spread — but nobody talks about the people who lost everything
Why do most of them disappear?
· There’s no real use to support the price once attention shifts to a new coin
· Early holders often own a huge amount and sell to latecomers
· Thousands of new coins launch every day — the competition for attention never ends
In other words: meme coins are speculation on attention — not an investment. Anyone getting involved should understand that they could lose the entire amount.
Bottom line: meme coins are pure speculation on attention, with no real use to support their price — and most disappear when attention moves elsewhere.
Which point was new to you? Write its number in the comments 👇
#العملات_الرقمية #تعلم_الكريبتو #Binance
⚠️ Educational content — not investment advice
4
1.2k
·
--
$BTC at $75,942 (-0.3%) · $ETH at $2,239 (-0.5%)
The market is volatile, and the question that keeps coming up is whether to wait or whether the picture has become clear.
Resistance: $76,221, then $76,575
Support: $75,542, then $75,217
As long as we’re below the declining average, caution is the default.
The signal that would show this analysis is wrong is a break below $75,542 with volume.
If you’re planning to buy Bitcoin, entering in installments can protect you:
1- The first installment if it returns to $73,664
2- The second at $71,386
3- The third at $69,107
If it closes below $66,829, the plan has failed and you should exit. Your loss then would be about 6% of the amount, not all of it.
The distance between installments is 3% because that’s Bitcoin’s average daily move over the last 14 days.
Do your own research (DYOR) — this is a risk-management approach, not a recommendation.
What level are you keeping an eye on?
💛 Join Abu Malak’s team: Sign up on Binance with code ABOMALAK — a permanent discount on trading fees, plus access to our services and offers.
#CryptoNews #العملات_الرقمية #Binance
⚠️ Educational content for informational purposes only — not investment advice. You are responsible for your own decisions.
$BTC at $75,942 (-0.3%) · $ETH at $2,239 (-0.5%)
The market is volatile, and the question that keeps coming up is whether to wait or whether the picture has become clear.
Resistance: $76,221, then $76,575
Support: $75,542, then $75,217
As long as we’re below the declining average, caution is the default.
The signal that would show this analysis is wrong is a break below $75,542 with volume.
If you’re planning to buy Bitcoin, entering in installments can protect you:
1- The first installment if it returns to $73,664
2- The second at $71,386
3- The third at $69,107
If it closes below $66,829, the plan has failed and you should exit. Your loss then would be about 6% of the amount, not all of it.
The distance between installments is 3% because that’s Bitcoin’s average daily move over the last 14 days.
Do your own research (DYOR) — this is a risk-management approach, not a recommendation.
What level are you keeping an eye on?
💛 Join Abu Malak’s team: Sign up on Binance with code ABOMALAK — a permanent discount on trading fees, plus access to our services and offers.
#CryptoNews #العملات_الرقمية #Binance
⚠️ Educational content for informational purposes only — not investment advice. You are responsible for your own decisions.
The market is volatile, and the question that keeps coming up is whether to wait or whether the picture has become clear.
Resistance: $76,221, then $76,575
Support: $75,542, then $75,217
As long as we’re below the declining average, caution is the default.
The signal that would show this analysis is wrong is a break below $75,542 with volume.
If you’re planning to buy Bitcoin, entering in installments can protect you:
1- The first installment if it returns to $73,664
2- The second at $71,386
3- The third at $69,107
If it closes below $66,829, the plan has failed and you should exit. Your loss then would be about 6% of the amount, not all of it.
The distance between installments is 3% because that’s Bitcoin’s average daily move over the last 14 days.
Do your own research (DYOR) — this is a risk-management approach, not a recommendation.
What level are you keeping an eye on?
💛 Join Abu Malak’s team: Sign up on Binance with code ABOMALAK — a permanent discount on trading fees, plus access to our services and offers.
#CryptoNews #العملات_الرقمية #Binance
⚠️ Educational content for informational purposes only — not investment advice. You are responsible for your own decisions.
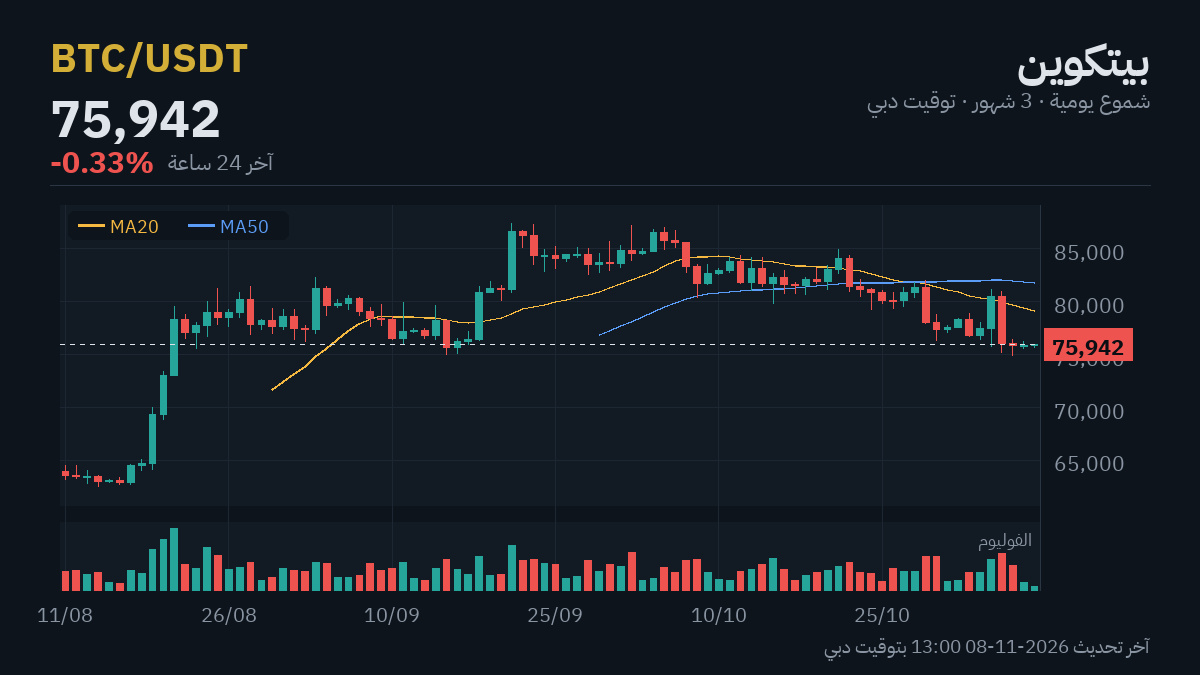
1
1.2k
·
--
Lesson 78 of 100 — From My Experience in the Market
NFTs and gaming — What was left after the 2021 boom?
In 2021, digital images sold for millions, and “play-to-earn” games attracted huge numbers of players. A year later, most of it had fallen dramatically.
NFTs, simply put: unique digital proof of ownership on the blockchain — it can represent an image, a ticket, or an in-game item.
Why the boom collapsed:
1️⃣ Many prices were driven by speculation on “someone will buy it from me for more,” not by actual use
2️⃣ Some games relied on new players paying the players who came before them — when new players stopped joining, the economy collapsed
3️⃣ Low liquidity: easy to buy, very hard to sell
What still makes sense:
· Digital tickets, memberships, and certificates
· Ownership of in-game items when the game itself is fun, rather than just a way to make money
The broader lesson: any business model whose profits depend on a constant stream of new people coming in will collapse when they stop.
Bottom line: NFTs are a digital ownership tool with real-world uses — but the 2021 boom was speculative, and any model based only on bringing in new people collapses as soon as they stop.
Which point was new to you? Write its number in the comments 👇
#العملات_الرقمية #تعلم_الكريبتو #Binance
⚠️ Educational content — not investment advice
Lesson 78 of 100 — From My Experience in the Market
NFTs and gaming — What was left after the 2021 boom?
In 2021, digital images sold for millions, and “play-to-earn” games attracted huge numbers of players. A year later, most of it had fallen dramatically.
NFTs, simply put: unique digital proof of ownership on the blockchain — it can represent an image, a ticket, or an in-game item.
Why the boom collapsed:
1️⃣ Many prices were driven by speculation on “someone will buy it from me for more,” not by actual use
2️⃣ Some games relied on new players paying the players who came before them — when new players stopped joining, the economy collapsed
3️⃣ Low liquidity: easy to buy, very hard to sell
What still makes sense:
· Digital tickets, memberships, and certificates
· Ownership of in-game items when the game itself is fun, rather than just a way to make money
The broader lesson: any business model whose profits depend on a constant stream of new people coming in will collapse when they stop.
Bottom line: NFTs are a digital ownership tool with real-world uses — but the 2021 boom was speculative, and any model based only on bringing in new people collapses as soon as they stop.
Which point was new to you? Write its number in the comments 👇
#العملات_الرقمية #تعلم_الكريبتو #Binance
⚠️ Educational content — not investment advice
NFTs and gaming — What was left after the 2021 boom?
In 2021, digital images sold for millions, and “play-to-earn” games attracted huge numbers of players. A year later, most of it had fallen dramatically.
NFTs, simply put: unique digital proof of ownership on the blockchain — it can represent an image, a ticket, or an in-game item.
Why the boom collapsed:
1️⃣ Many prices were driven by speculation on “someone will buy it from me for more,” not by actual use
2️⃣ Some games relied on new players paying the players who came before them — when new players stopped joining, the economy collapsed
3️⃣ Low liquidity: easy to buy, very hard to sell
What still makes sense:
· Digital tickets, memberships, and certificates
· Ownership of in-game items when the game itself is fun, rather than just a way to make money
The broader lesson: any business model whose profits depend on a constant stream of new people coming in will collapse when they stop.
Bottom line: NFTs are a digital ownership tool with real-world uses — but the 2021 boom was speculative, and any model based only on bringing in new people collapses as soon as they stop.
Which point was new to you? Write its number in the comments 👇
#العملات_الرقمية #تعلم_الكريبتو #Binance
⚠️ Educational content — not investment advice
2
811
·
--
$BTC at $76,195 (+0.7%) · $ETH at $2,250 (+1.1%)
The market is volatile, and the question that keeps coming up is whether to wait or whether the picture has become clearer.
To sum it up in two numbers: $75,016 below and $76,544 above. A move outside that range will determine what comes next.
The price is below its average, and the average is falling. There’s no need to rush to interpret the rebound.
What would change my mind: a drop below $74,188 and staying there.
If you’re planning to buy Bitcoin, entering in installments can protect you:
1- First installment if it returns to $73,909
2- Second at $71,623
3- Third at $69,337
If it closes below $67,052, the plan has failed and you exit. At that point, your loss would be about 6% of the amount, not all of it.
The gap between installments is 3% because that’s Bitcoin’s average daily movement over the last 14 days.
Do your own research (DYOR) — this is a risk-management approach, not a recommendation.
If you’re watching another level in the market, share it.
💛 Join Abu Malak’s team: sign up on Binance with code ABOMALAK — get a permanent discount on trading fees and access to our services and offers.
#CryptoNews #العملات_الرقمية #Binance
⚠️ Educational content for informational purposes — not investment advice. You are responsible for your own decisions.
$BTC at $76,195 (+0.7%) · $ETH at $2,250 (+1.1%)
The market is volatile, and the question that keeps coming up is whether to wait or whether the picture has become clearer.
To sum it up in two numbers: $75,016 below and $76,544 above. A move outside that range will determine what comes next.
The price is below its average, and the average is falling. There’s no need to rush to interpret the rebound.
What would change my mind: a drop below $74,188 and staying there.
If you’re planning to buy Bitcoin, entering in installments can protect you:
1- First installment if it returns to $73,909
2- Second at $71,623
3- Third at $69,337
If it closes below $67,052, the plan has failed and you exit. At that point, your loss would be about 6% of the amount, not all of it.
The gap between installments is 3% because that’s Bitcoin’s average daily movement over the last 14 days.
Do your own research (DYOR) — this is a risk-management approach, not a recommendation.
If you’re watching another level in the market, share it.
💛 Join Abu Malak’s team: sign up on Binance with code ABOMALAK — get a permanent discount on trading fees and access to our services and offers.
#CryptoNews #العملات_الرقمية #Binance
⚠️ Educational content for informational purposes — not investment advice. You are responsible for your own decisions.
The market is volatile, and the question that keeps coming up is whether to wait or whether the picture has become clearer.
To sum it up in two numbers: $75,016 below and $76,544 above. A move outside that range will determine what comes next.
The price is below its average, and the average is falling. There’s no need to rush to interpret the rebound.
What would change my mind: a drop below $74,188 and staying there.
If you’re planning to buy Bitcoin, entering in installments can protect you:
1- First installment if it returns to $73,909
2- Second at $71,623
3- Third at $69,337
If it closes below $67,052, the plan has failed and you exit. At that point, your loss would be about 6% of the amount, not all of it.
The gap between installments is 3% because that’s Bitcoin’s average daily movement over the last 14 days.
Do your own research (DYOR) — this is a risk-management approach, not a recommendation.
If you’re watching another level in the market, share it.
💛 Join Abu Malak’s team: sign up on Binance with code ABOMALAK — get a permanent discount on trading fees and access to our services and offers.
#CryptoNews #العملات_الرقمية #Binance
⚠️ Educational content for informational purposes — not investment advice. You are responsible for your own decisions.
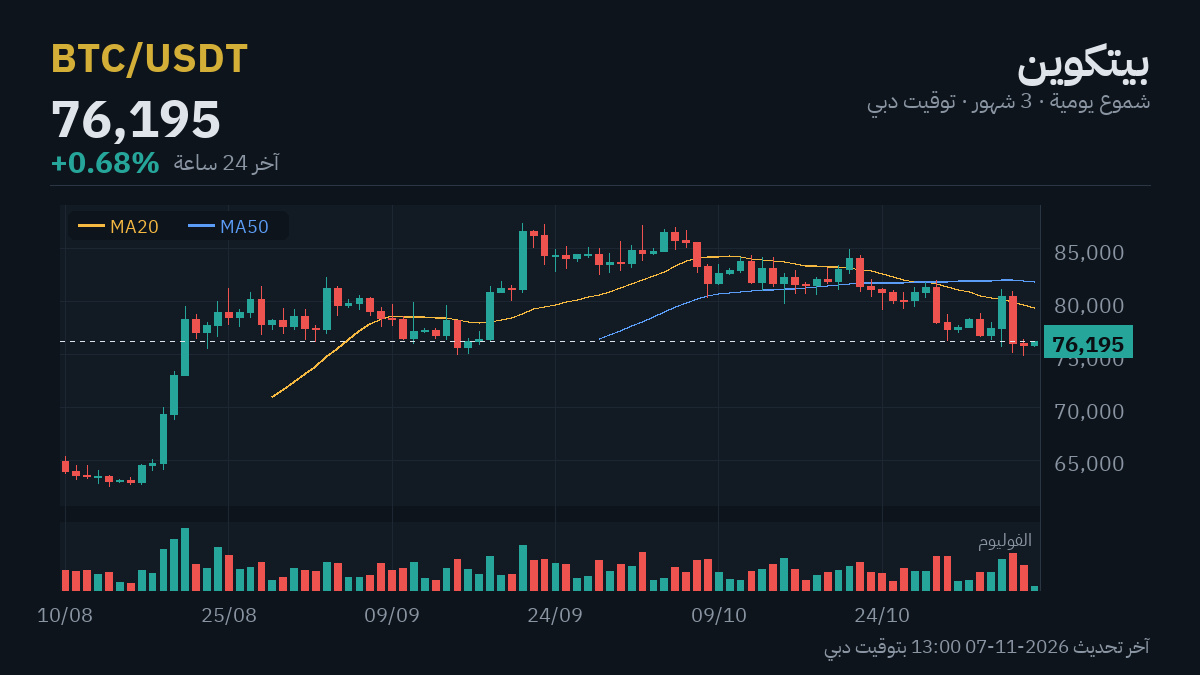
445
Log in to explore more content
Join global crypto users on Binance Square
⚡️ Get latest and useful information about crypto.
💬 Trusted by the world’s largest crypto exchange.
👍 Discover real insights from verified creators.
Email / Phone number
Trending Topics
HuangExitNvidiaStrategyInFocus
62,474 views
797 Discussing
STOCKS | Nvidia’s Jensen Huang Resigns, Colette Kress Named as Interim CEO
Binance News
·20 Likes
·30.3k views
AnthropicRejectsIPODelayValuationinQuestion
651,879 views
5,076 Discussing
BitMineReports$6.3BNetLossForFiscal2026
7,309 views
97 Discussing