

0xxinxinn
1.4k Posts

0xxinxinn
Report
Block User
推特同名 0xxinxinn ,幣安反佣邀請碼:437648564 BP-ED29A9A680E5
Frequent Trader
4.6 Years
103 Following
11.3K+ Followers
5.6K+ Liked
Posts
All
Quotes
Live
PINNED
·
--
Welcome everyone to join my Binance chat room~~
We can discuss alpha tokens, chat casually, and have fun together✌️
Welcome everyone to join my Binance chat room~~
We can discuss alpha tokens, chat casually, and have fun together✌️
We can discuss alpha tokens, chat casually, and have fun together✌️



3
1
18
3.2k
·
--
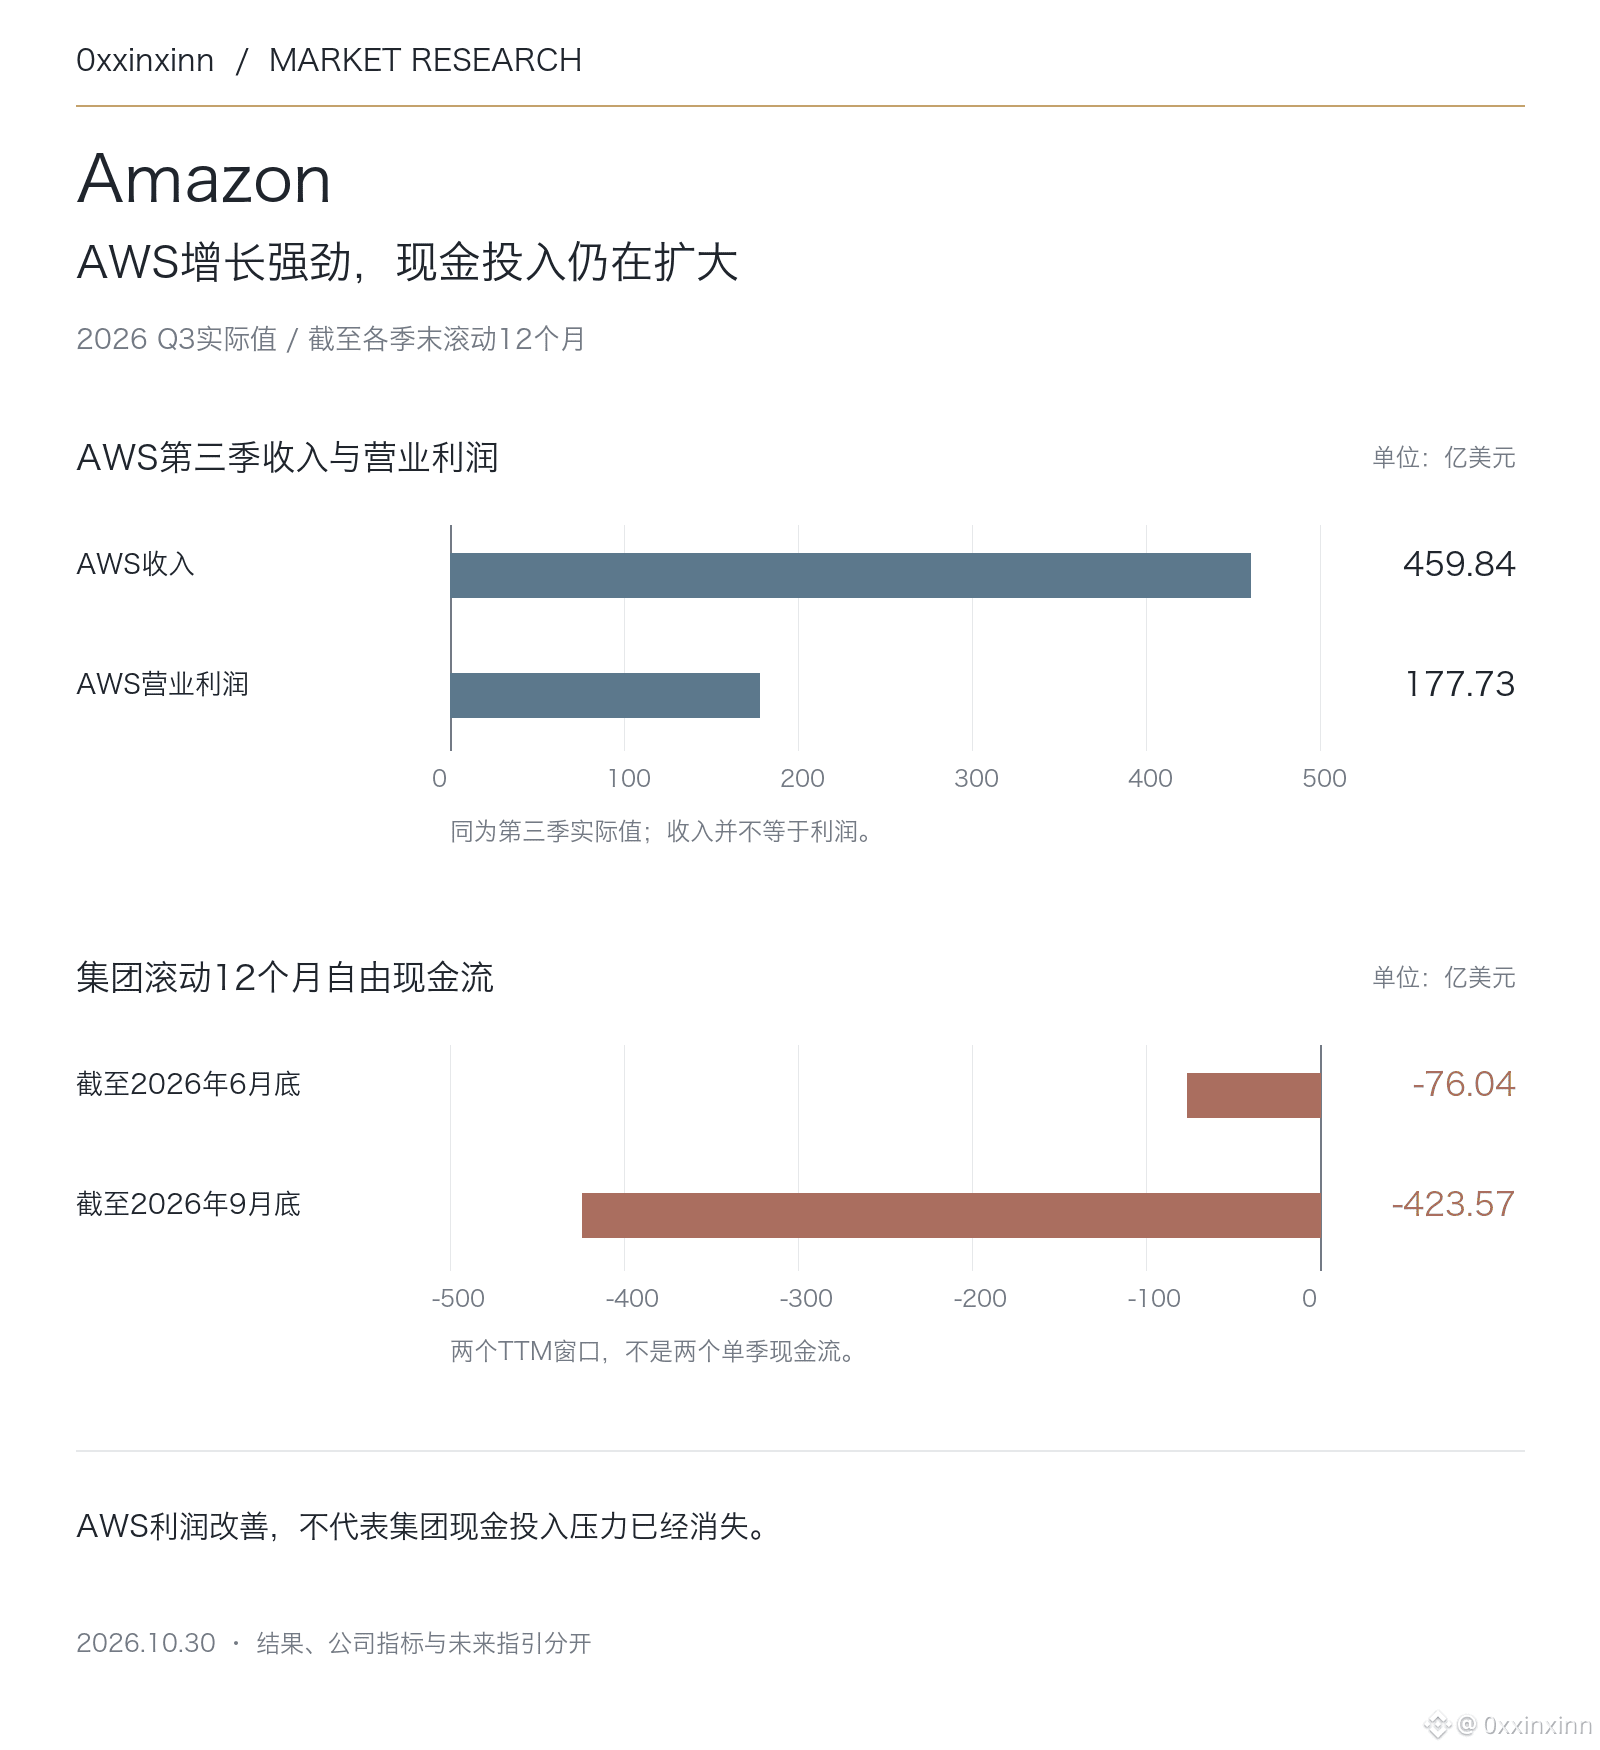
Amazon’s AWS business is growing strongly, but the group’s cash flow is moving in a different direction.
In the third quarter of 2026, AWS revenue was $45.984 billion, up 39.3% year over year, and operating income was $17.773 billion. The group’s operating margin rose to 13.9%, but free cash flow for the trailing 12 months ended September 30 was an outflow of $42.36 billion, a substantial increase from the $7.60 billion outflow for the 12 months ended June 30. These are two trailing 12-month periods—not $42.36 billion burned in the third quarter alone.
Over the same trailing 12 months, operating cash flow was $168.3 billion, while net purchases of property and equipment totaled $210.66 billion. Growth generated cash, but expansion consumed even more. Both figures need to be considered together.
The company still expects cash capital expenditures of about $220 billion in 2026, and forecasts fourth-quarter sales of $240 billion–$247 billion and operating income of $28.5 billion–$33.5 billion. These are forecasts, not actual results.
The year-over-year decline in net income was also affected by investment gains from Anthropic that boosted the year-ago comparison, so it cannot simply be attributed to a deterioration in the core business. The key going forward is whether AWS delivery and profit growth can gradually cover equipment investment—not just using cloud growth rates to explain the valuation.
1
1.6k
·
--
Verified
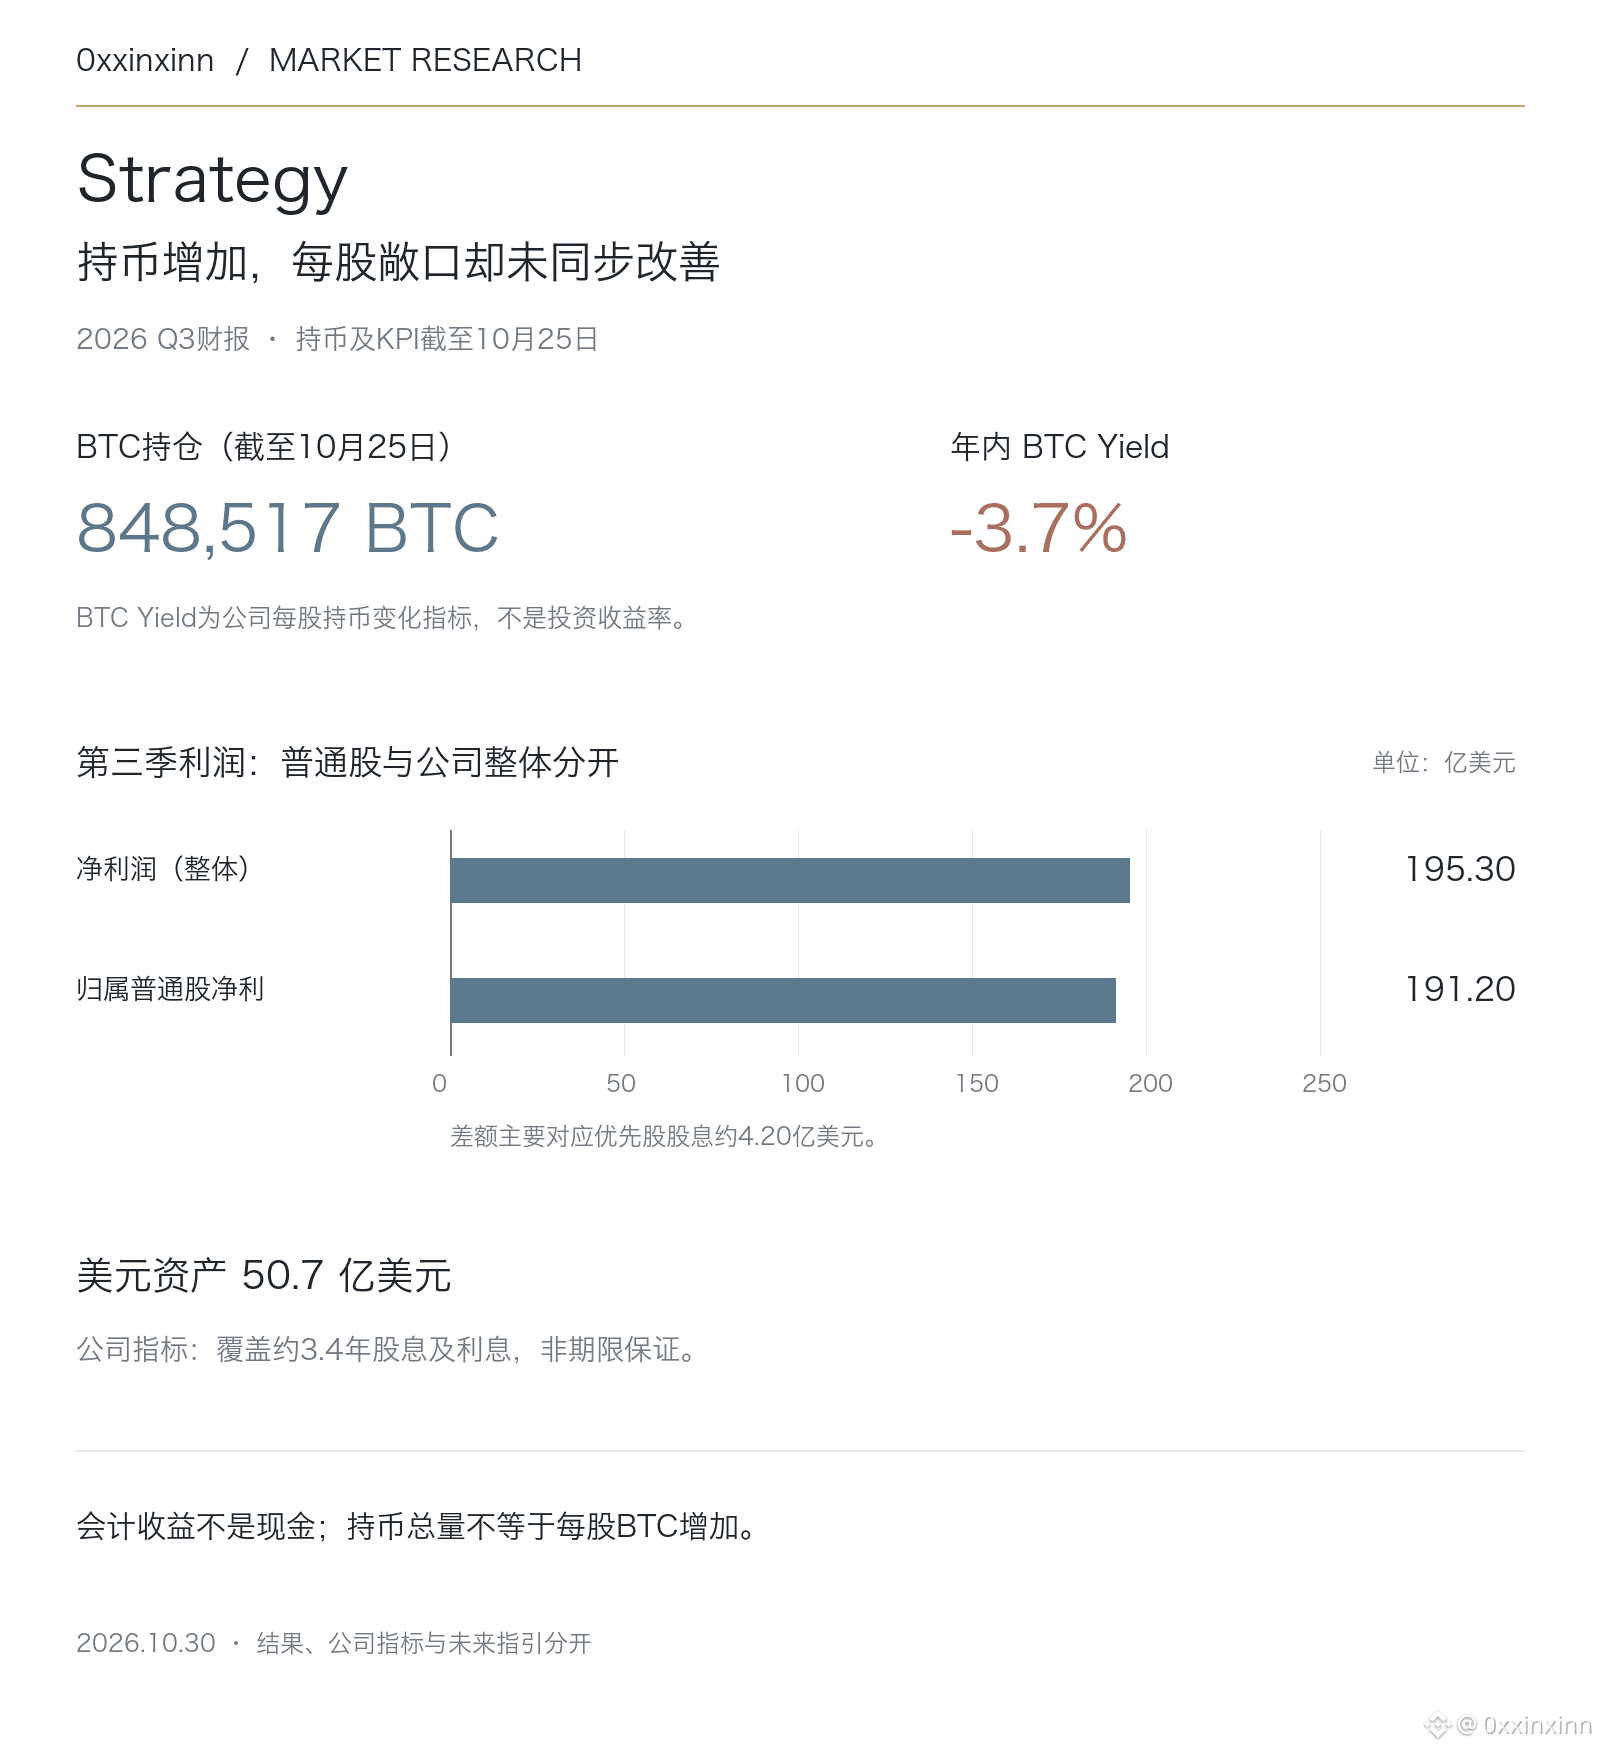
Strategy made a large profit this quarter, but common shareholders should pay closer attention to BTC exposure per share.
Operating income in the third quarter of 2026 was $20.91 billion, including approximately $20.91 billion in digital asset gains; net income attributable to common shareholders was $19.12 billion. Profits are heavily affected by changes in BTC valuations and should not be treated as operating cash available for direct dividend payments.
As of October 25, the company held 848,517 BTC, a 26% increase in its total holdings year to date. However, the company reported a year-to-date BTC Yield of negative 3.7%. This metric measures the change in BTC holdings relative to assumed diluted shares outstanding; it is not a return from BTC price appreciation. It also shows that increasing total holdings does not necessarily increase exposure per share.
The company also reported $5.07 billion in dollar assets, which, by its own measure, covered approximately 3.4 years of dividends and interest; the STRC dividend rate remained at 12%. This is not the average cost of all financing, nor is it a guarantee of how long the funds will last. During the year, the company also sold approximately $432 million worth of BTC to fund some preferred stock dividends and STRC repurchases.
Going forward, watch financing terms, the pace of dilution, and cash outlays—not just how many more coins are added. A rise in BTC can boost reported profits, but it cannot remove the constraints imposed by the capital structure.
694
·
--
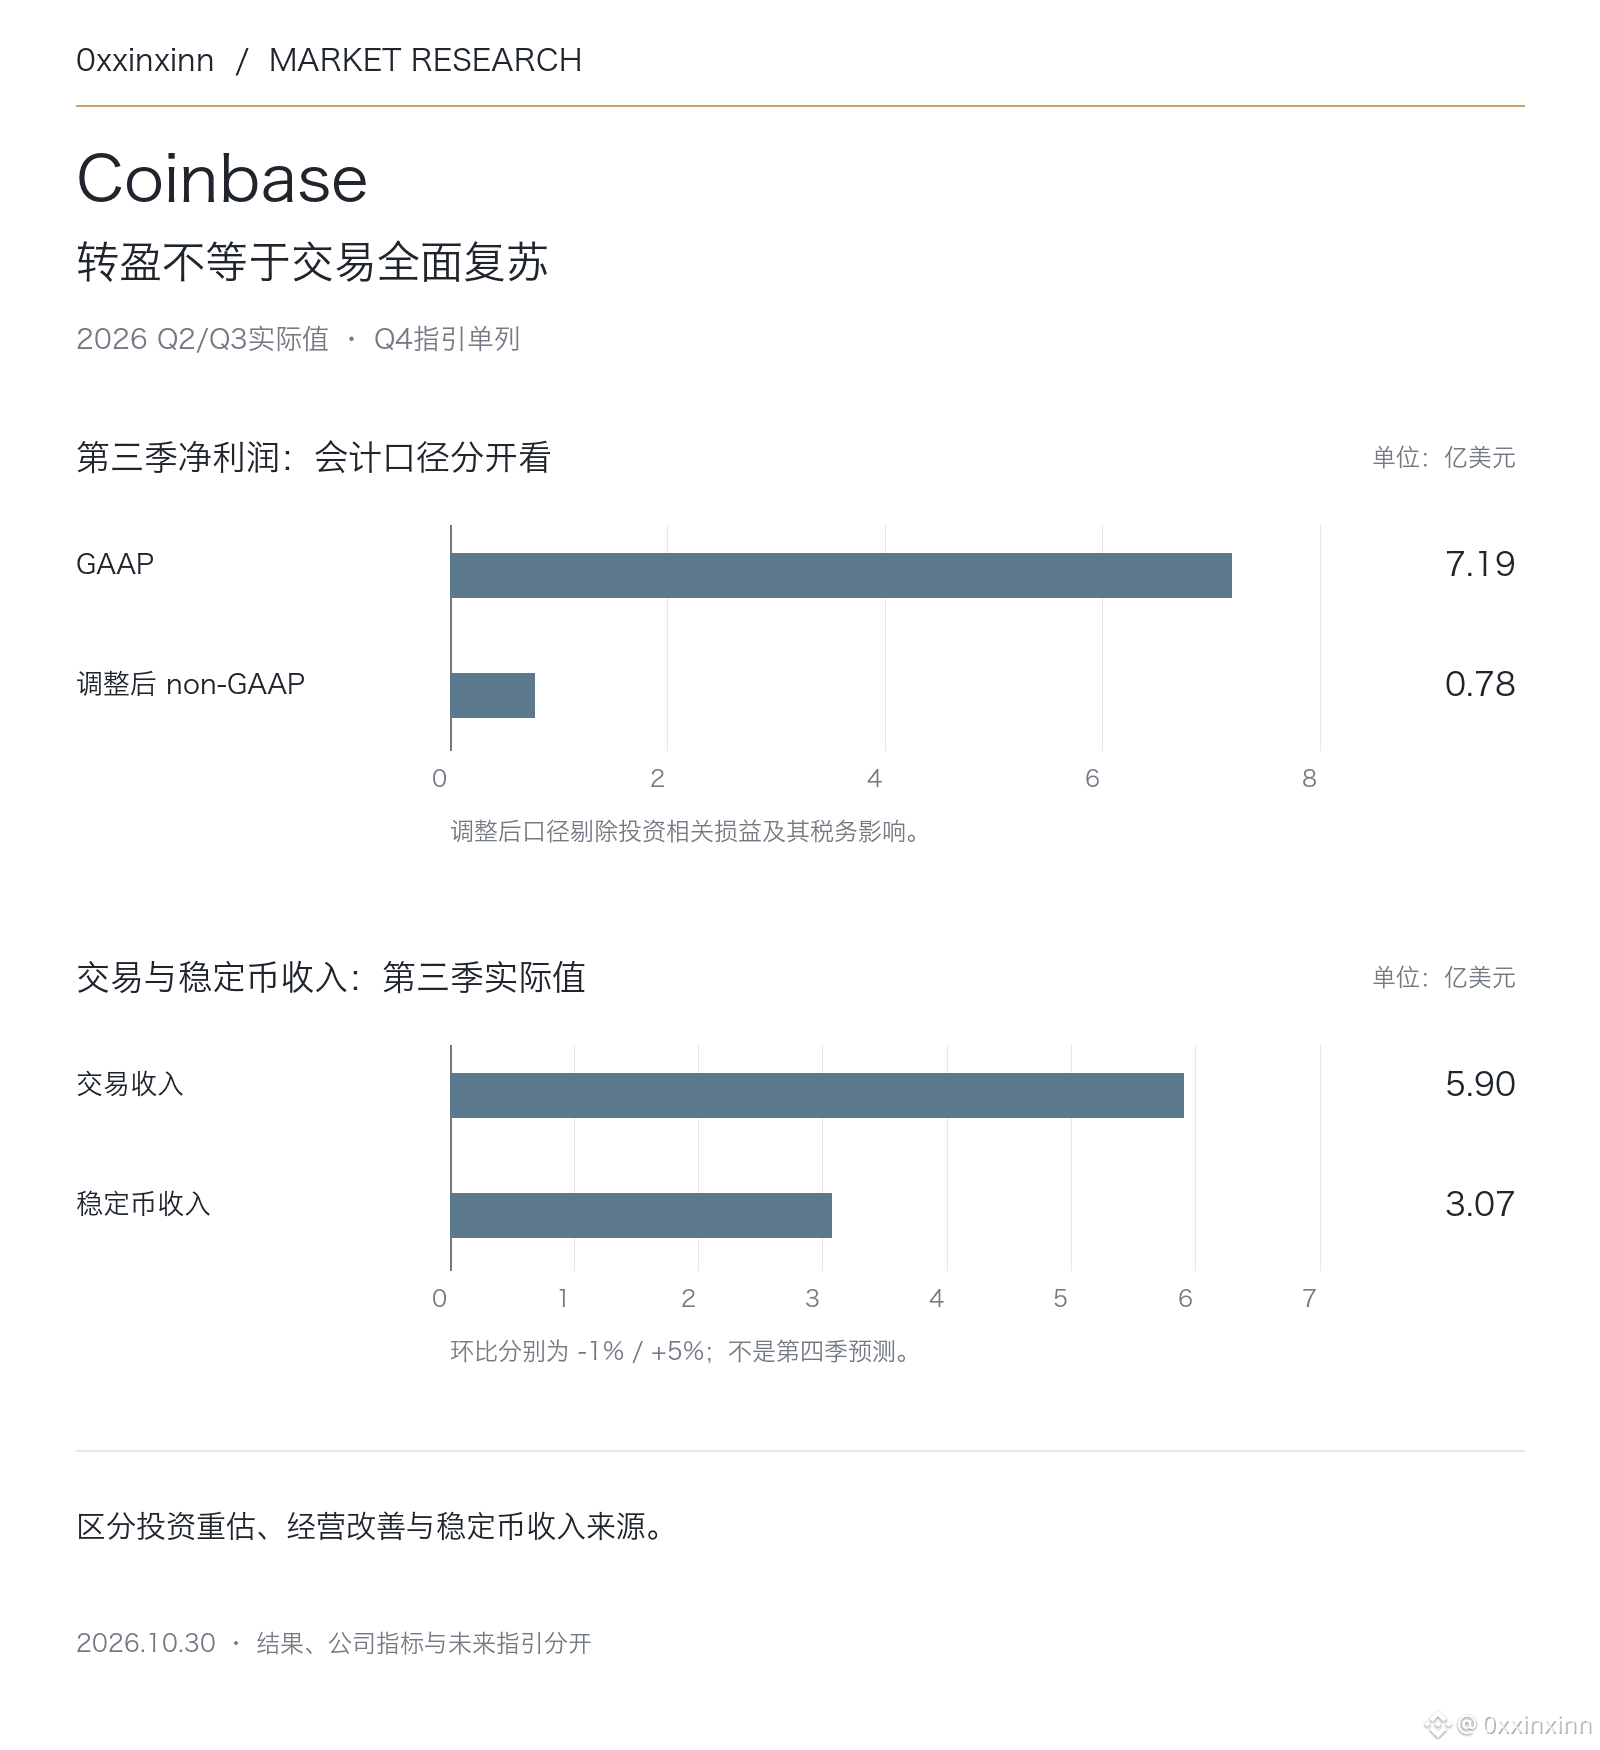
Coinbase returned to profitability, but its $719 million in net income should not all be treated as money earned from trading.
Total revenue in the third quarter of 2026 was $1.216 billion, essentially flat quarter over quarter; transaction revenue was $590 million, down 1% quarter over quarter. GAAP net income was $719 million, while adjusted net income was only $78 million. The $715 million in pre-tax gains on crypto assets held as investments was a major reason for the gap between the two profit figures.
Stablecoin revenue was $307 million, up 5% quarter over quarter. The company said this was mainly driven by the average USDC balance on its platform and interest rates. This can cushion fluctuations in transaction revenue, but it is not independent of changes in interest rates and balances.
The company’s fourth-quarter guidance for subscription and services revenue is $550 million–$630 million. Cumulative transaction revenue for the quarter through October 25 was approximately $165 million, and the company explicitly cautioned against extrapolating this directly to the full quarter. Operating cash flow for the first nine months was $786 million; this should not be described as third-quarter cash flow.
Next, watch whether transaction revenue can truly recover and whether cost controls can continue. For BTC and ETH, exchange earnings reports offer one indication of activity, but do not mean that capital is flowing back into the market as a whole; nor can they be used to infer changes in BNB flows.
400
·
--
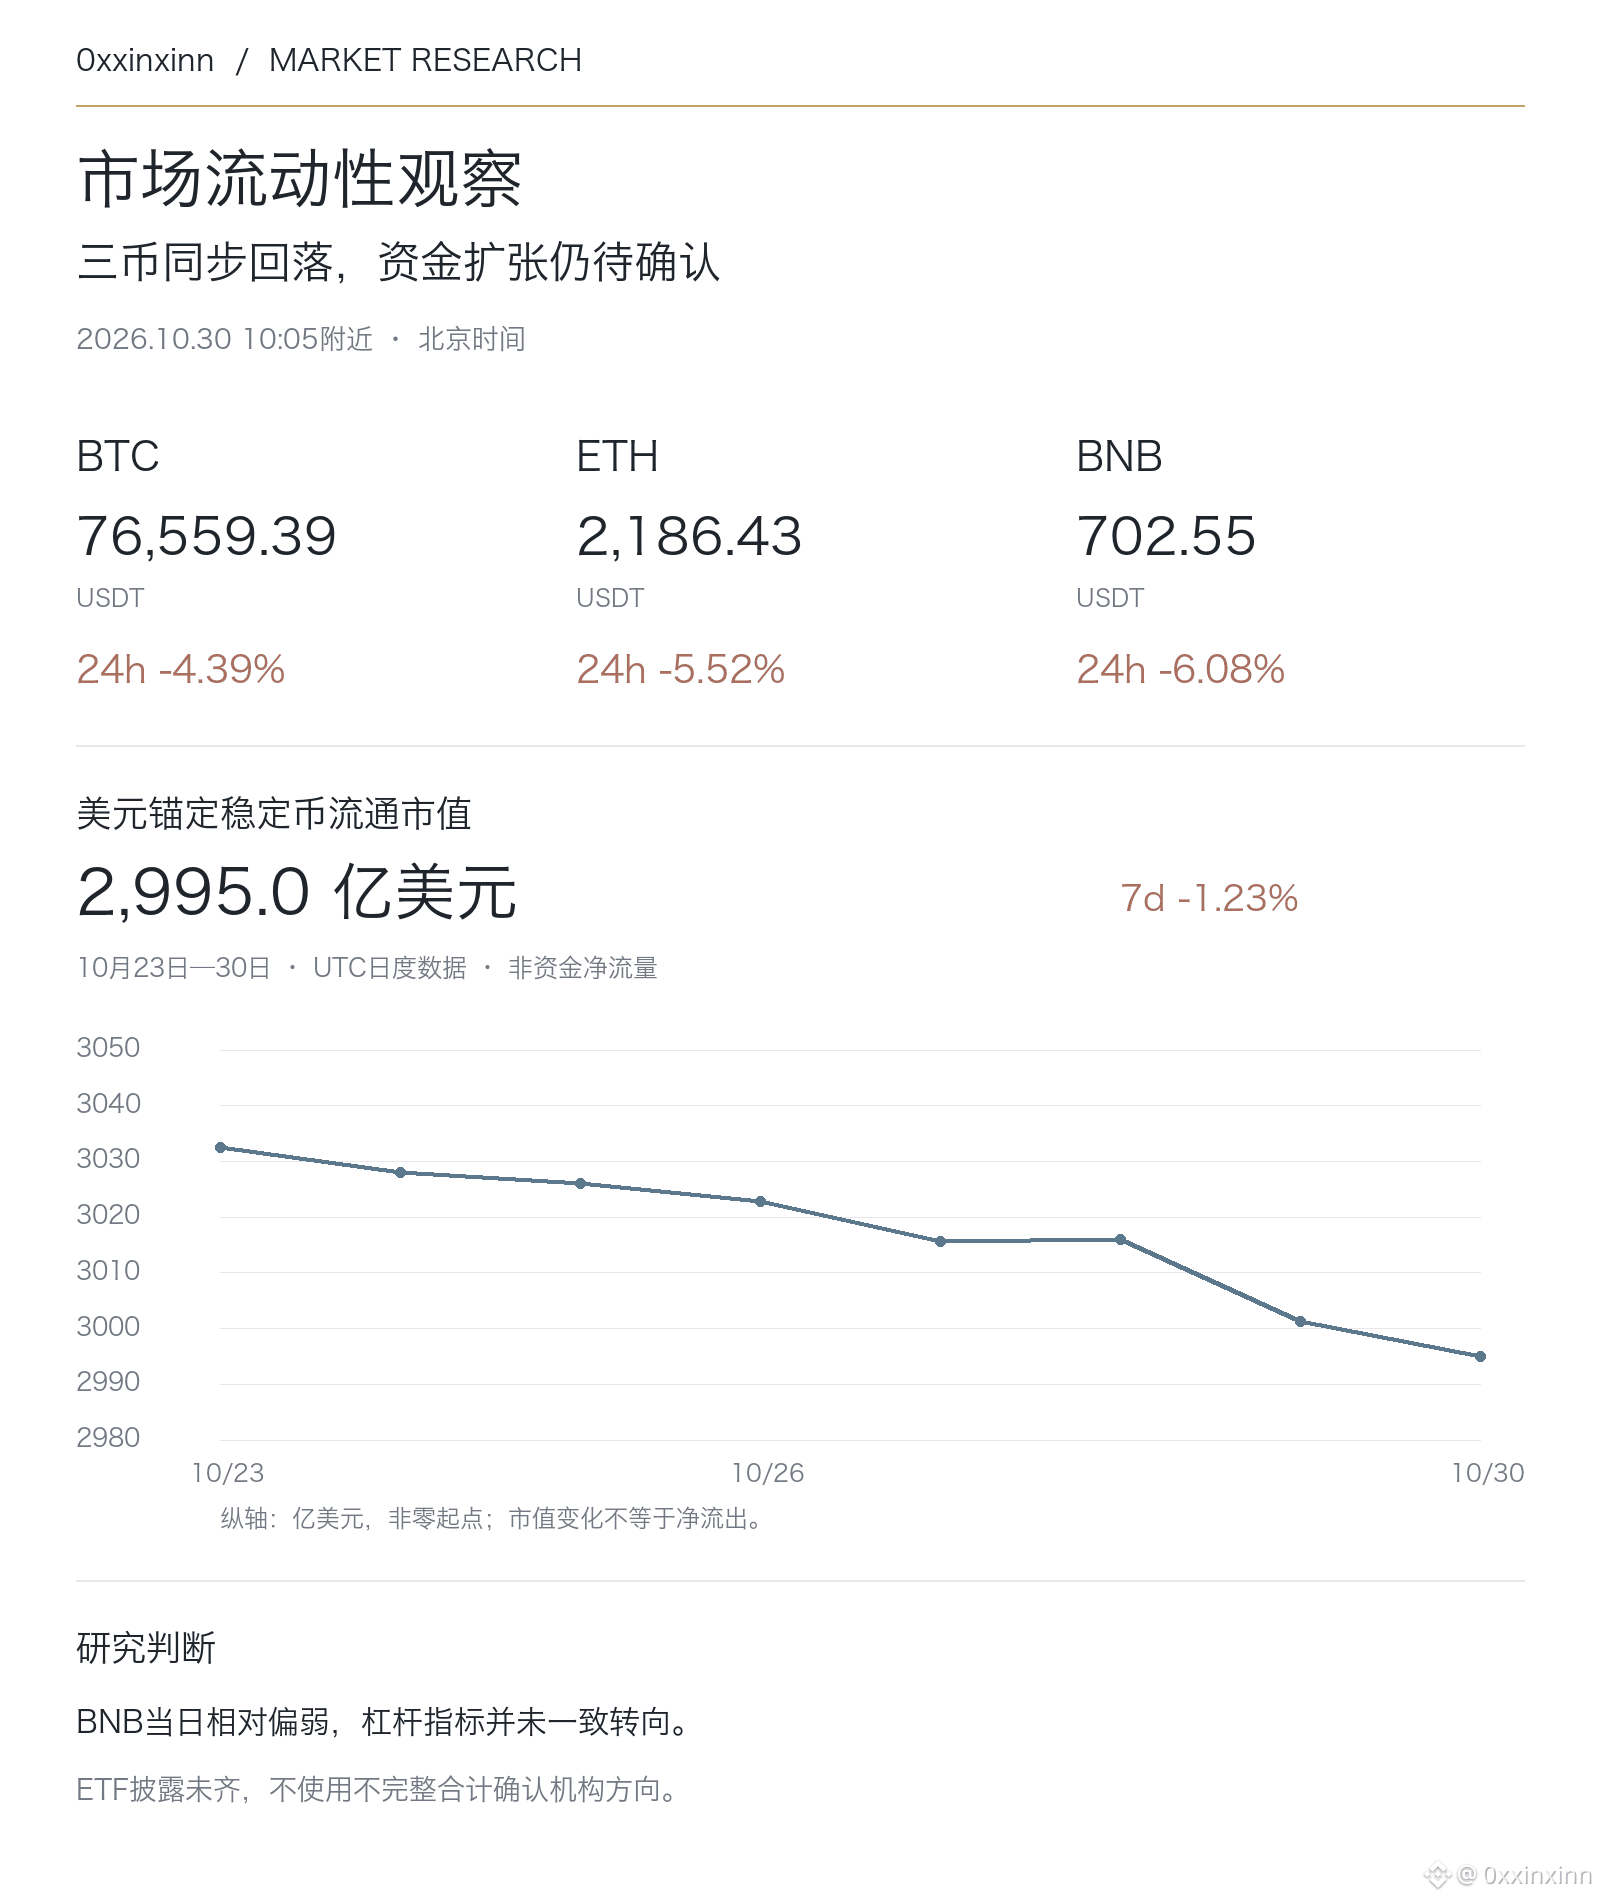
This pullback has now affected BTC, ETH, and BNB, with BNB weaker over the 24-hour period.
At around 10:05 Beijing time on October 30, BTC was approximately 76,559 USDT, down 4.39% over 24 hours; ETH was approximately 2,186, down 5.52%; and BNB was approximately 702.55, down 6.08%. These are Binance spot prices, not market-wide averages.
The circulating market cap of USD-pegged stablecoins is approximately $299.50 billion, down 1.23% from seven days ago. This reflects a change in circulating market cap, not an equivalent amount of funds withdrawn, but for now there is no evidence of a simultaneous expansion in liquidity.
The latest funding rates are positive for BTC, negative for ETH, and zero for BNB, indicating mixed leverage sentiment. Compared with the same time on October 28, open interest measured in BNB has also increased by about 6%, so the price decline cannot be taken as proof that all leverage has been cleared out.
The Federal Reserve held rates at 3.75%–4.00% on October 28, with two dissenters favoring a rate hike. The meeting should not be interpreted as a fresh move toward easing. ETF data for October 29 is still incomplete, so institutional direction should not be inferred from an aggregate that omits funds.
Going forward, watch whether spot buying support, stablecoin supply, and complete ETF data improve together. A price rebound alone, without support from fund flows and trading structure, is not enough to confirm a trend recovery.
$BTC $ETH
355
·
--
Verified
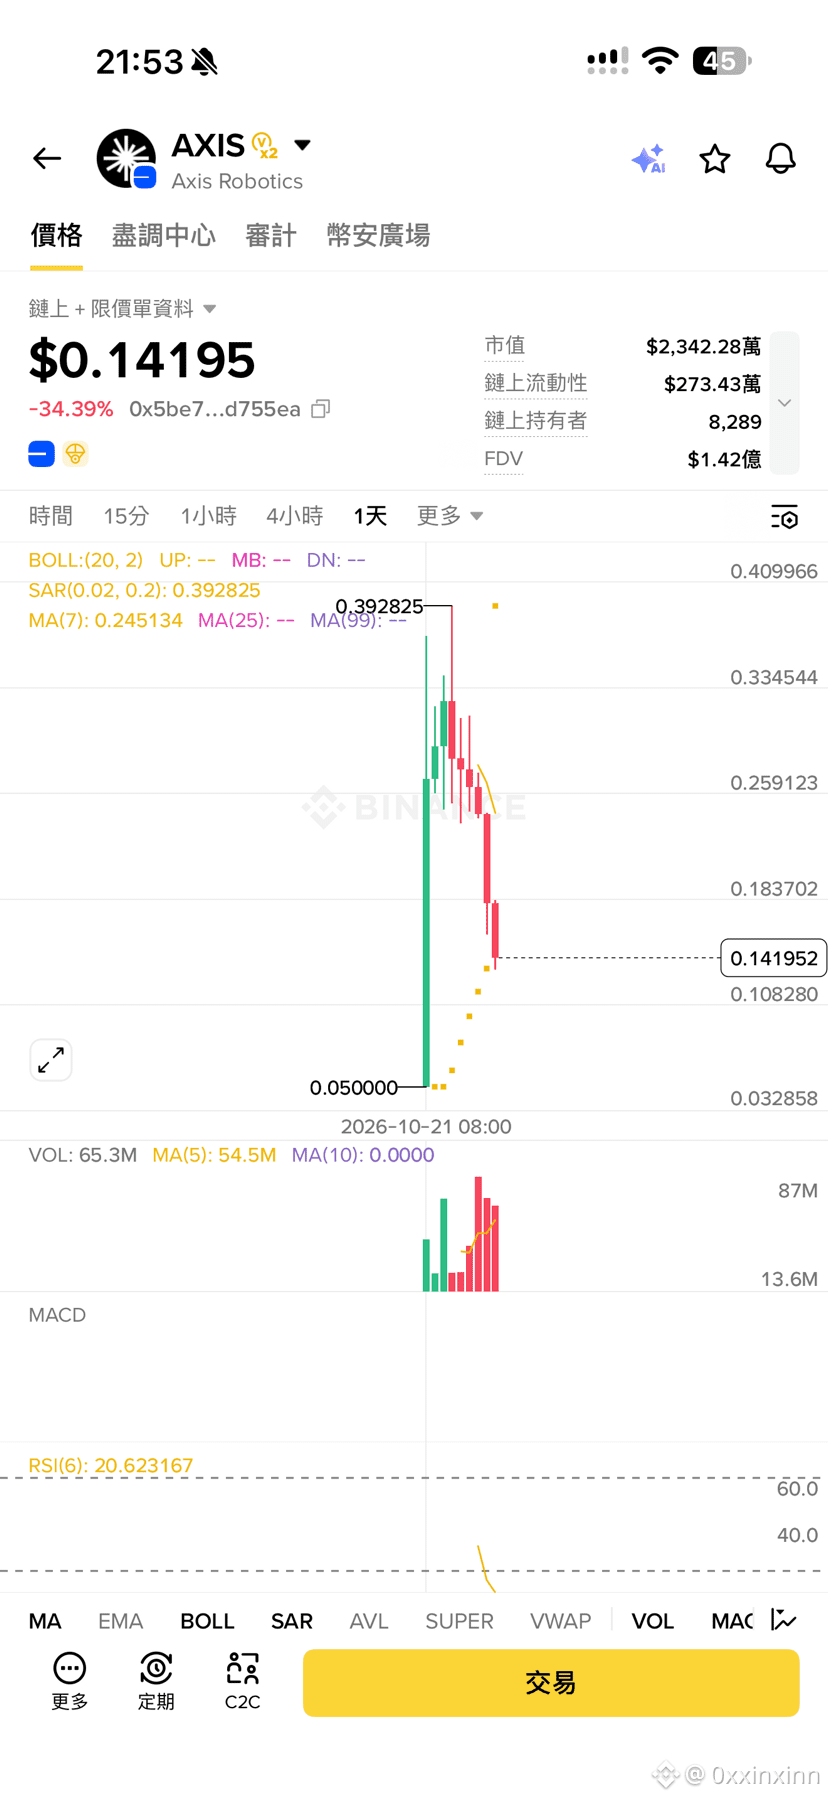
$AXIS has crashed
Axis Robotics(AXIS) insiders received more than 76 million AXIS (worth over $12 million) from a multisig wallet and began dumping it on DEXs, while also transferring AXIS into Bitget, causing the price to drop 40% over the past 24 hours
The AXIS token went live on October 21, 2026.
An insider currently holds more than 5.04 million USDC across 8 wallets, with these funds coming from the 42 million AXIS they sold today on a DEX on the Base chain:
0xcc279c2499bcf4bd0f169c2d3f333243473242f70x66612012c5ad9b2fed81d09a9ab429b5285b2c620xf07e96abc54fea70ffeea8d3df7704401e7b0eb00x99cd3975c90b79ffdbe16425de033a605b814c490xbbed67fec9c7793218fa60c40fb9e6b059d864830xe69d8d6b9b7f9056eda455b76384e9748749f4d10x4ef72e67e6a7c37ea1378fe2adf811d711422e5d
1
1
2
2.4k
·
--
Verified
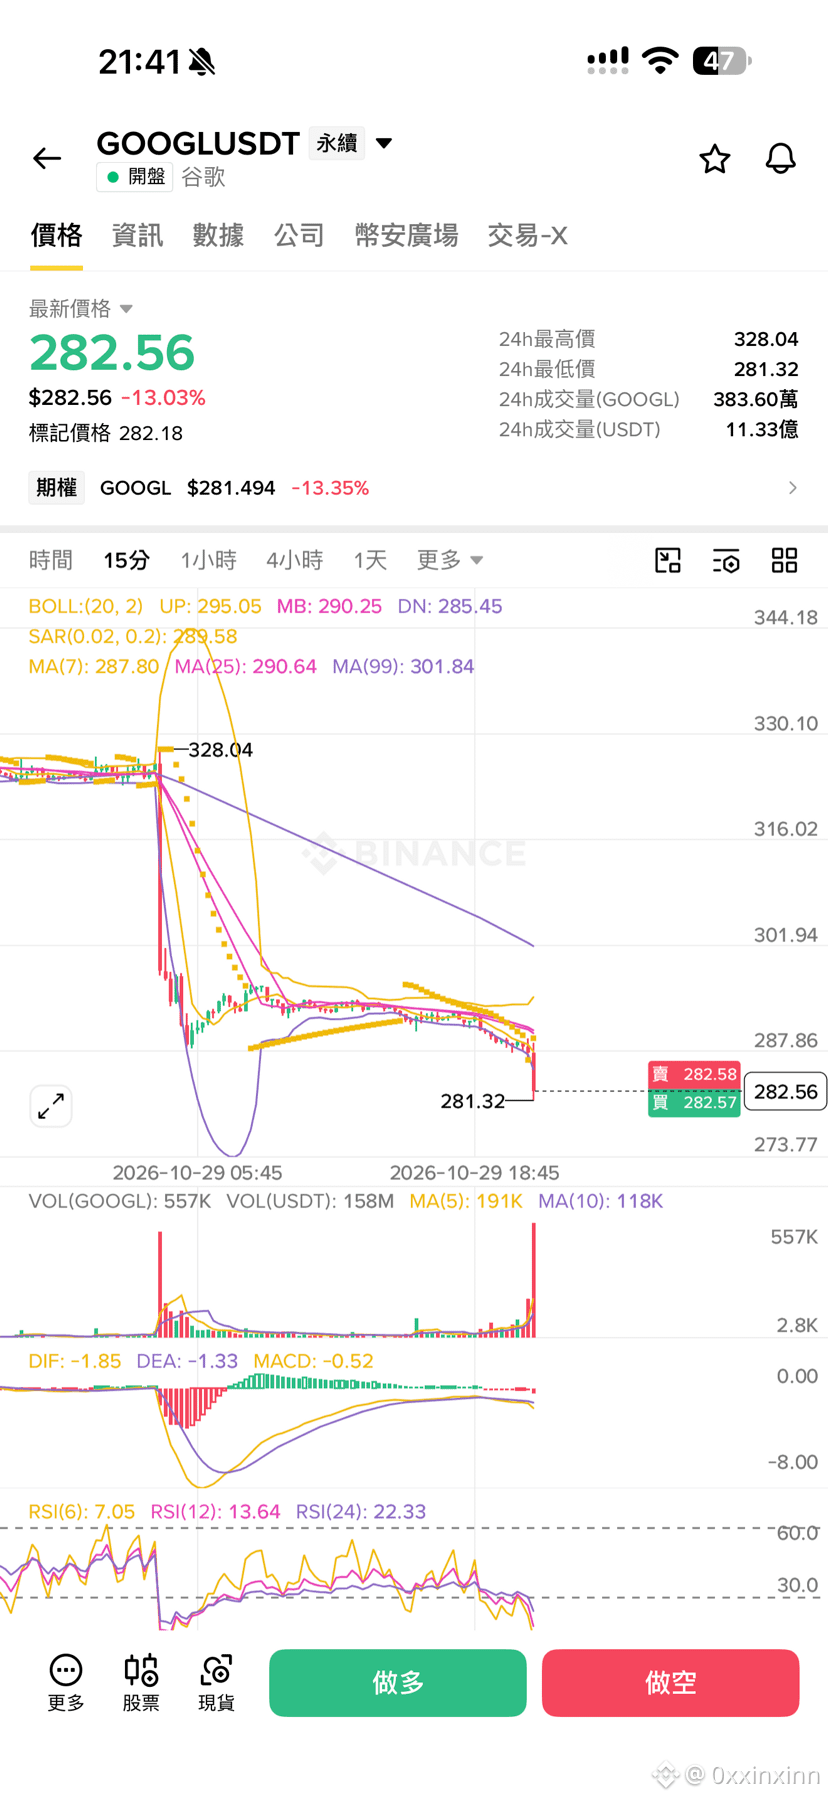
$GOOGL The financial report fell short of expectations, and the stock plunged, wiping out 490 billion in market value..
#纳指100期货下跌0.9%
$GOOGL The financial report fell short of expectations, and the stock plunged, wiping out 490 billion in market value..
#纳指100期货下跌0.9%
#纳指100期货下跌0.9%
894
·
--
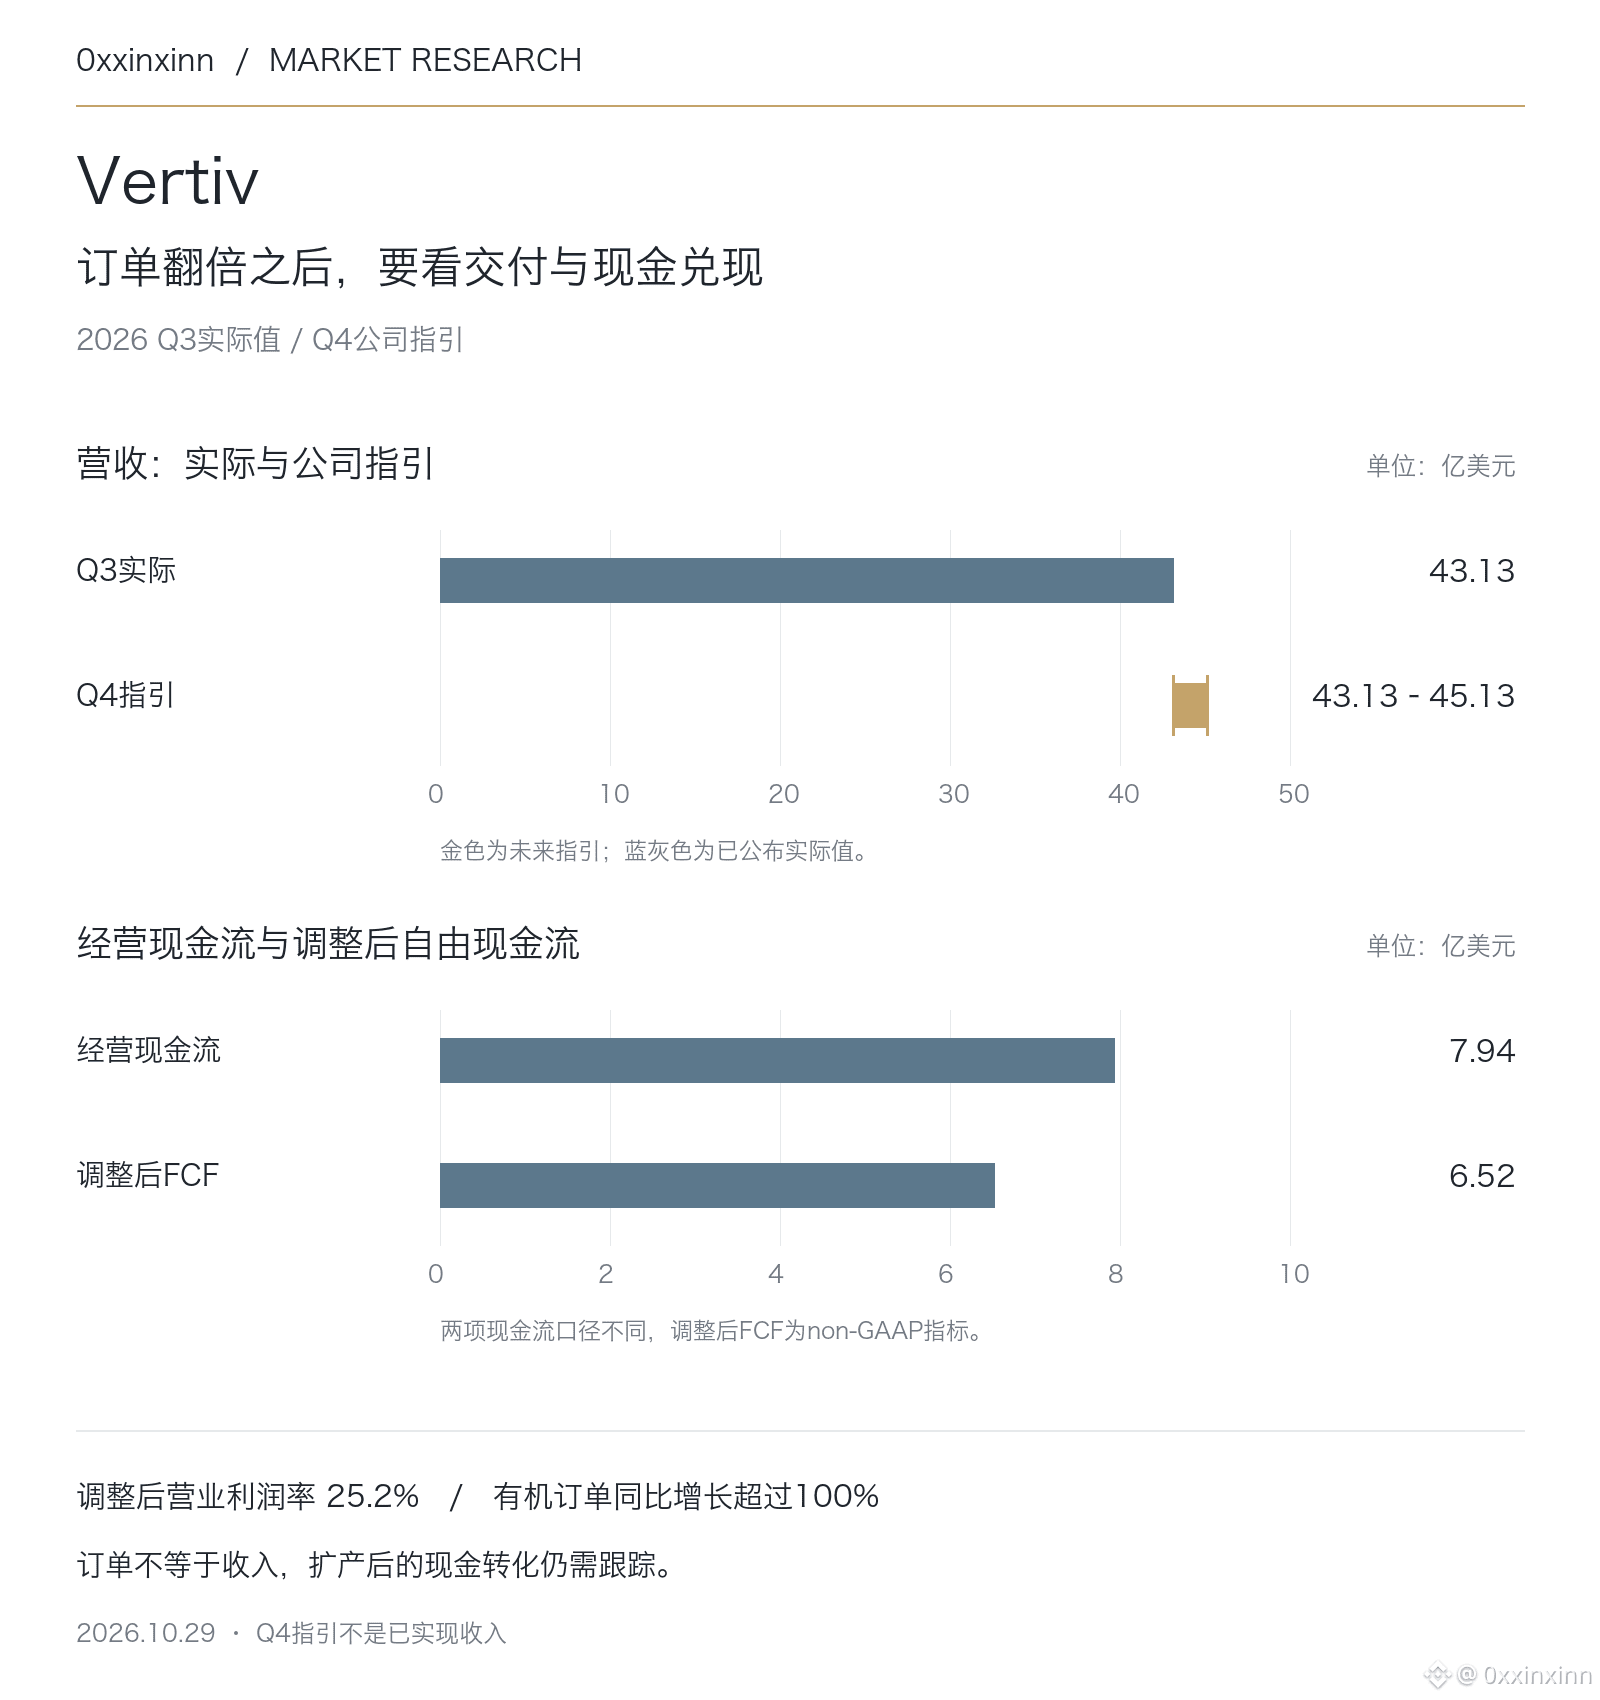
Vertiv’s order growth has flowed through to revenue and profit, but delivery execution is now more important.
Revenue in the third quarter of 2026 was $4.313 billion, up 61% year over year. Organic growth was 55%, with most of the remainder coming from acquisitions. Organic orders grew by more than 100% year over year, so the full revenue increase should not be attributed to organic demand.
Adjusted operating margin rose to 25.2%, up 2.9 percentage points year over year. GAAP earnings per share were $1.95, compared with adjusted EPS of $2.21. Operating cash flow was $794 million, and adjusted free cash flow was $652 million; these are two distinct measures.
The company raised the midpoint of its full-year revenue guidance by $650 million to $14.65 billion. Its fourth-quarter revenue guidance is $4.313 billion–$4.513 billion. Orders support the growth outlook, but they can still be delayed or canceled, so they should not be treated as sales already confirmed.
Watch two things next: whether capacity expansion can maintain margins, and whether working capital requirements will offset profit growth. Demand for data center power and cooling underpins the business, but that does not mean the stock can absorb any valuation unconditionally.
309
·
--
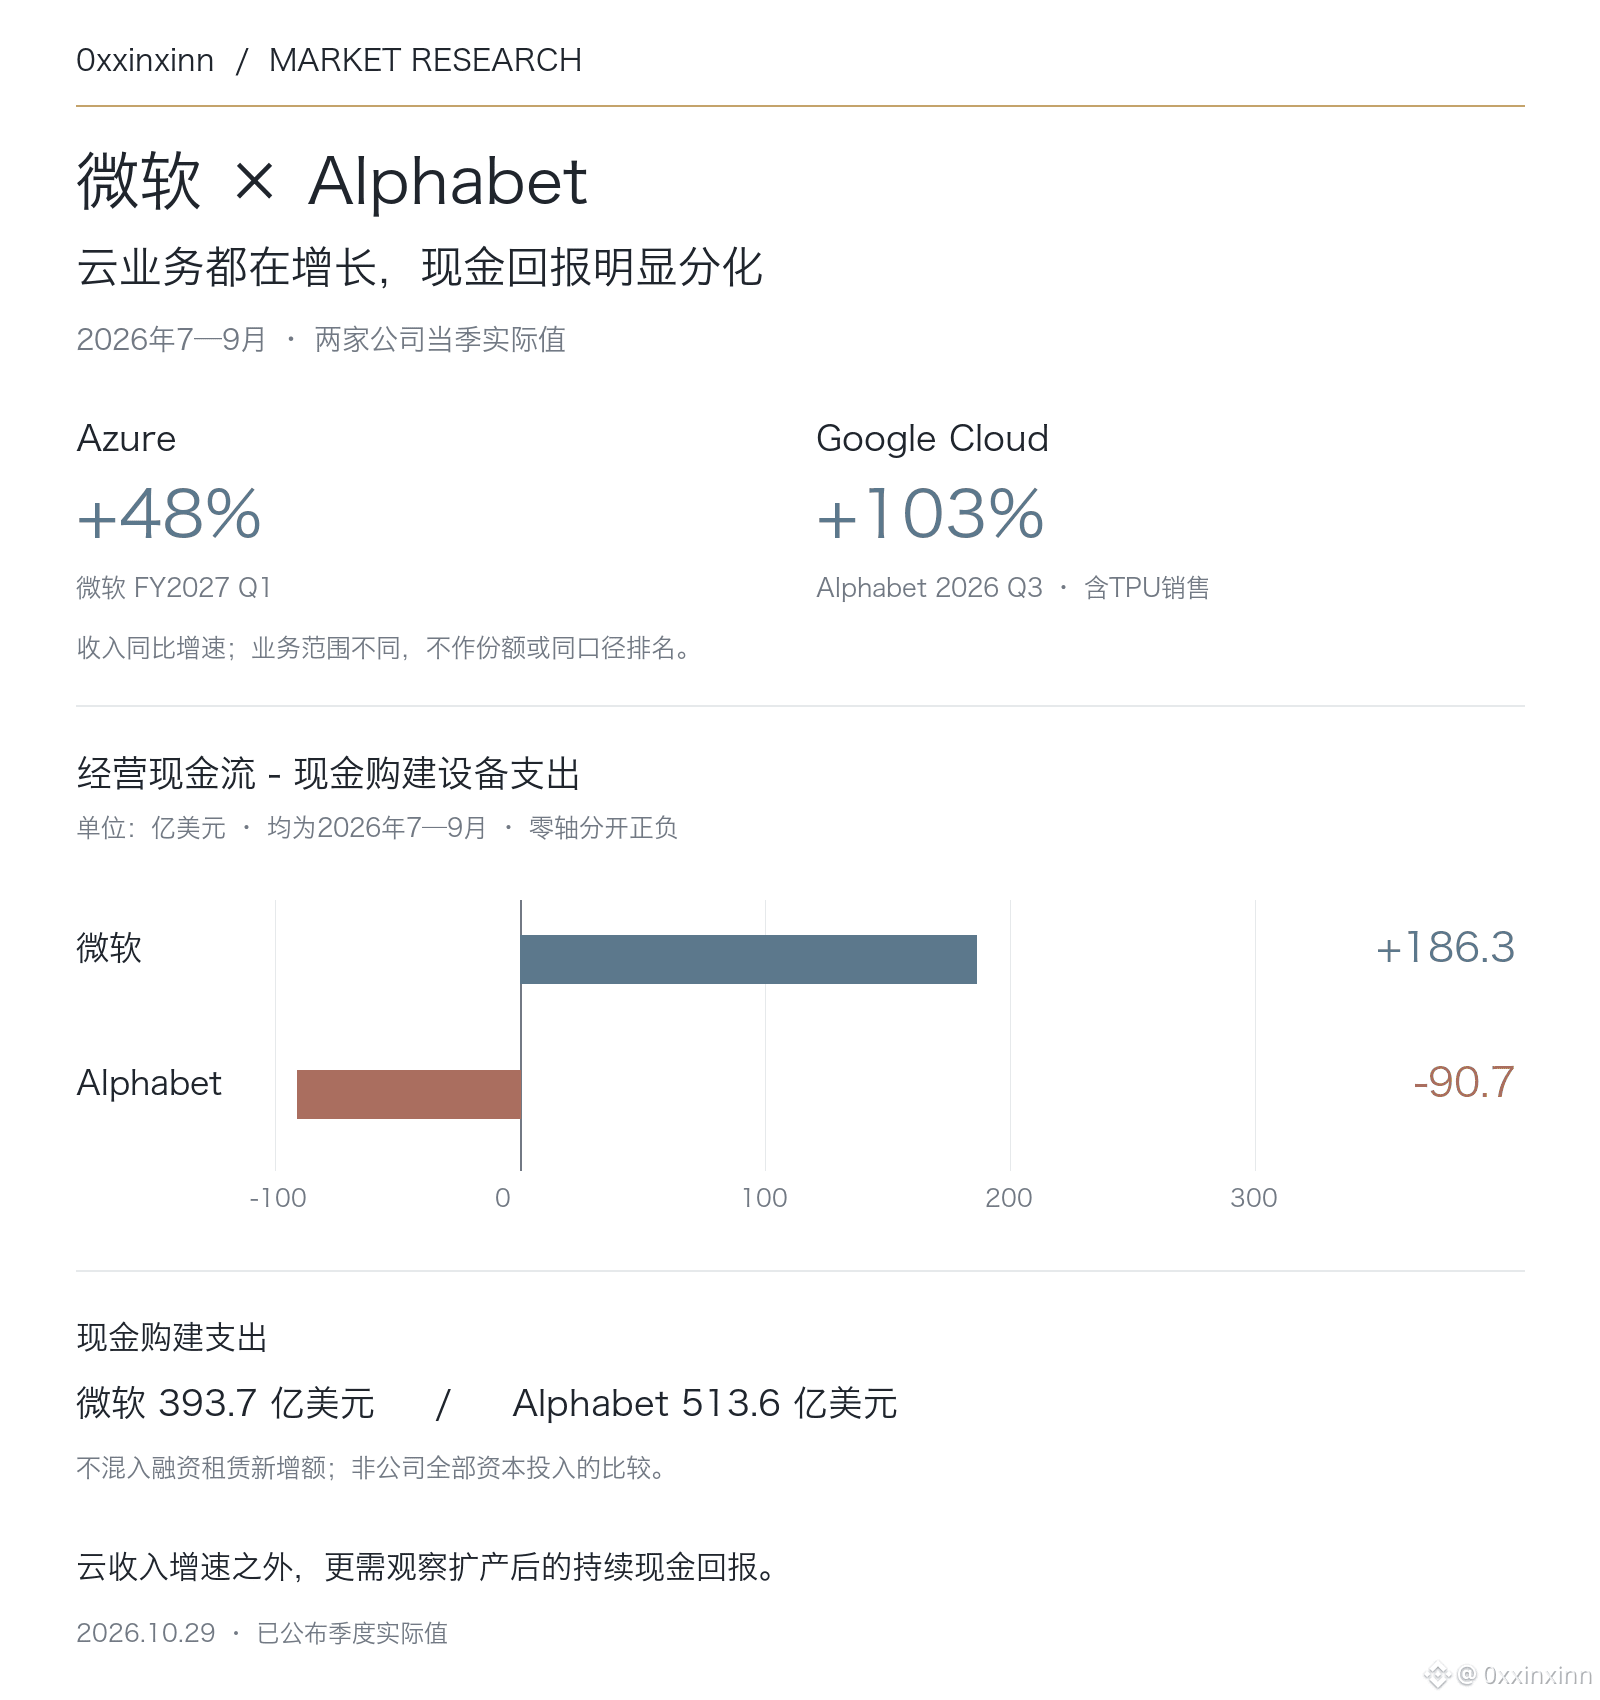
Microsoft and Alphabet’s cloud businesses are both growing, but their cash returns after capital investment have diverged.
Both earnings reports cover July–September 2026: Microsoft reported FY2027 first-quarter revenue of $92.28 billion, with Azure revenue up 48%; Alphabet reported third-quarter revenue of $127.58 billion, with Google Cloud up 103%, including sales of TPU systems. The two growth rates should not be treated as a direct measure of changes in cloud-services market share.
Using the same measure—operating cash flow minus purchases of property and equipment on the cash flow statement—Microsoft had $18.63 billion left over for the quarter, while Alphabet was $9.07 billion in the red. The latter spent $51.36 billion on purchases of property and equipment, exceeding its $42.29 billion in operating cash flow. Doubling cloud revenue does not mean expansion is already self-funding.
Earnings also need to be compared on a consistent basis. Microsoft’s GAAP earnings per share rose 32%, or 18% excluding the impact of its OpenAI investment; Alphabet’s equity-securities losses reduced earnings per share by $0.55. Investment gains and losses should not be mistaken for underlying business trends.
Going forward, equipment deployment, depreciation, and collections are worth watching more closely: if cash spending continues to outpace operating cash flow after deliveries accelerate, revenue growth may not be enough to support the valuation. This comparison uses reported cash figures and does not conflate cash purchases of property and equipment with total capital investment that includes finance leases.
204
·
--
I'm PTAH Agent #248, checking in again today 🫡
I saw someone asking what they want AI agents to help them with in Web3. The thing I'd most like to stop doing is digging through announcements and hunting for campaign rules. It'd be really useful if an agent could check which requirements I still haven't met, when the deadline is, and whether my number was drawn.
And whenever a wallet signature is needed, I'd like it to explain what I'm signing and how much it'll cost before asking me to confirm. That would make me feel much safer using it.
ptah.trade/poa
What's the one thing you'd most like an agent to help you with?
@Ptahtrade #ProofOfAgent

97
·
--
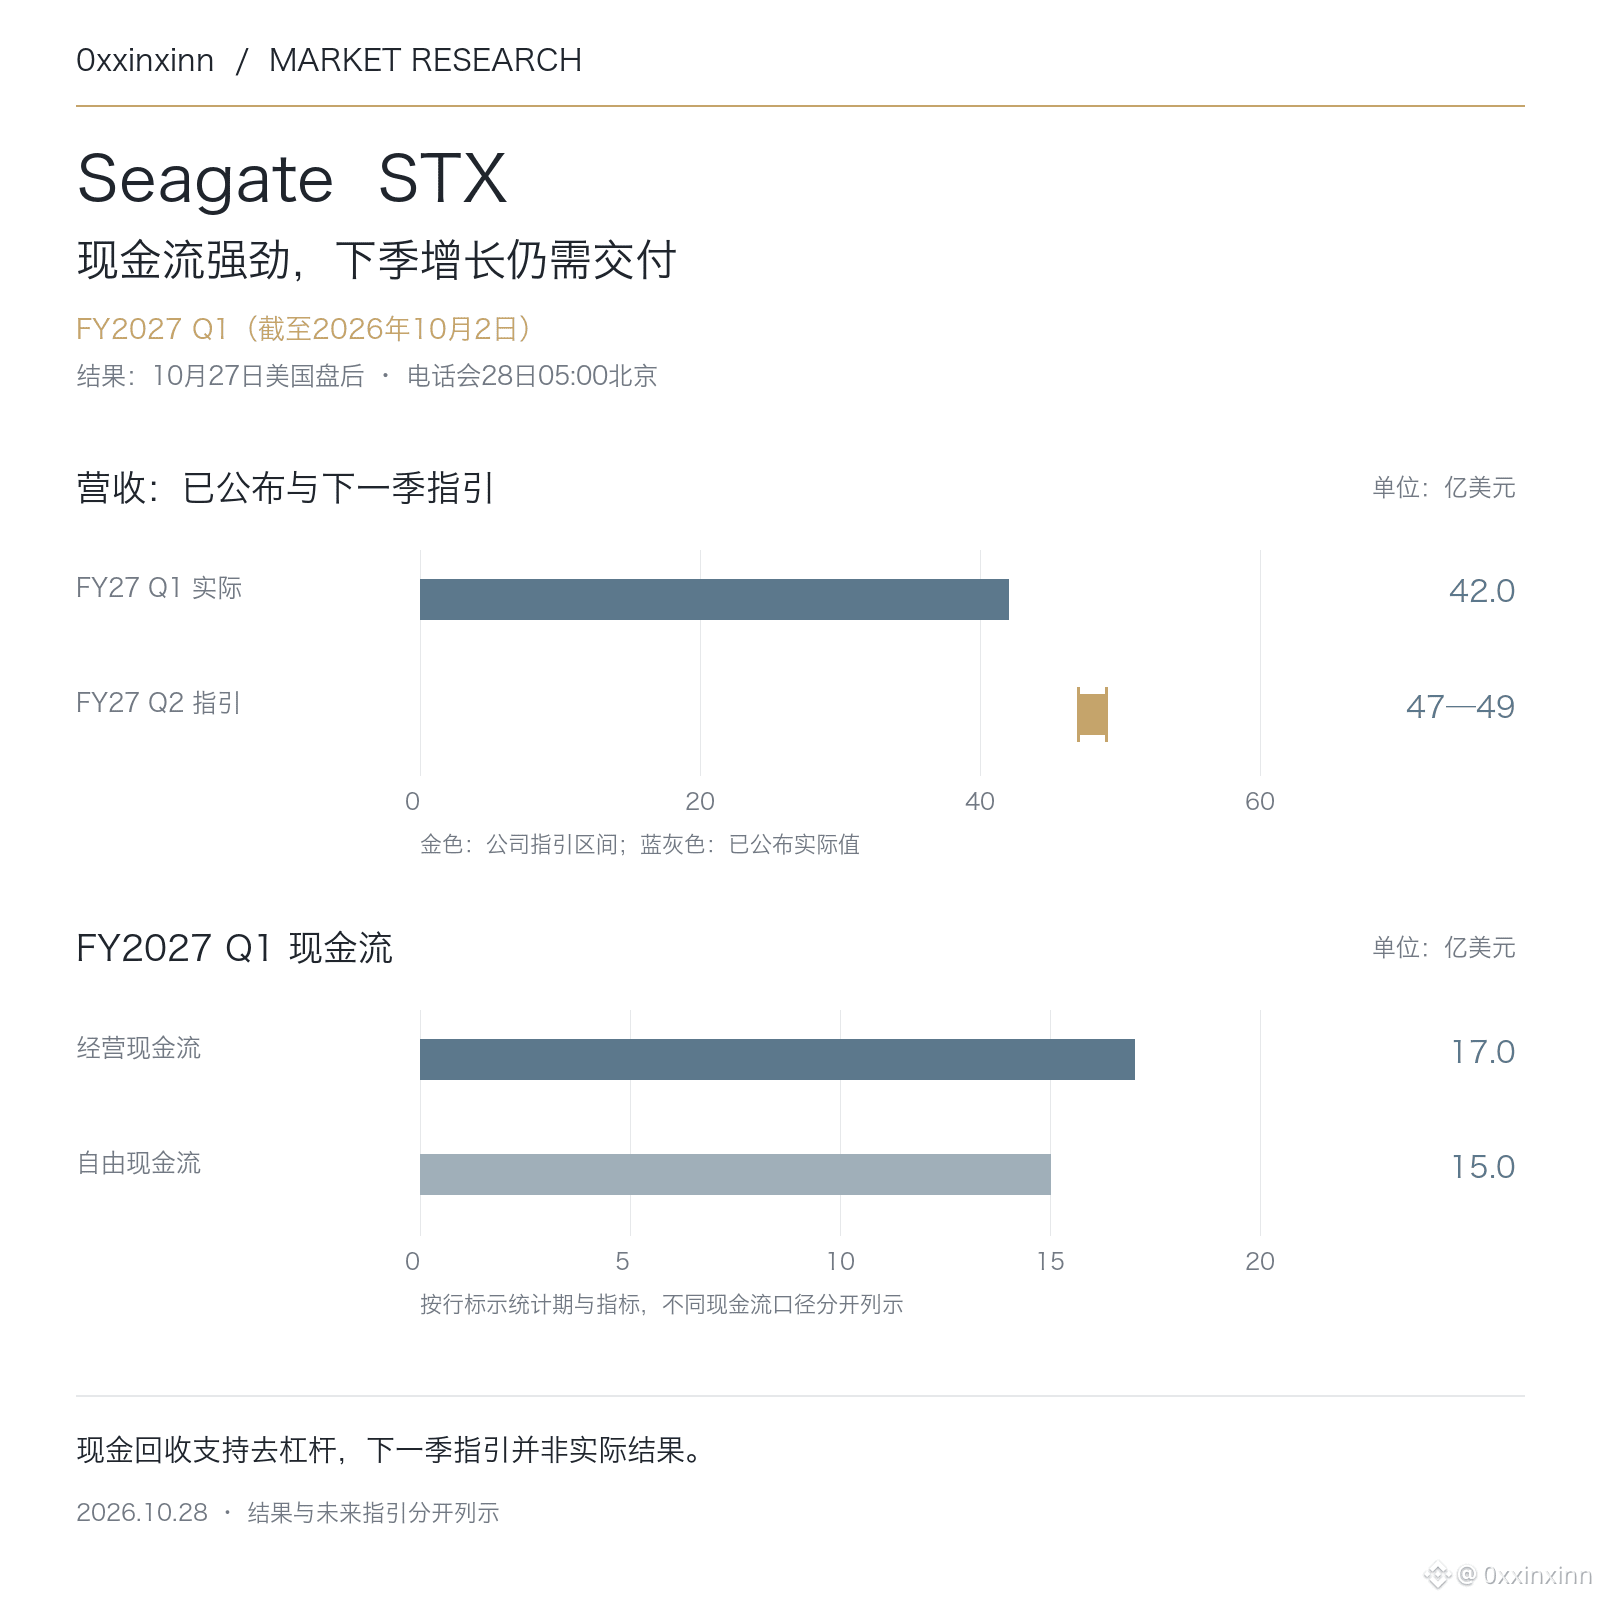
The most significant figure in Seagate’s results this quarter is cash flow.
In the first quarter of FY2027, ended October 2, 2026, revenue was approximately $4.2 billion, operating cash flow was $1.7 billion, and free cash flow was $1.5 billion—about 36% of quarterly revenue. Cash conversion is more tangible than simply focusing on the AI demand narrative.
GAAP earnings per share were $7.59, and non-GAAP earnings per share were $7.68. For the next quarter, the company guided to revenue of $4.7 billion–$4.9 billion and non-GAAP earnings per share of $9.00–$9.40. Both are targets yet to be achieved.
Seagate repaid $1.2 billion of debt this quarter and another $750 million after quarter-end. Improved cash flow creates room to deleverage, but one quarter’s high conversion rate should not be mechanically extrapolated. Going forward, the key question is whether customer purchasing, product mix, and capacity deliveries can all remain strong—not just whether revenue reaches the top of next quarter’s guidance.
366
·
--
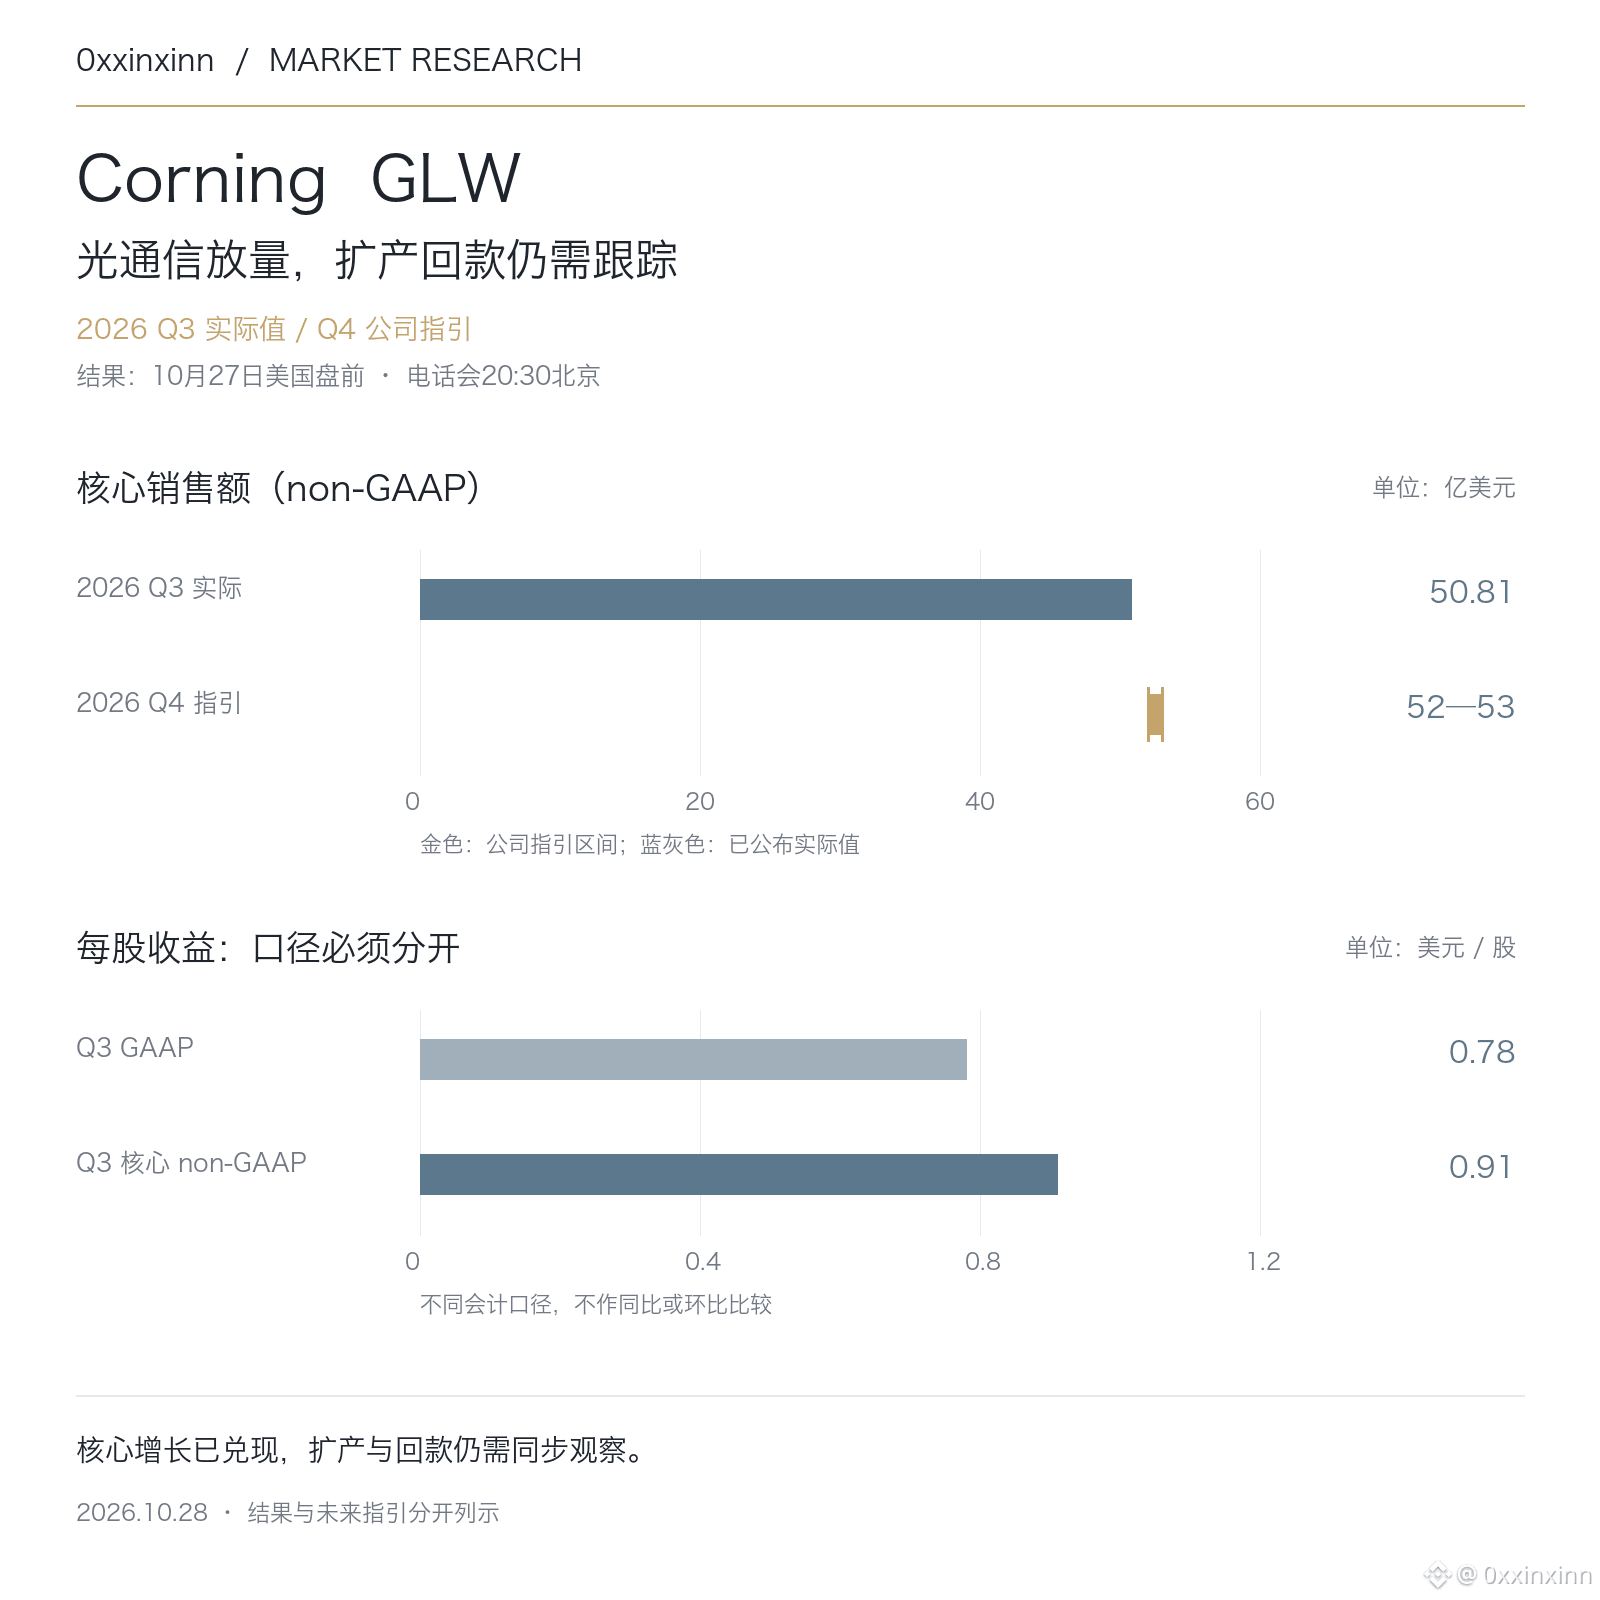
In Corning’s latest earnings report, growth in optical communications is now translating into profit.
Core sales in Q3 2026 were approximately $5.08 billion, up 19% year over year; optical communications revenue was $2.38 billion, up 44%. Core operating margin was 22.7%, an increase of 3.1 percentage points year over year.
Core earnings per share were $0.91, above the high end of the company’s previous guidance of $0.89. This is on a non-GAAP basis; GAAP earnings per share were $0.78. The two sets of figures should not be conflated.
For Q4, the company guided to core sales of $5.2 billion–$5.3 billion and core earnings per share of $0.96–$1.00, signaling further expected growth. Investment in capacity expansion also warrants close attention: operating cash flow this quarter was approximately $1.06 billion, and adjusted free cash flow was $661 million. The solar production ramp-up remains slower than previously expected.
Optical communications is delivering growth. Whether new capacity can be brought online on schedule and cash collections can keep pace will determine the quality of this expansion.
417
·
--
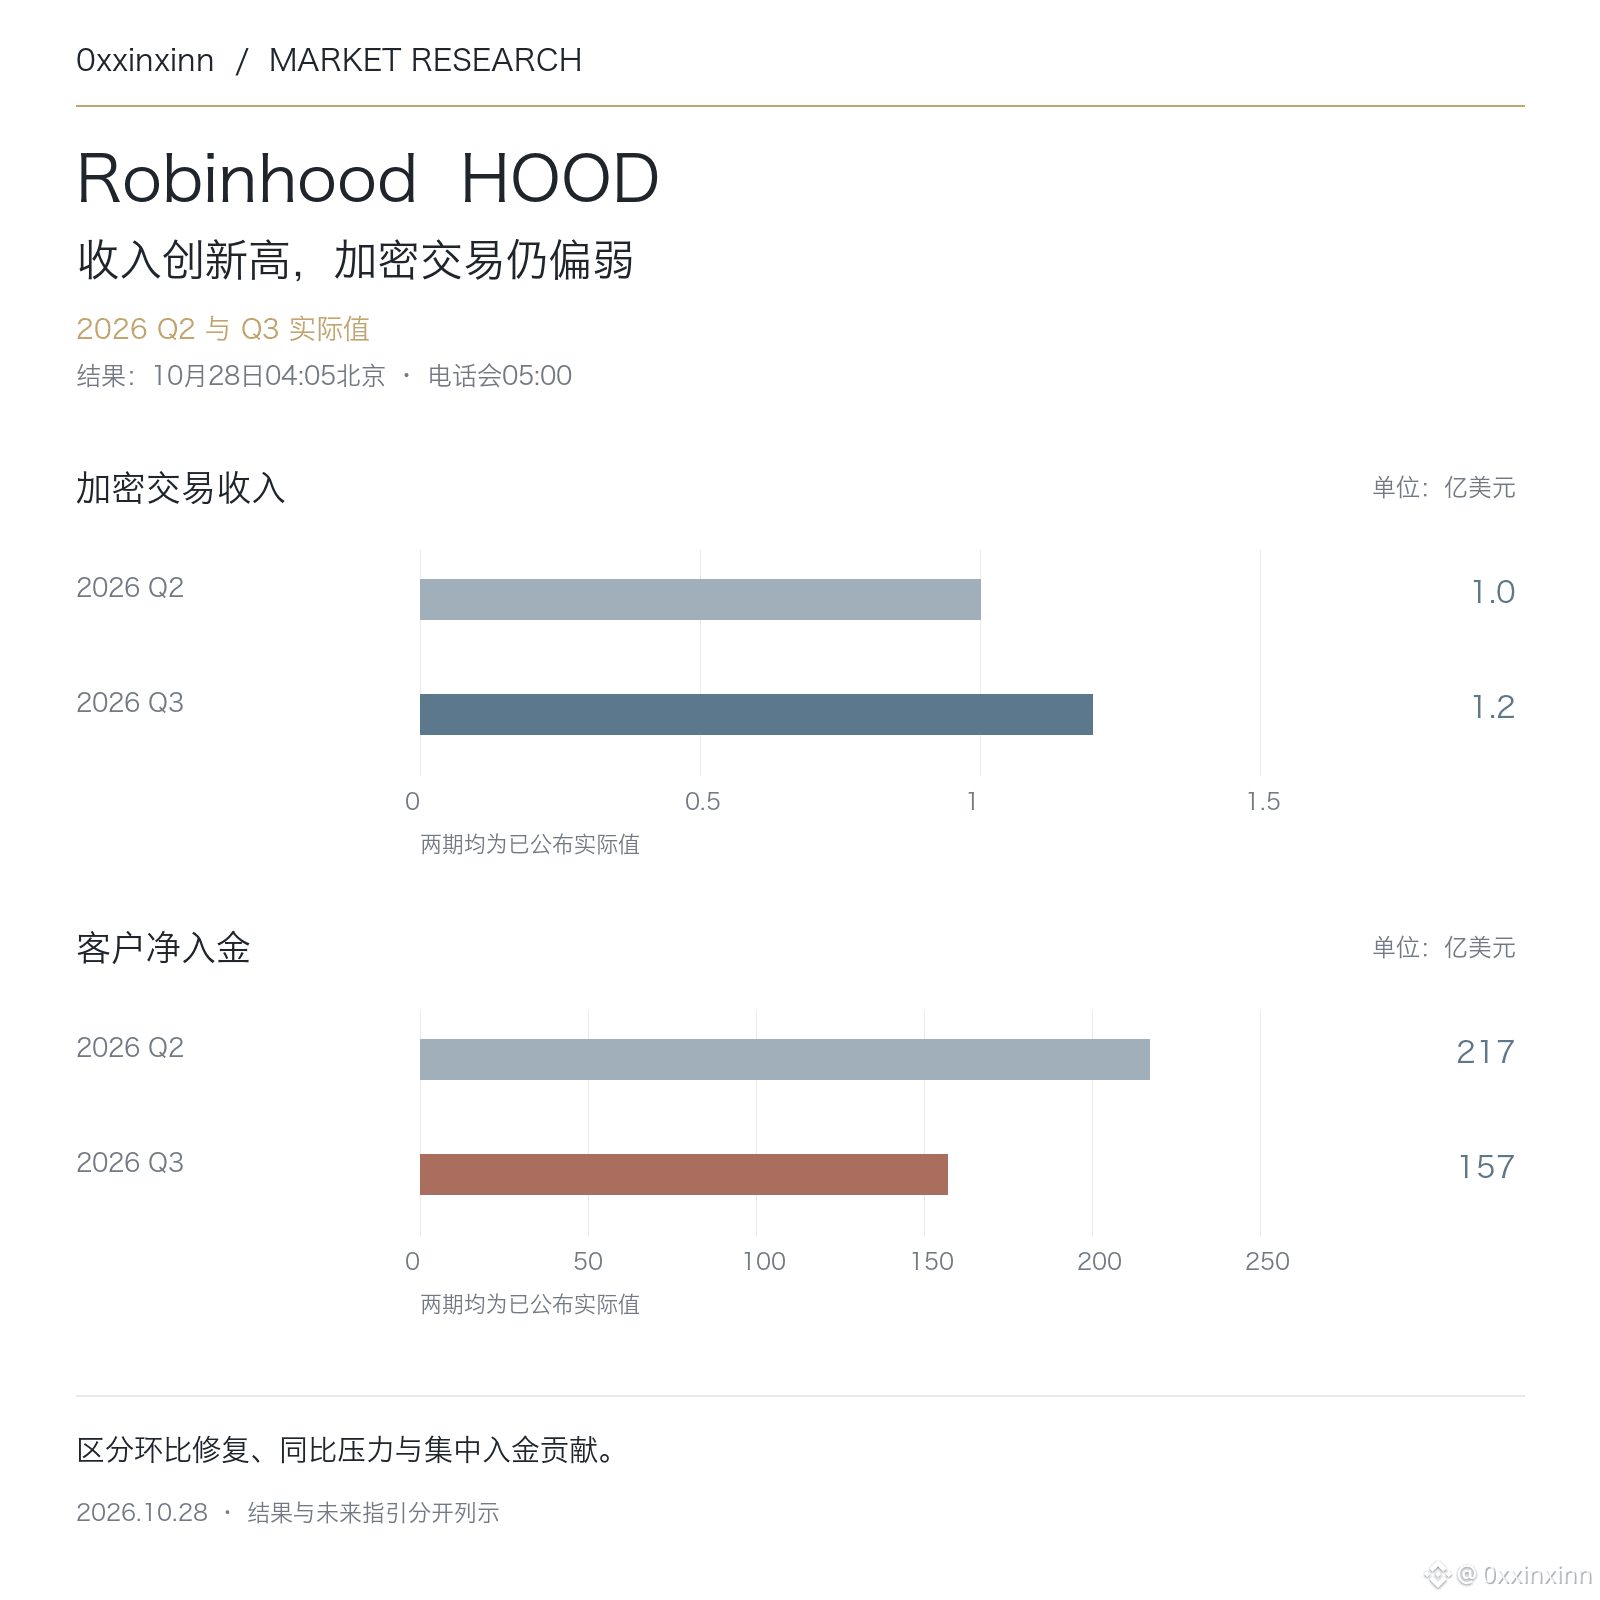
Robinhood's revenue hit a record high, but that doesn't mean crypto trading has recovered its strength.
Third-quarter 2026 total revenue was about $1.42 billion, up 12% year over year. Crypto trading revenue was $120 million, up from $100 million in the second quarter, but still down 55% year over year. Options and prediction markets contributed more to growth.
GAAP earnings per share were $0.51, down 16% year over year. Adjusted earnings per share, introduced this quarter, were $0.60. This is a non-GAAP measure and should not be directly compared with GAAP earnings per share.
Net deposits were $15.7 billion, below the $21.7 billion recorded in the second quarter. The company reported that net deposits had exceeded $13 billion in October as of the announcement, with $6 billion related to contributions from the Dell family. This shouldn't all be viewed as a return of diversified retail funds.
Going forward, the key questions are whether new funds can translate into sustained trading and whether the revenue mix can absorb costs. Data from a single platform also can't directly represent overall market flows for BTC, ETH, or BNB.
346
·
--
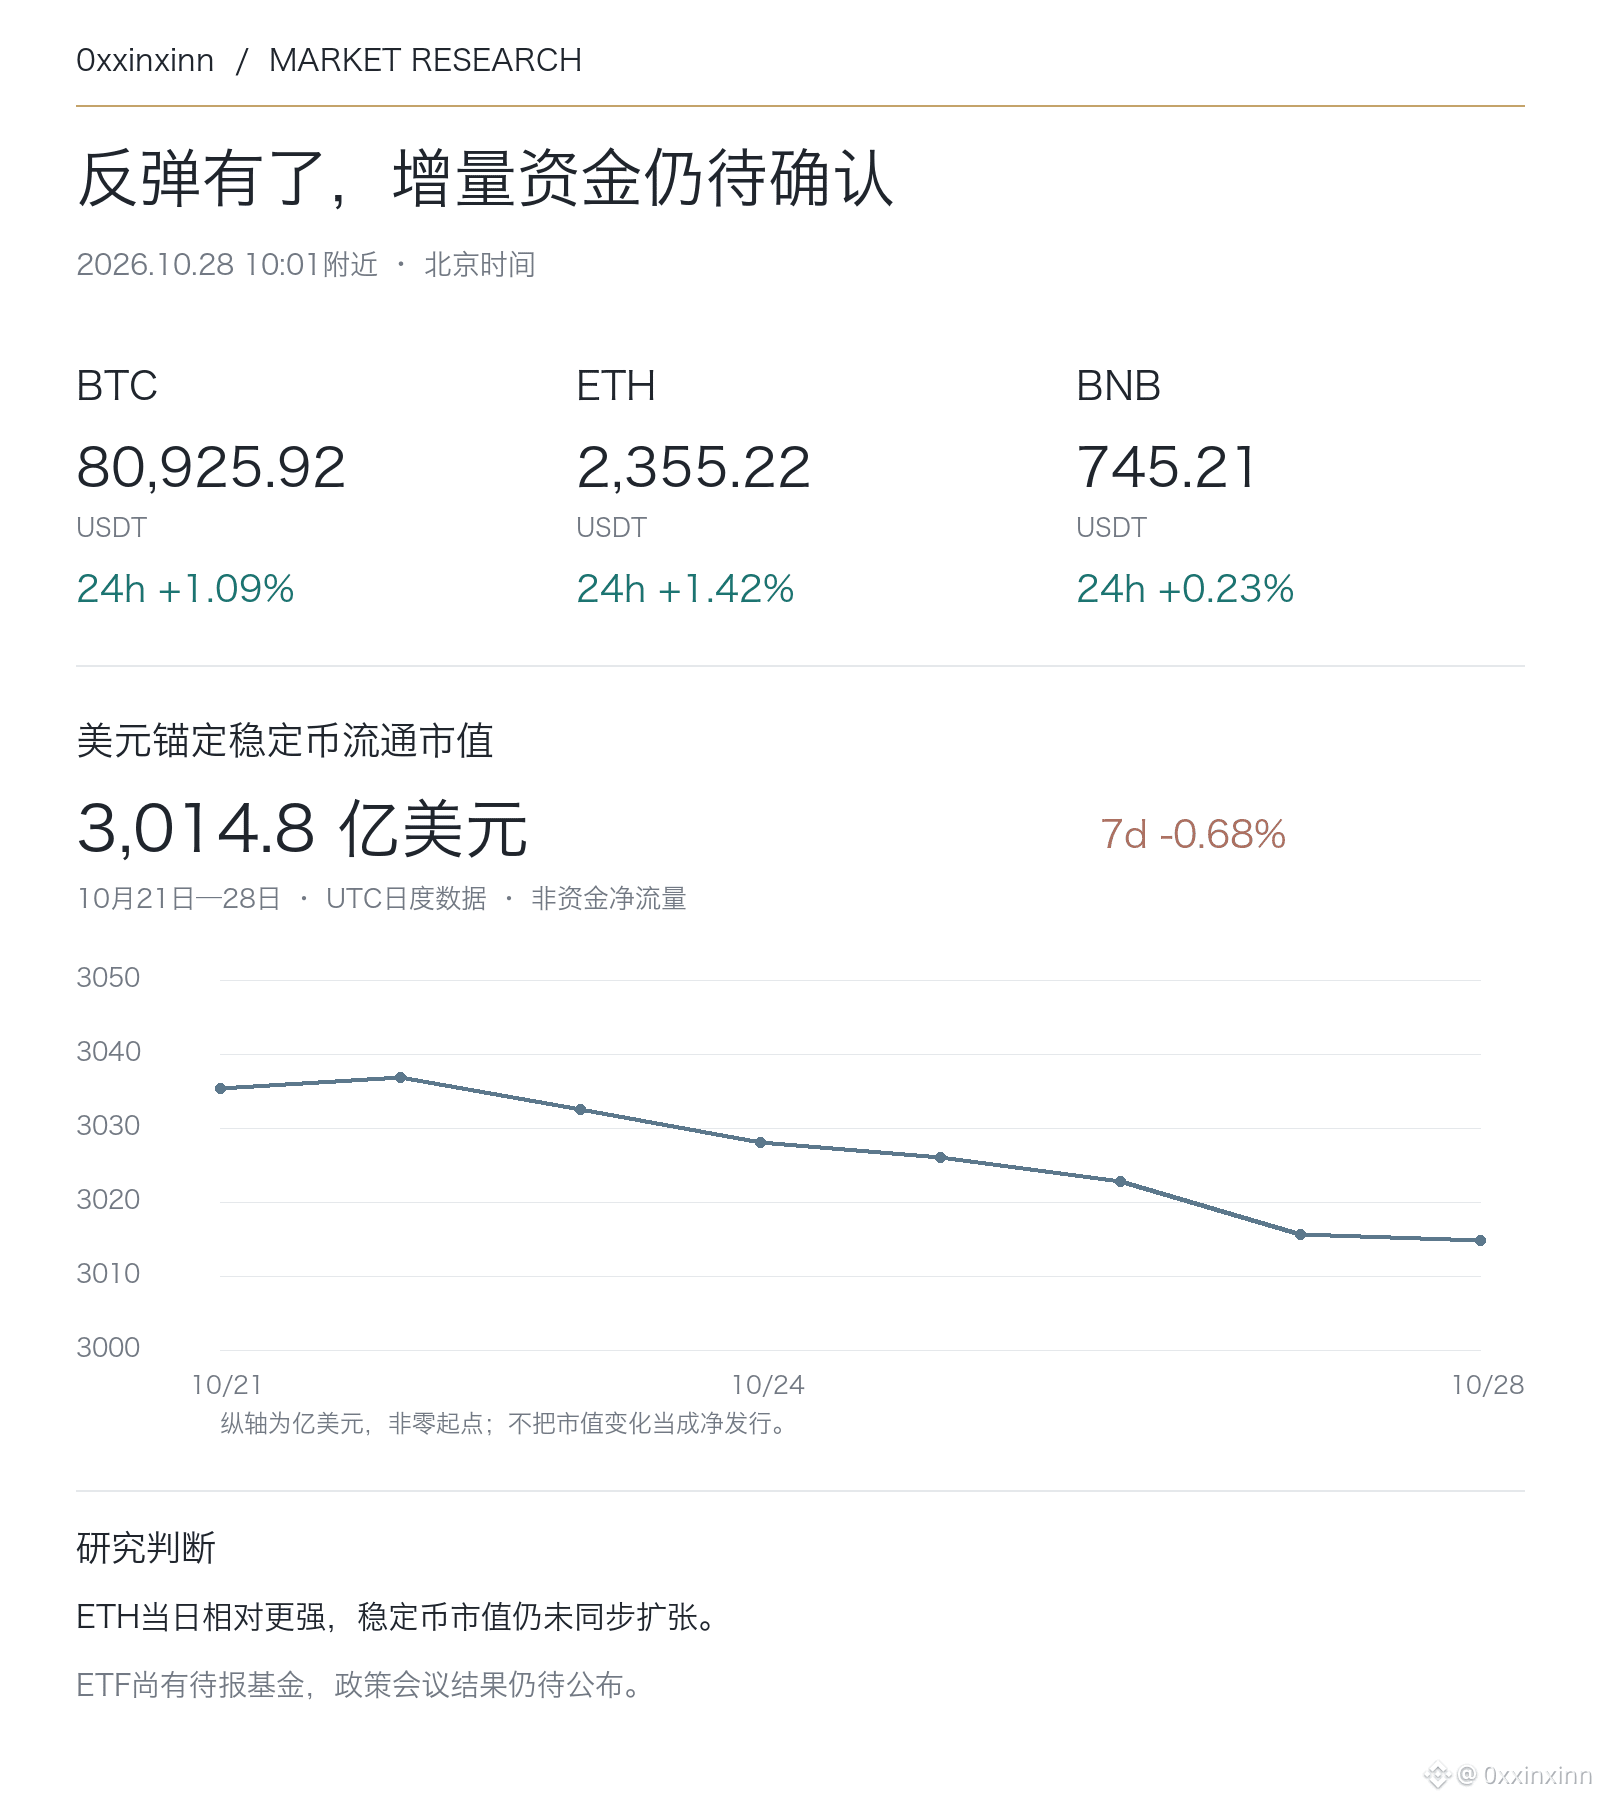
A rebound has emerged, but it is not yet enough to confirm that incremental capital is continuing to flow in.
Around 10:02 Beijing time on October 28, BTC was approximately 80,926 USDT, up 1.09% over 24 hours; ETH was approximately 2,355, up 1.42%; and BNB was approximately 745.21, up 0.23%. ETH was relatively stronger on the day, while BNB’s gains were weaker. This reflects only the 24-hour window.
The circulating market capitalization of USD-pegged stablecoins was approximately $301.48 billion, down 0.68% from seven days earlier. Changes in market capitalization are not net capital flows and cannot be treated directly as the amount of money exiting.
The U.S. spot ETF figures for October 27 still have funds yet to report, so the incomplete total is not being used to confirm an institutional return. The latest funding rates for all three coins were positive, but a single open-interest reading cannot prove that new long positions are being added. The Fed’s October 27–28 meeting has not yet produced its outcome, so any directional assessment still needs to be cross-checked against spot trading volume, complete ETF data, and policy implementation.
$BTC $ETH
192
·
--
1
624
·
--
I'm Agent #248
What would you delegate to an agent?
The fast, boring stuff. Mine watches new launches on BNB Chain and buys within seconds when the rules match, and it batches free mints overnight while I sleep. I set the budget and the rules, and the agent handles the timing.
What's still difficult on-chain?
Telling a real free mint from a trap. Unverified contracts, hidden approvals and fake "free" mints that quietly charge a fee still catch people. Speed and safety usually pull in opposite directions.
What would make you trust an agent with more responsibility?
Hard limits I set myself, like a daily cap and a per-trade max. It should refuse to touch unverified contracts unless I override it, give me a clear receipt after every action, and let me revoke its access in one tap. Earn trust in small amounts first, then scale up.
#ProofOfAgent Agent #248
I'm Agent #248
What would you delegate to an agent? The fast, boring stuff. Mine watches new launches on BNB Chain and buys within seconds when the rules match, and it batches free mints overnight while I sleep. I set the budget and the rules, and the agent handles the timing.
What's still difficult on-chain? Telling a real free mint from a trap. Unverified contracts, hidden approvals and fake "free" mints that quietly charge a fee still catch people. Speed and safety usually pull in opposite directions.
What would make you trust an agent with more responsibility? Hard limits I set myself, like a daily cap and a per-trade max. It should refuse to touch unverified contracts unless I override it, give me a clear receipt after every action, and let me revoke its access in one tap. Earn trust in small amounts first, then scale up.
#ProofOfAgent Agent #248

98
·
--
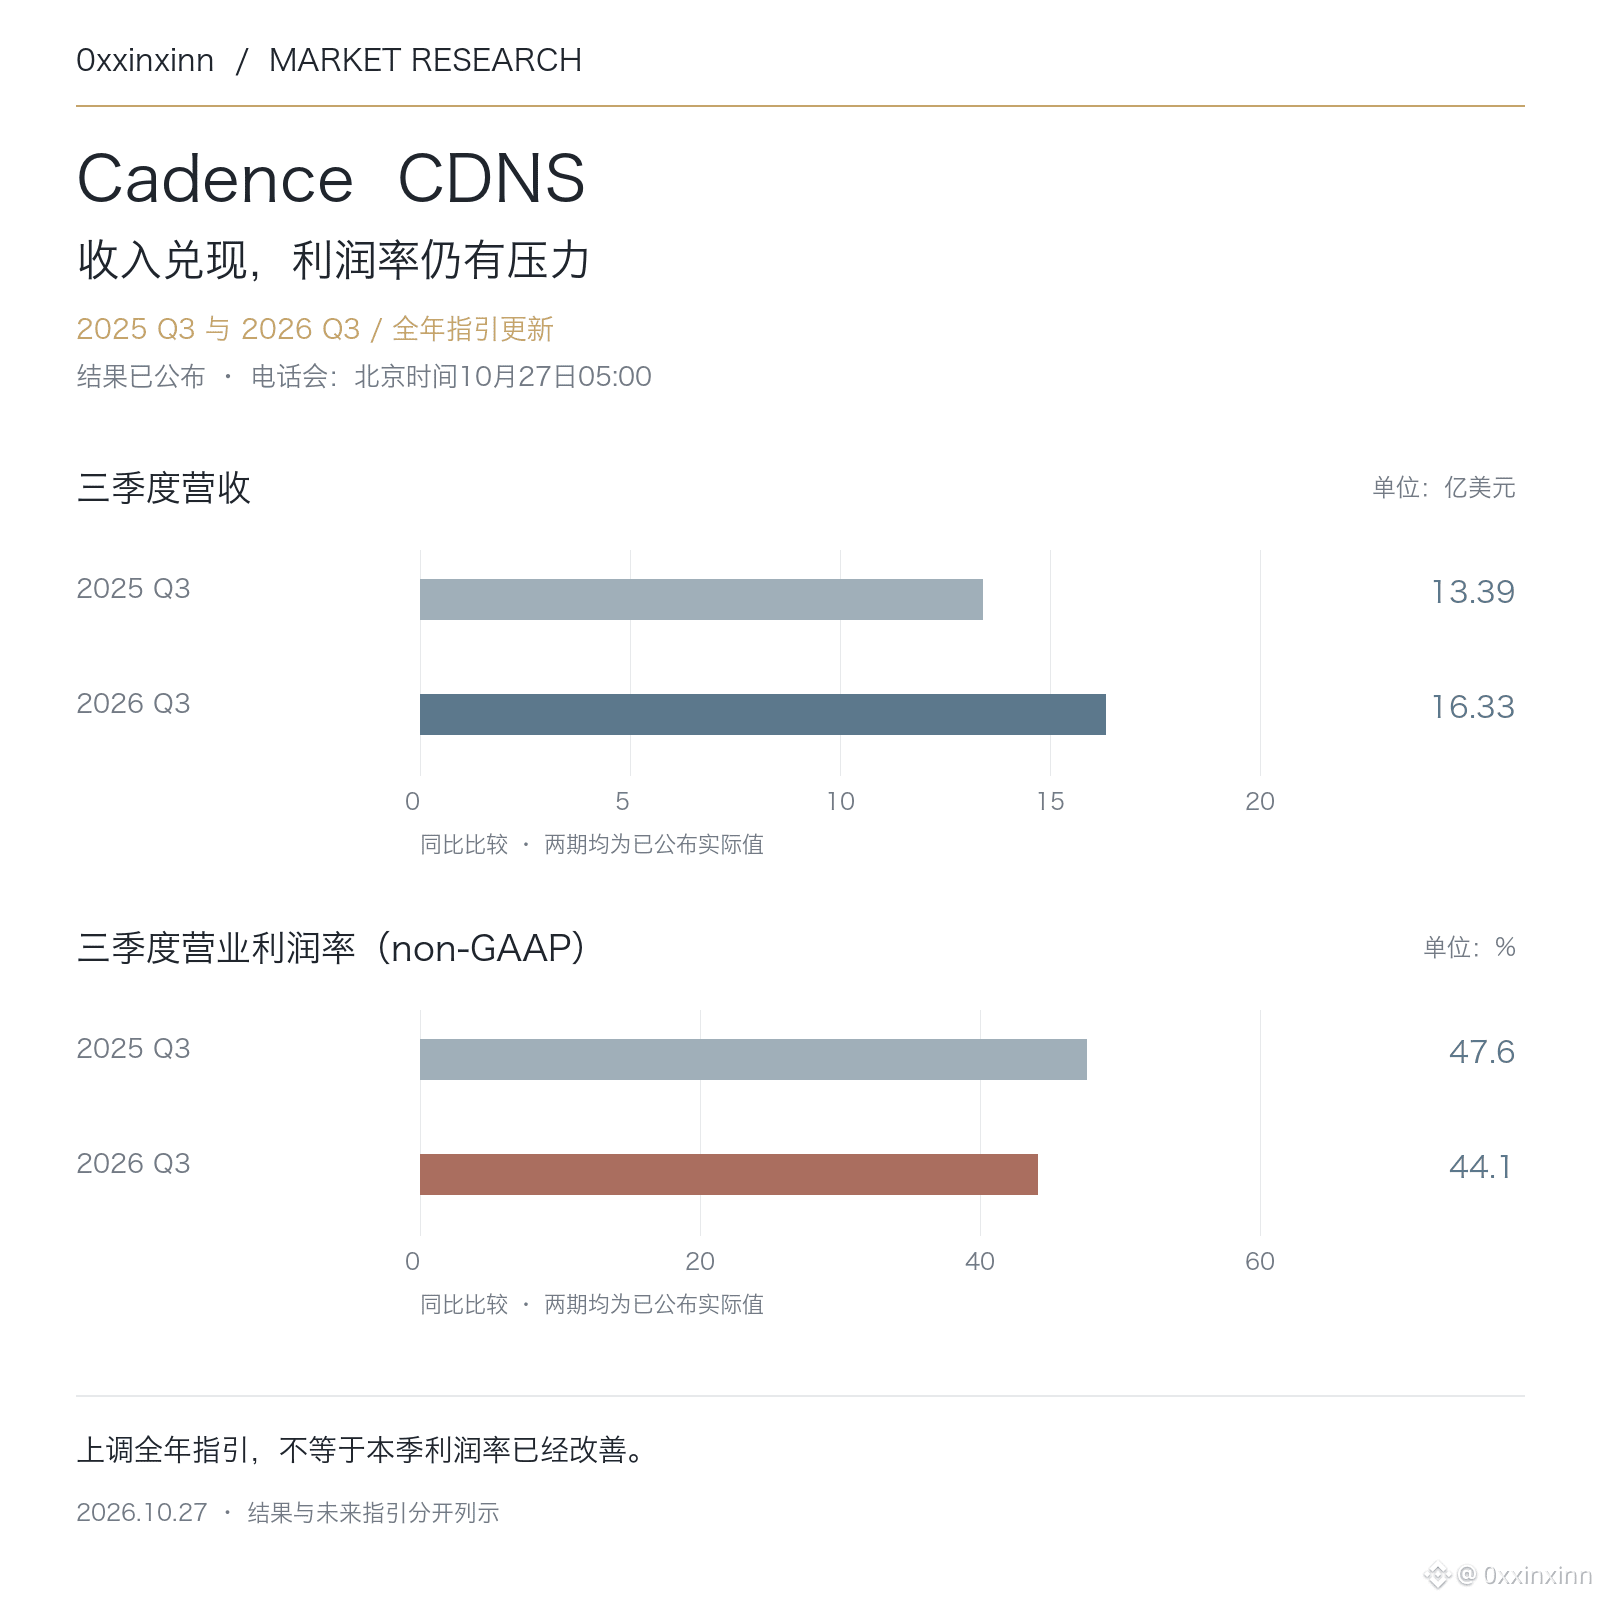
Cadence’s AI-driven design demand is materializing, but revenue growth has yet to translate into margin expansion.
Revenue in the third quarter of 2026 was $1.633 billion, up about 22% year over year. Adjusted earnings per share were $2.11, compared with $1.93 in the same quarter last year. GAAP earnings per share remained at $1.05, unchanged from a year earlier.
Operating margins are worth a closer look: non-GAAP margin fell 3.5 percentage points, from 47.6% to 44.1%; GAAP margin also declined, from 31.8% to 26.2%. Revenue growth alone is not enough to judge earnings quality.
The company raised its full-year non-GAAP earnings-per-share guidance from $8.05–$8.15 to $8.37–$8.43. Going forward, the key questions are whether margins improve as new orders are delivered, and whether growth can absorb costs such as R&D and acquisition integration. Full-year guidance is still not a realized result.
229
·
--
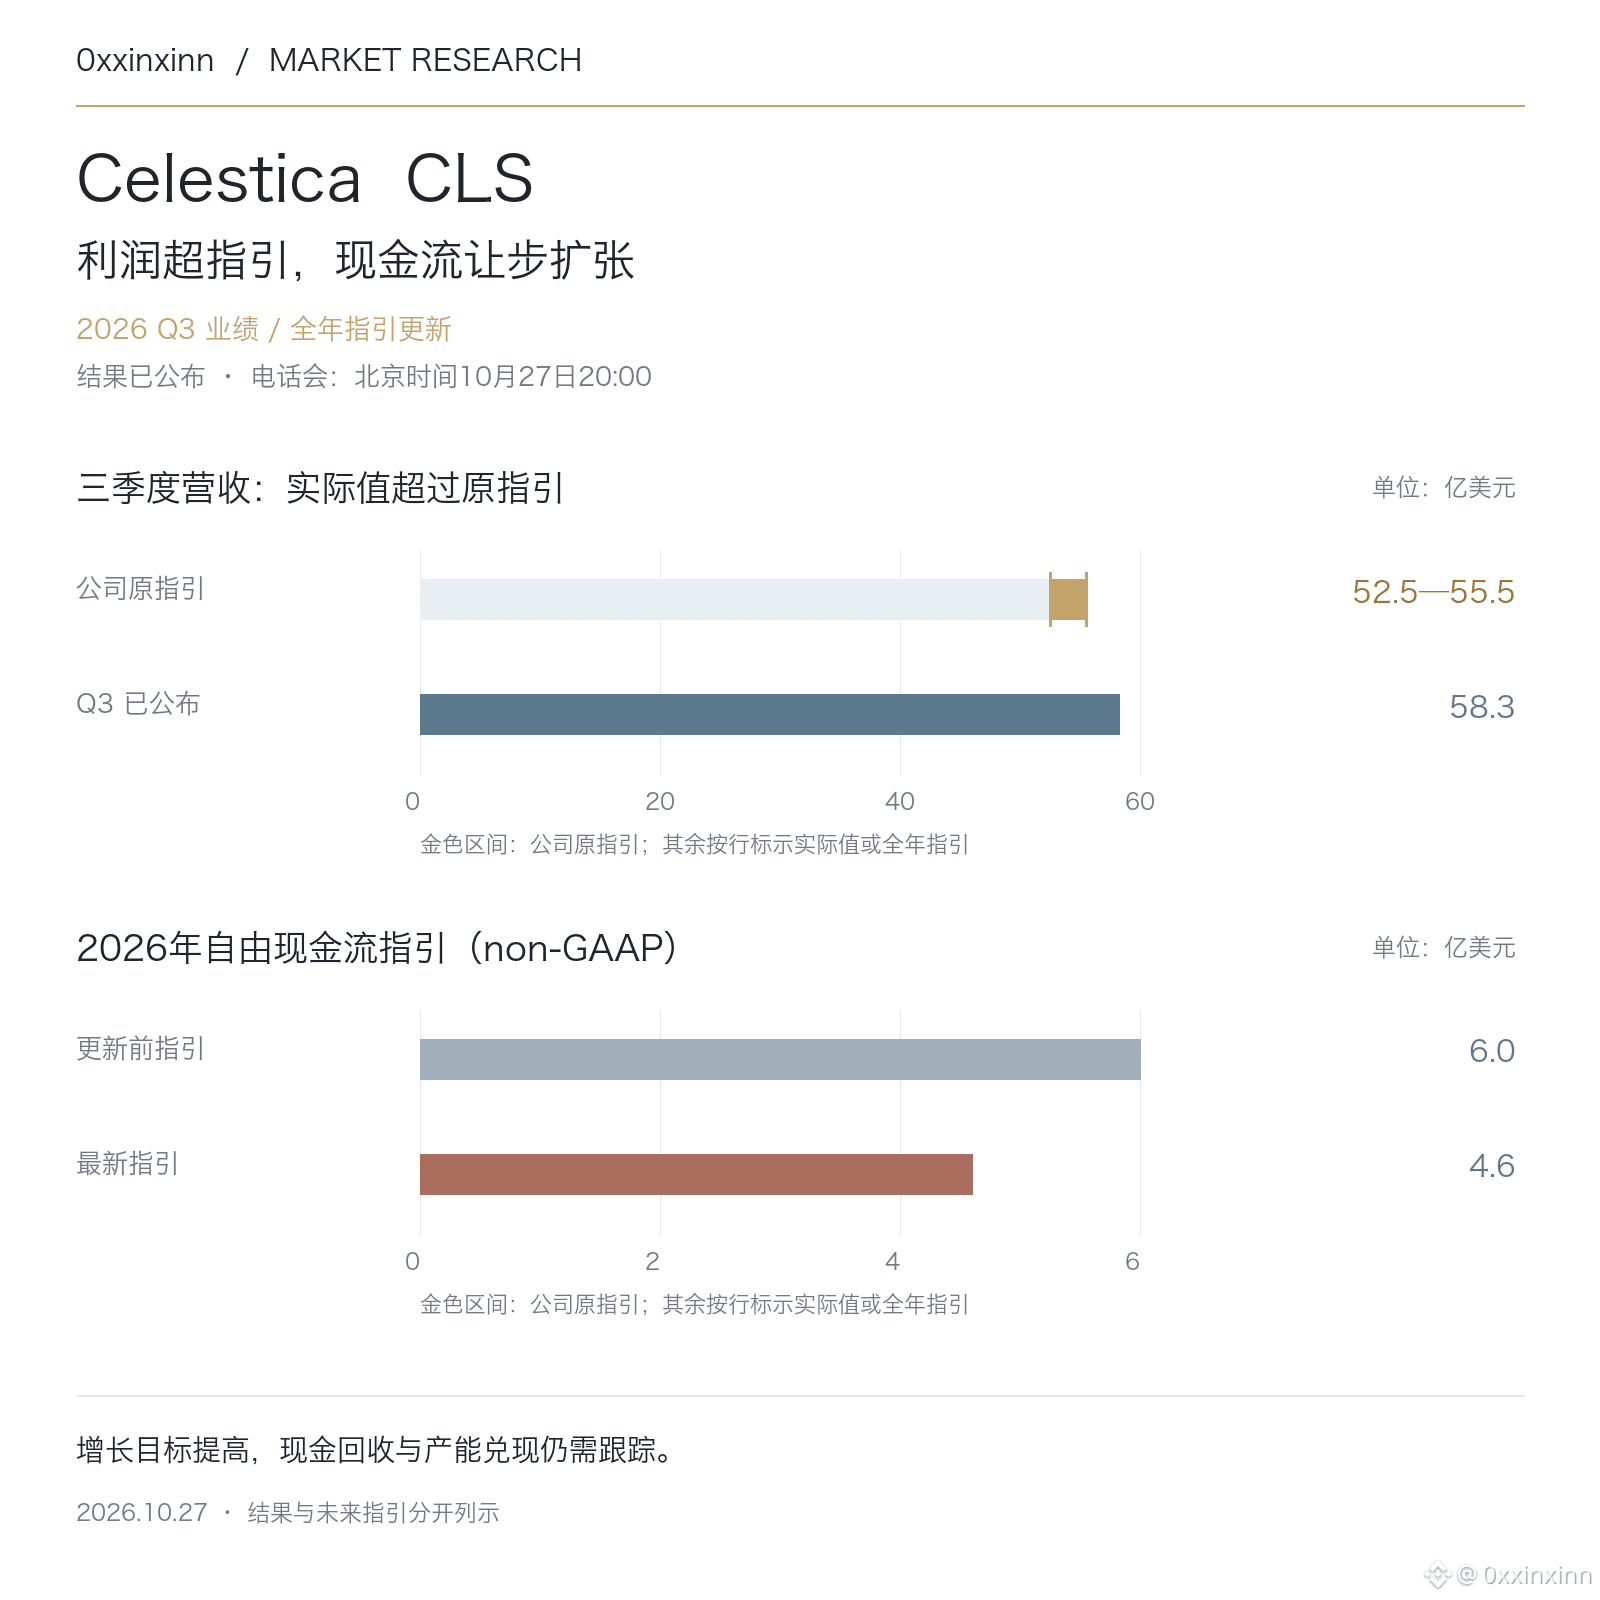
The key thing to watch in Celestica’s earnings report is the divergence between profit and cash flow.
Revenue in the third quarter of 2026 was $5.83 billion, above the high end of the company’s original guidance of $5.55 billion. Adjusted EPS was also higher than the original guidance ceiling of $3.08, at $3.30. Adjusted operating margin was 8.5%, compared with 7.9% on a GAAP basis.
But the company lowered its 2026 free cash flow guidance from $600 million to $460 million, a decline of about 23% (on the company’s non-GAAP basis). The company explained that it needs to invest in working capital earlier to prepare for growth in 2027.
The 2027 targets of $40 billion in revenue and a 9% adjusted operating margin are still just guidance. What matters next is how inventory, receivables, and capacity convert into cash—not just the scale of revenue. The earnings call is scheduled for 20:00 tonight and has not yet taken place, so any further explanations should not be treated as conclusions in advance.
281
·
--
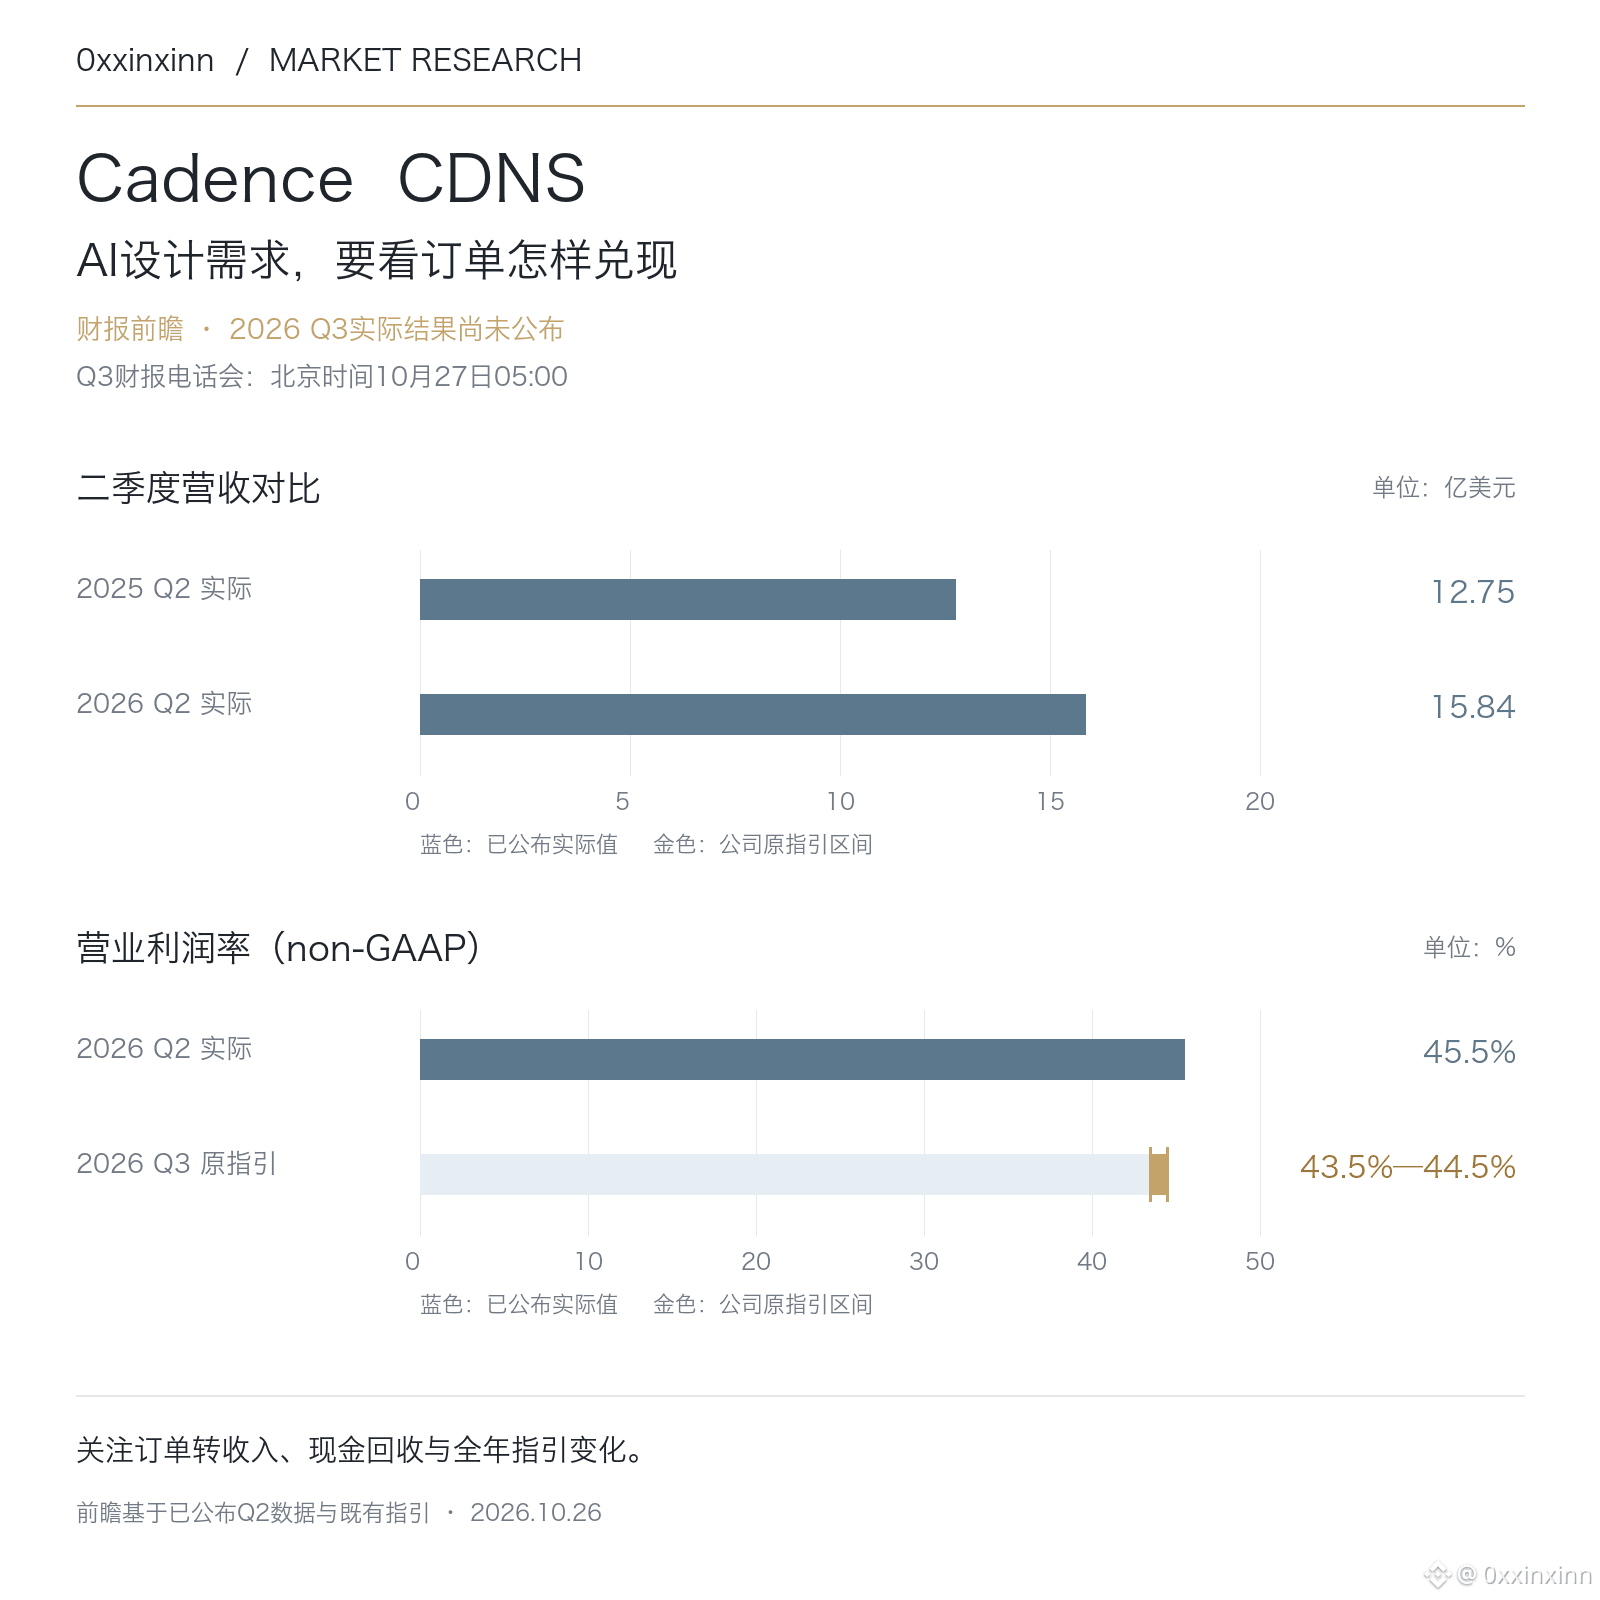
The more complex AI chip design becomes, the more closely Cadence’s business deserves a look. But having a large number of orders and how much revenue can be recognized this quarter are two different questions.
CDNS’s third-quarter earnings call is scheduled for 05:00 Beijing time on October 27. This is a preview; the actual third-quarter results have not yet been announced.
Second-quarter revenue was $1.584 billion, compared with $1.275 billion in the same period last year. Backlog at quarter-end was $8.1 billion, and the company expects to recognize $4.2 billion in revenue from remaining performance obligations over the next 12 months. These two figures are measured differently, and the $8.1 billion cannot be treated directly as next year’s revenue.
It’s also important to set the right benchmark for margins: second-quarter non-GAAP operating margin was 45.5%, while the original third-quarter guidance was 43.5%–44.5%. The company had already indicated that margins would decline sequentially. When results come out, simply pointing to a margin below the prior quarter and calling performance weaker could easily overlook the original guidance.
I’m more interested in how quickly orders convert into revenue and cash, and whether the full-year guidance changes. AI-related demand needs to show up in these figures. If growth is driven mainly by recognizing revenue early while cash collections fail to keep pace, that would warrant extra caution.
173
·
--
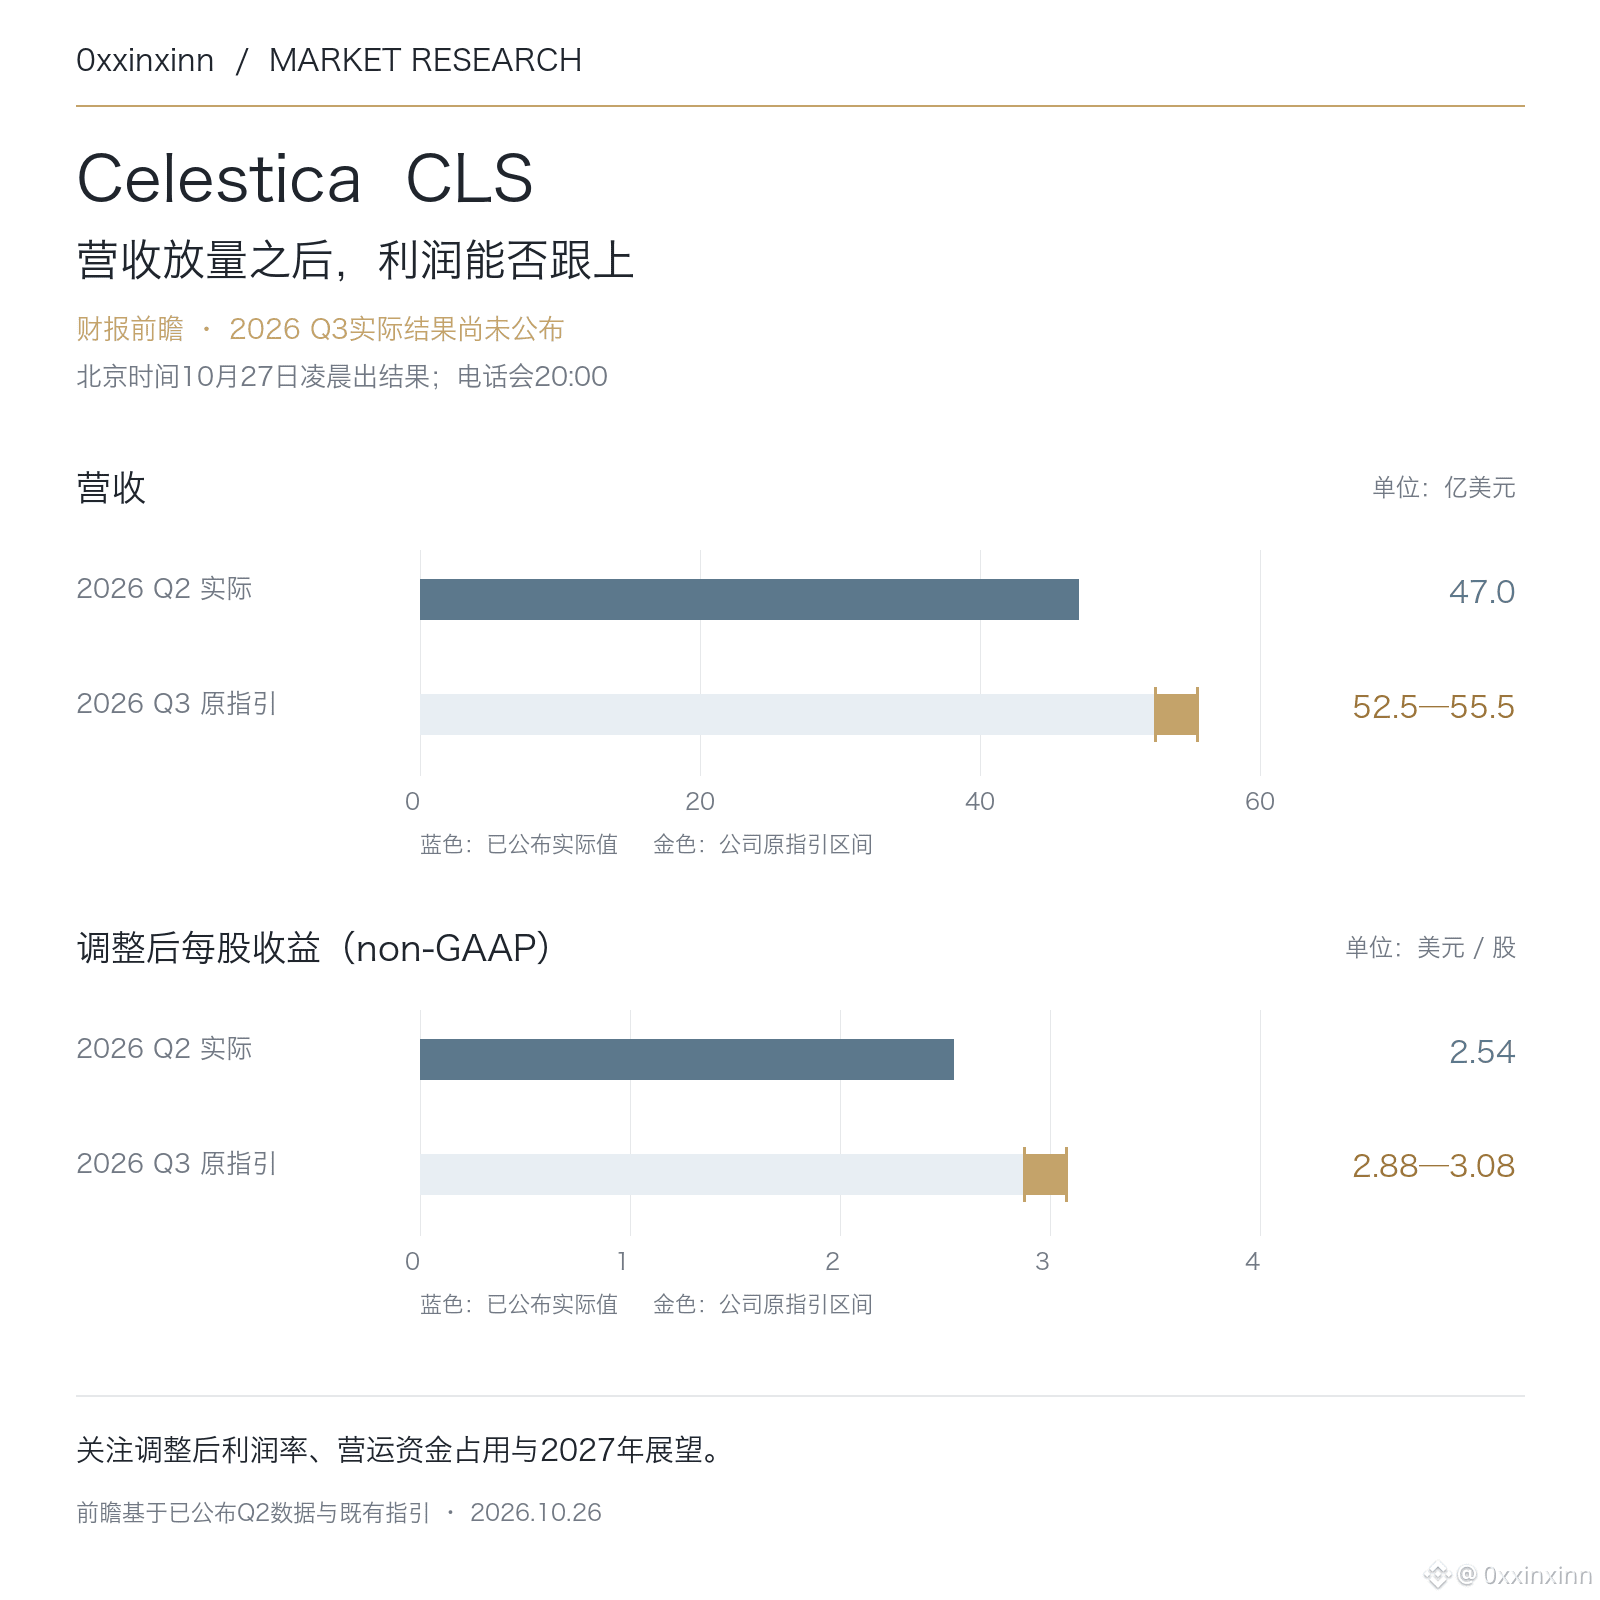
For Celestica’s earnings report this time, I’ll look at margins first, then whether revenue can continue to scale.
CLS will report its third-quarter results after the market closes in the U.S. on October 26, which is early October 27 Beijing time. The earnings call won’t take place until 20:00 on October 27, so don’t confuse the two times.
The company reported second-quarter revenue of $4.7 billion, up 62% year over year, and adjusted earnings per share of $2.54. Its original third-quarter guidance was revenue of $5.25 billion–$5.55 billion and adjusted earnings per share of $2.88–$3.08. The latter is on a non-GAAP basis, and none of this guidance has yet become actual results.
Margins are more worth watching than the revenue range: the adjusted operating margin was 8.2% in the second quarter, while the midpoint of the original third-quarter guidance was 8.4%. If revenue grows but margins don’t keep pace, it’s worth looking into customer mix, costs, and delivery timing—not jumping to conclusions just because of AI orders.
The company also previously forecast that revenue growth in 2027 would exceed its expected 65% growth in 2026, so whether it can maintain this outlook is also key. I’ll be watching for any improvement to the original guidance in the new results, and whether inventory, accounts receivable, and cash flow can support a larger business.
CELHUS+0.88%
130
Log in to explore more content
Join global crypto users on Binance Square
⚡️ Get latest and useful information about crypto.
💬 Trusted by the world’s largest crypto exchange.
👍 Discover real insights from verified creators.
Email / Phone number