【Price Action Structure】
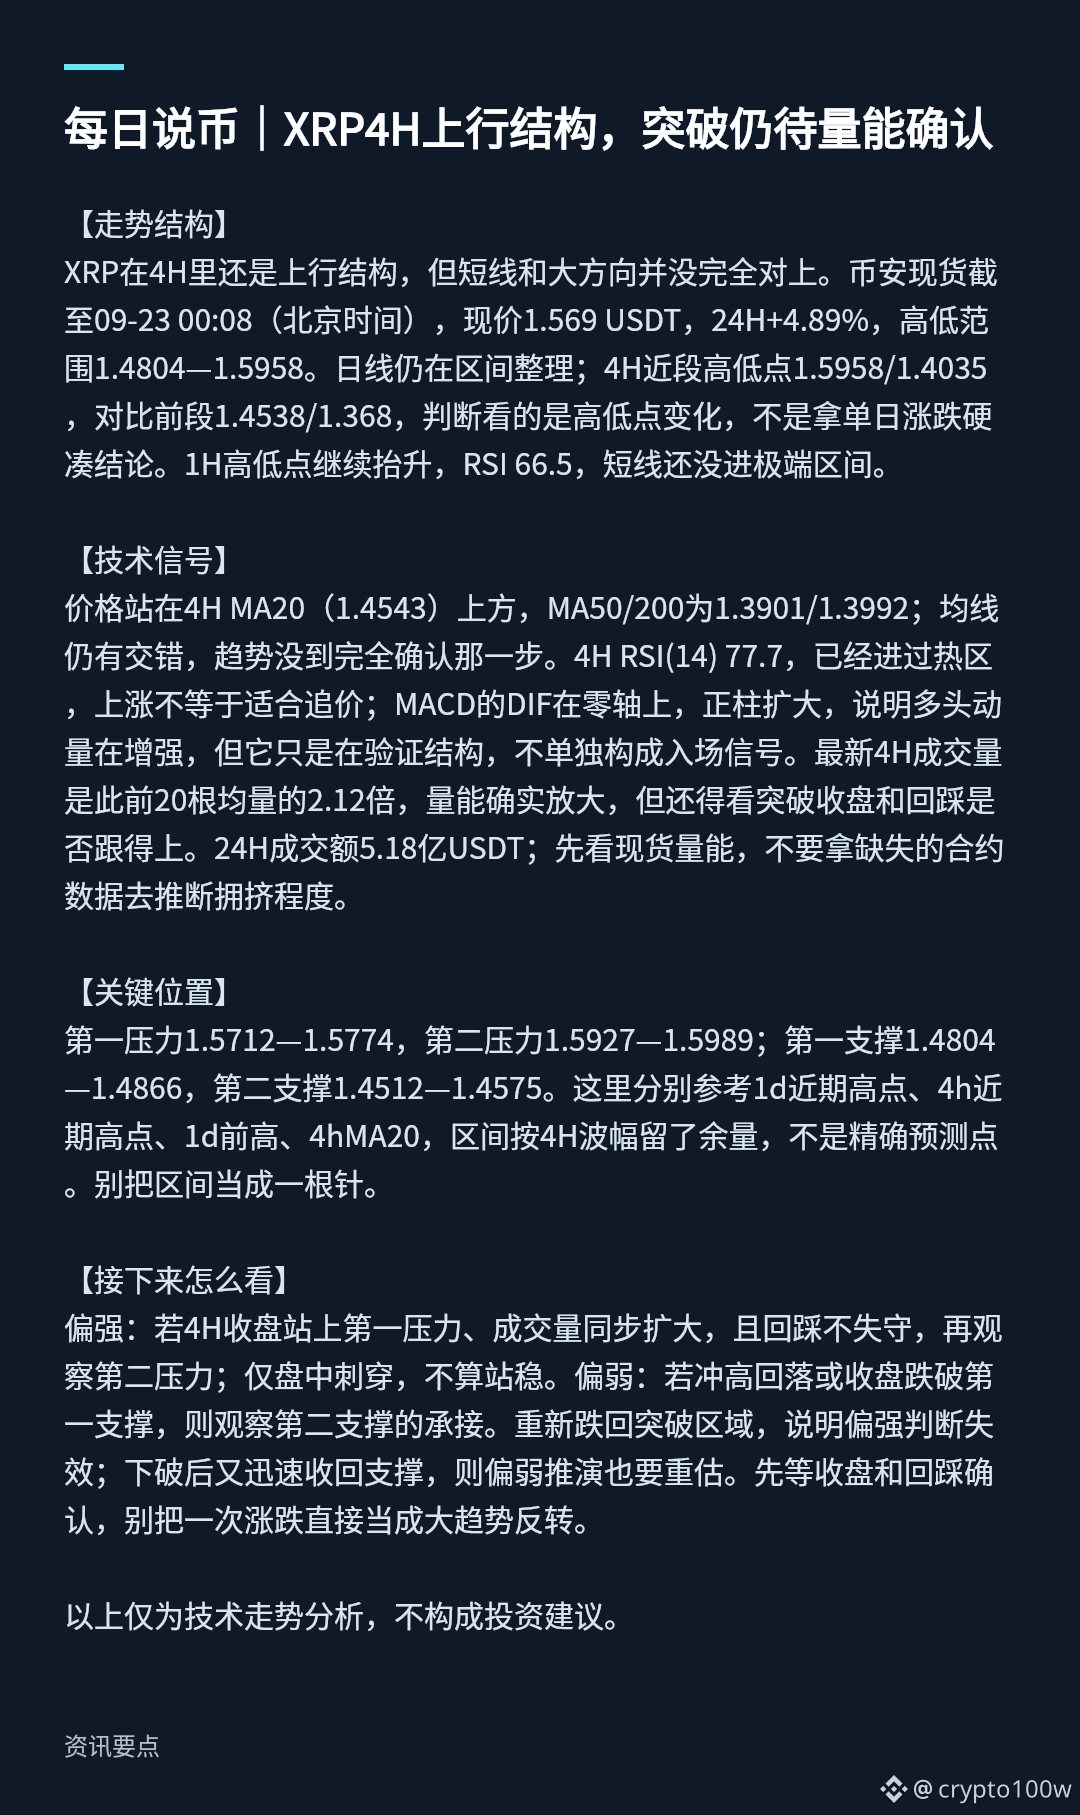
XRP is still in an upward structure on the 4H timeframe, but the short-term move and the bigger direction haven’t fully aligned yet. As of 09-23 00:08 (Beijing time), XRP spot on Binance is trading at 1.569 USDT, up +4.89% over the past 24H. The high-low range is 1.4804—1.5958. The daily chart is still consolidating within a range. On the 4H chart, the recent high/low points are 1.5958/1.4035; compared with the earlier segment’s 1.4538/1.368, the conclusion is based on changes in high/low points—not forcing a takeaway from a single day’s gain or loss.
On the 1H chart, the high/low points continue to rise. RSI is 66.5, and the short-term momentum hasn’t reached an extreme zone yet.
【Technical Signals】
Price is above the 4H MA20 (1.4543). MA50/200 are at 1.3901/1.3992. The moving averages are still intertwined, meaning the trend hasn’t been fully confirmed. 4H RSI (14) is 77.7, already into an overbought area; an up move doesn’t automatically mean it’s suitable to chase price. MACD’s DIF is around the zero line, and the positive histogram bars are expanding—this suggests increasing bullish momentum—but it only validates the structure; it doesn’t independently serve as an entry signal. The latest 4H trading volume is 2.12 times the average volume of the previous 20 bars. Volume has indeed expanded, but you still need to see whether the breakout’s close is solid and whether pullbacks are holding. 24H trading volume is 518 million USDT. First, focus on the spot volume; don’t infer “crowdedness” from missing derivatives/contract data.
【Key Levels】
First resistance: 1.5712—1.5774. Second resistance: 1.5927—1.5989. First support: 1.4804—1.4866. Second support: 1.4512—1.4575.
Here, you can reference the recent 1D high, the recent 4H high, the prior 1D high, and the 4H MA20. The ranges include a buffer based on the 4H swing amplitude, so they’re not precise forecast points. Don’t treat the range like a single needle-point.
【What to Watch Next】
More bullish: If the 4H closes above the first resistance with volume expanding in sync, and the pullback doesn’t break down, then watch the second resistance next. Intraday piercings alone don’t count as holding.
Less bullish: If it rallies then falls back, or the close breaks below the first support, then watch the second support for how it holds. If it drops back into the breakout zone, that means the bullish interpretation fails. If it then falls below and quickly reclaims the support, the bearish scenario also needs to be reassessed. Wait for the close and pullback confirmation first; don’t treat a single up/down move as an immediate large-scale trend reversal.
The above is only technical price-action analysis and does not constitute investment advice.
XRP is still in an upward structure on the 4H timeframe, but the short-term move and the bigger direction haven’t fully aligned yet. As of 09-23 00:08 (Beijing time), XRP spot on Binance is trading at 1.569 USDT, up +4.89% over the past 24H. The high-low range is 1.4804—1.5958. The daily chart is still consolidating within a range. On the 4H chart, the recent high/low points are 1.5958/1.4035; compared with the earlier segment’s 1.4538/1.368, the conclusion is based on changes in high/low points—not forcing a takeaway from a single day’s gain or loss.
On the 1H chart, the high/low points continue to rise. RSI is 66.5, and the short-term momentum hasn’t reached an extreme zone yet.
【Technical Signals】
Price is above the 4H MA20 (1.4543). MA50/200 are at 1.3901/1.3992. The moving averages are still intertwined, meaning the trend hasn’t been fully confirmed. 4H RSI (14) is 77.7, already into an overbought area; an up move doesn’t automatically mean it’s suitable to chase price. MACD’s DIF is around the zero line, and the positive histogram bars are expanding—this suggests increasing bullish momentum—but it only validates the structure; it doesn’t independently serve as an entry signal. The latest 4H trading volume is 2.12 times the average volume of the previous 20 bars. Volume has indeed expanded, but you still need to see whether the breakout’s close is solid and whether pullbacks are holding. 24H trading volume is 518 million USDT. First, focus on the spot volume; don’t infer “crowdedness” from missing derivatives/contract data.
【Key Levels】
First resistance: 1.5712—1.5774. Second resistance: 1.5927—1.5989. First support: 1.4804—1.4866. Second support: 1.4512—1.4575.
Here, you can reference the recent 1D high, the recent 4H high, the prior 1D high, and the 4H MA20. The ranges include a buffer based on the 4H swing amplitude, so they’re not precise forecast points. Don’t treat the range like a single needle-point.
【What to Watch Next】
More bullish: If the 4H closes above the first resistance with volume expanding in sync, and the pullback doesn’t break down, then watch the second resistance next. Intraday piercings alone don’t count as holding.
Less bullish: If it rallies then falls back, or the close breaks below the first support, then watch the second support for how it holds. If it drops back into the breakout zone, that means the bullish interpretation fails. If it then falls below and quickly reclaims the support, the bearish scenario also needs to be reassessed. Wait for the close and pullback confirmation first; don’t treat a single up/down move as an immediate large-scale trend reversal.
The above is only technical price-action analysis and does not constitute investment advice.