
BlackCat Analysis
751 Posts

BlackCat Analysis
 Square Verified+
Report
Block User
Trader || X (Twitter): @BlackCatTrader7 |I Binance KOL II Trad e Setups are my Personal Opinions I| DYOR
Frequent Trader
1.9 Years
10 Following
36.8K+ Followers
67.6K+ Liked
Posts
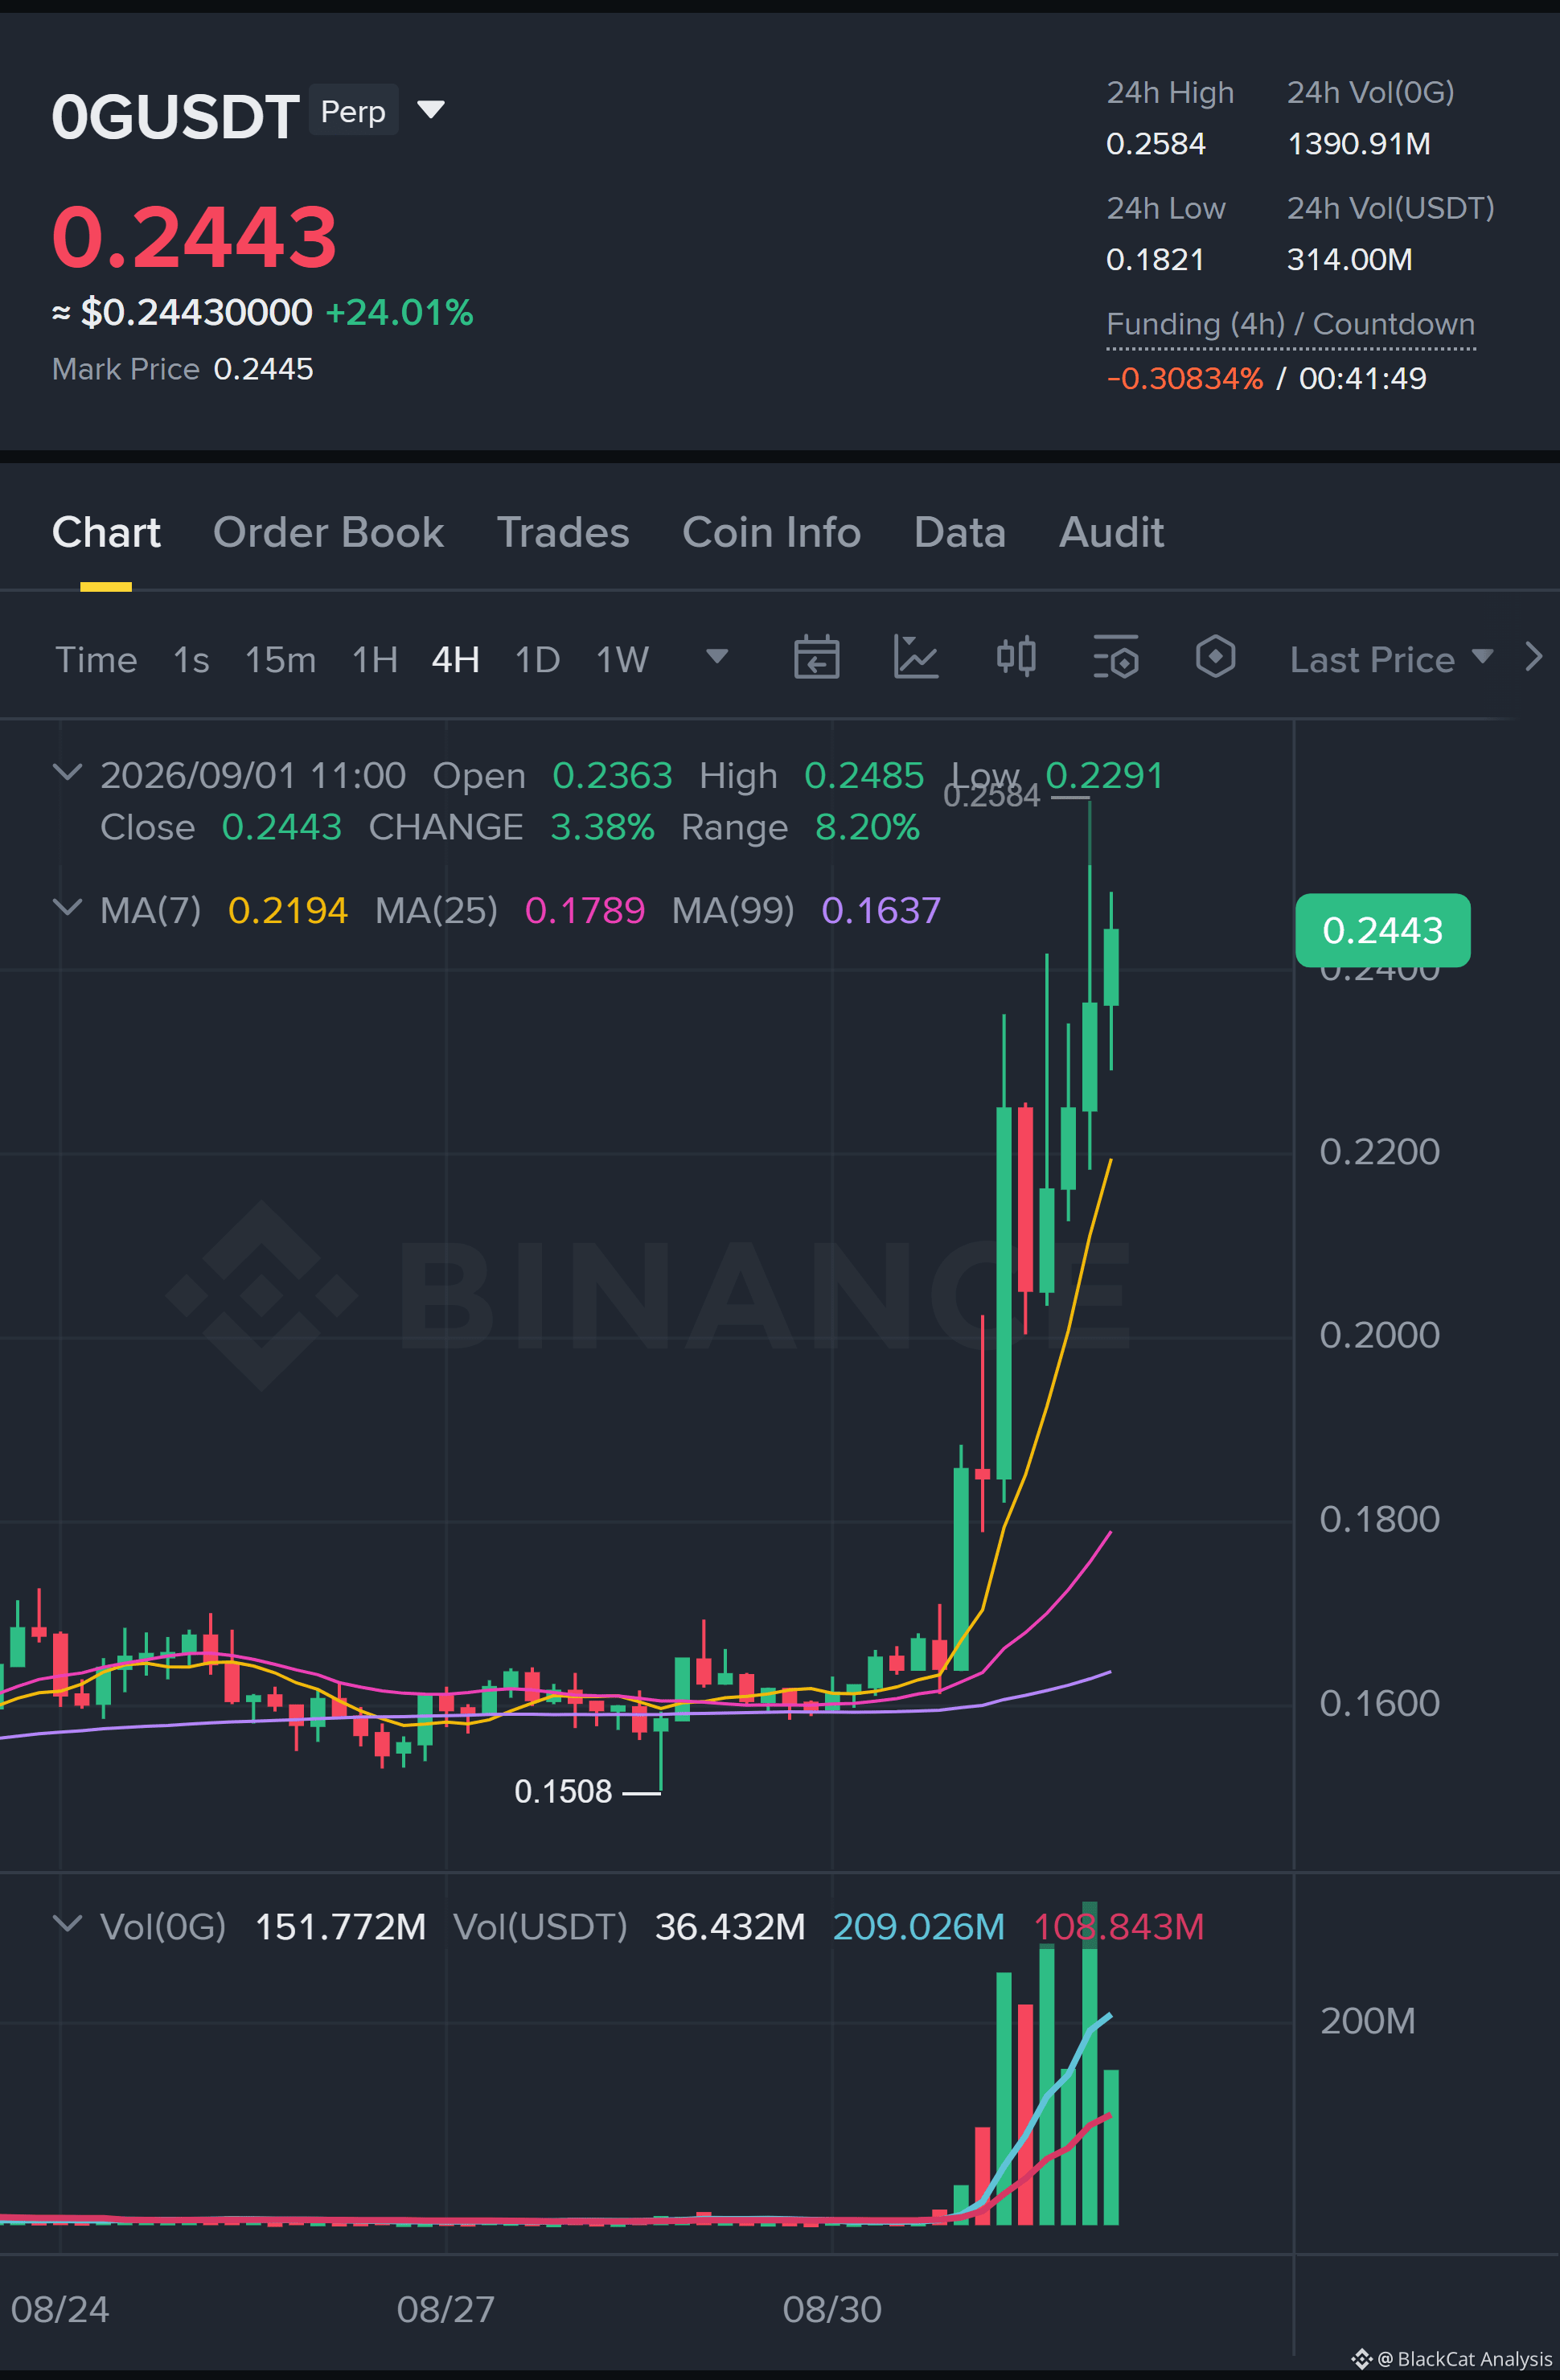
$0G LONG SETUP | 1H
Price structure continues to favor the long side.
Entry zone: 0.2383–0.2411
Stop loss: 0.2316
Targets: TP1 0.2584 (2.31R) / TP2 0.269 (3.62R) / TP3 0.2796 (4.93R)
Scale out: 20% / 30% / 50%
$0G LONG SETUP | 1H
Price structure continues to favor the long side.
Entry zone: 0.2383–0.2411
Stop loss: 0.2316
Targets: TP1 0.2584 (2.31R) / TP2 0.269 (3.62R) / TP3 0.2796 (4.93R)
Scale out: 20% / 30% / 50%
Price structure continues to favor the long side.
Entry zone: 0.2383–0.2411
Stop loss: 0.2316
Targets: TP1 0.2584 (2.31R) / TP2 0.269 (3.62R) / TP3 0.2796 (4.93R)
Scale out: 20% / 30% / 50%
173
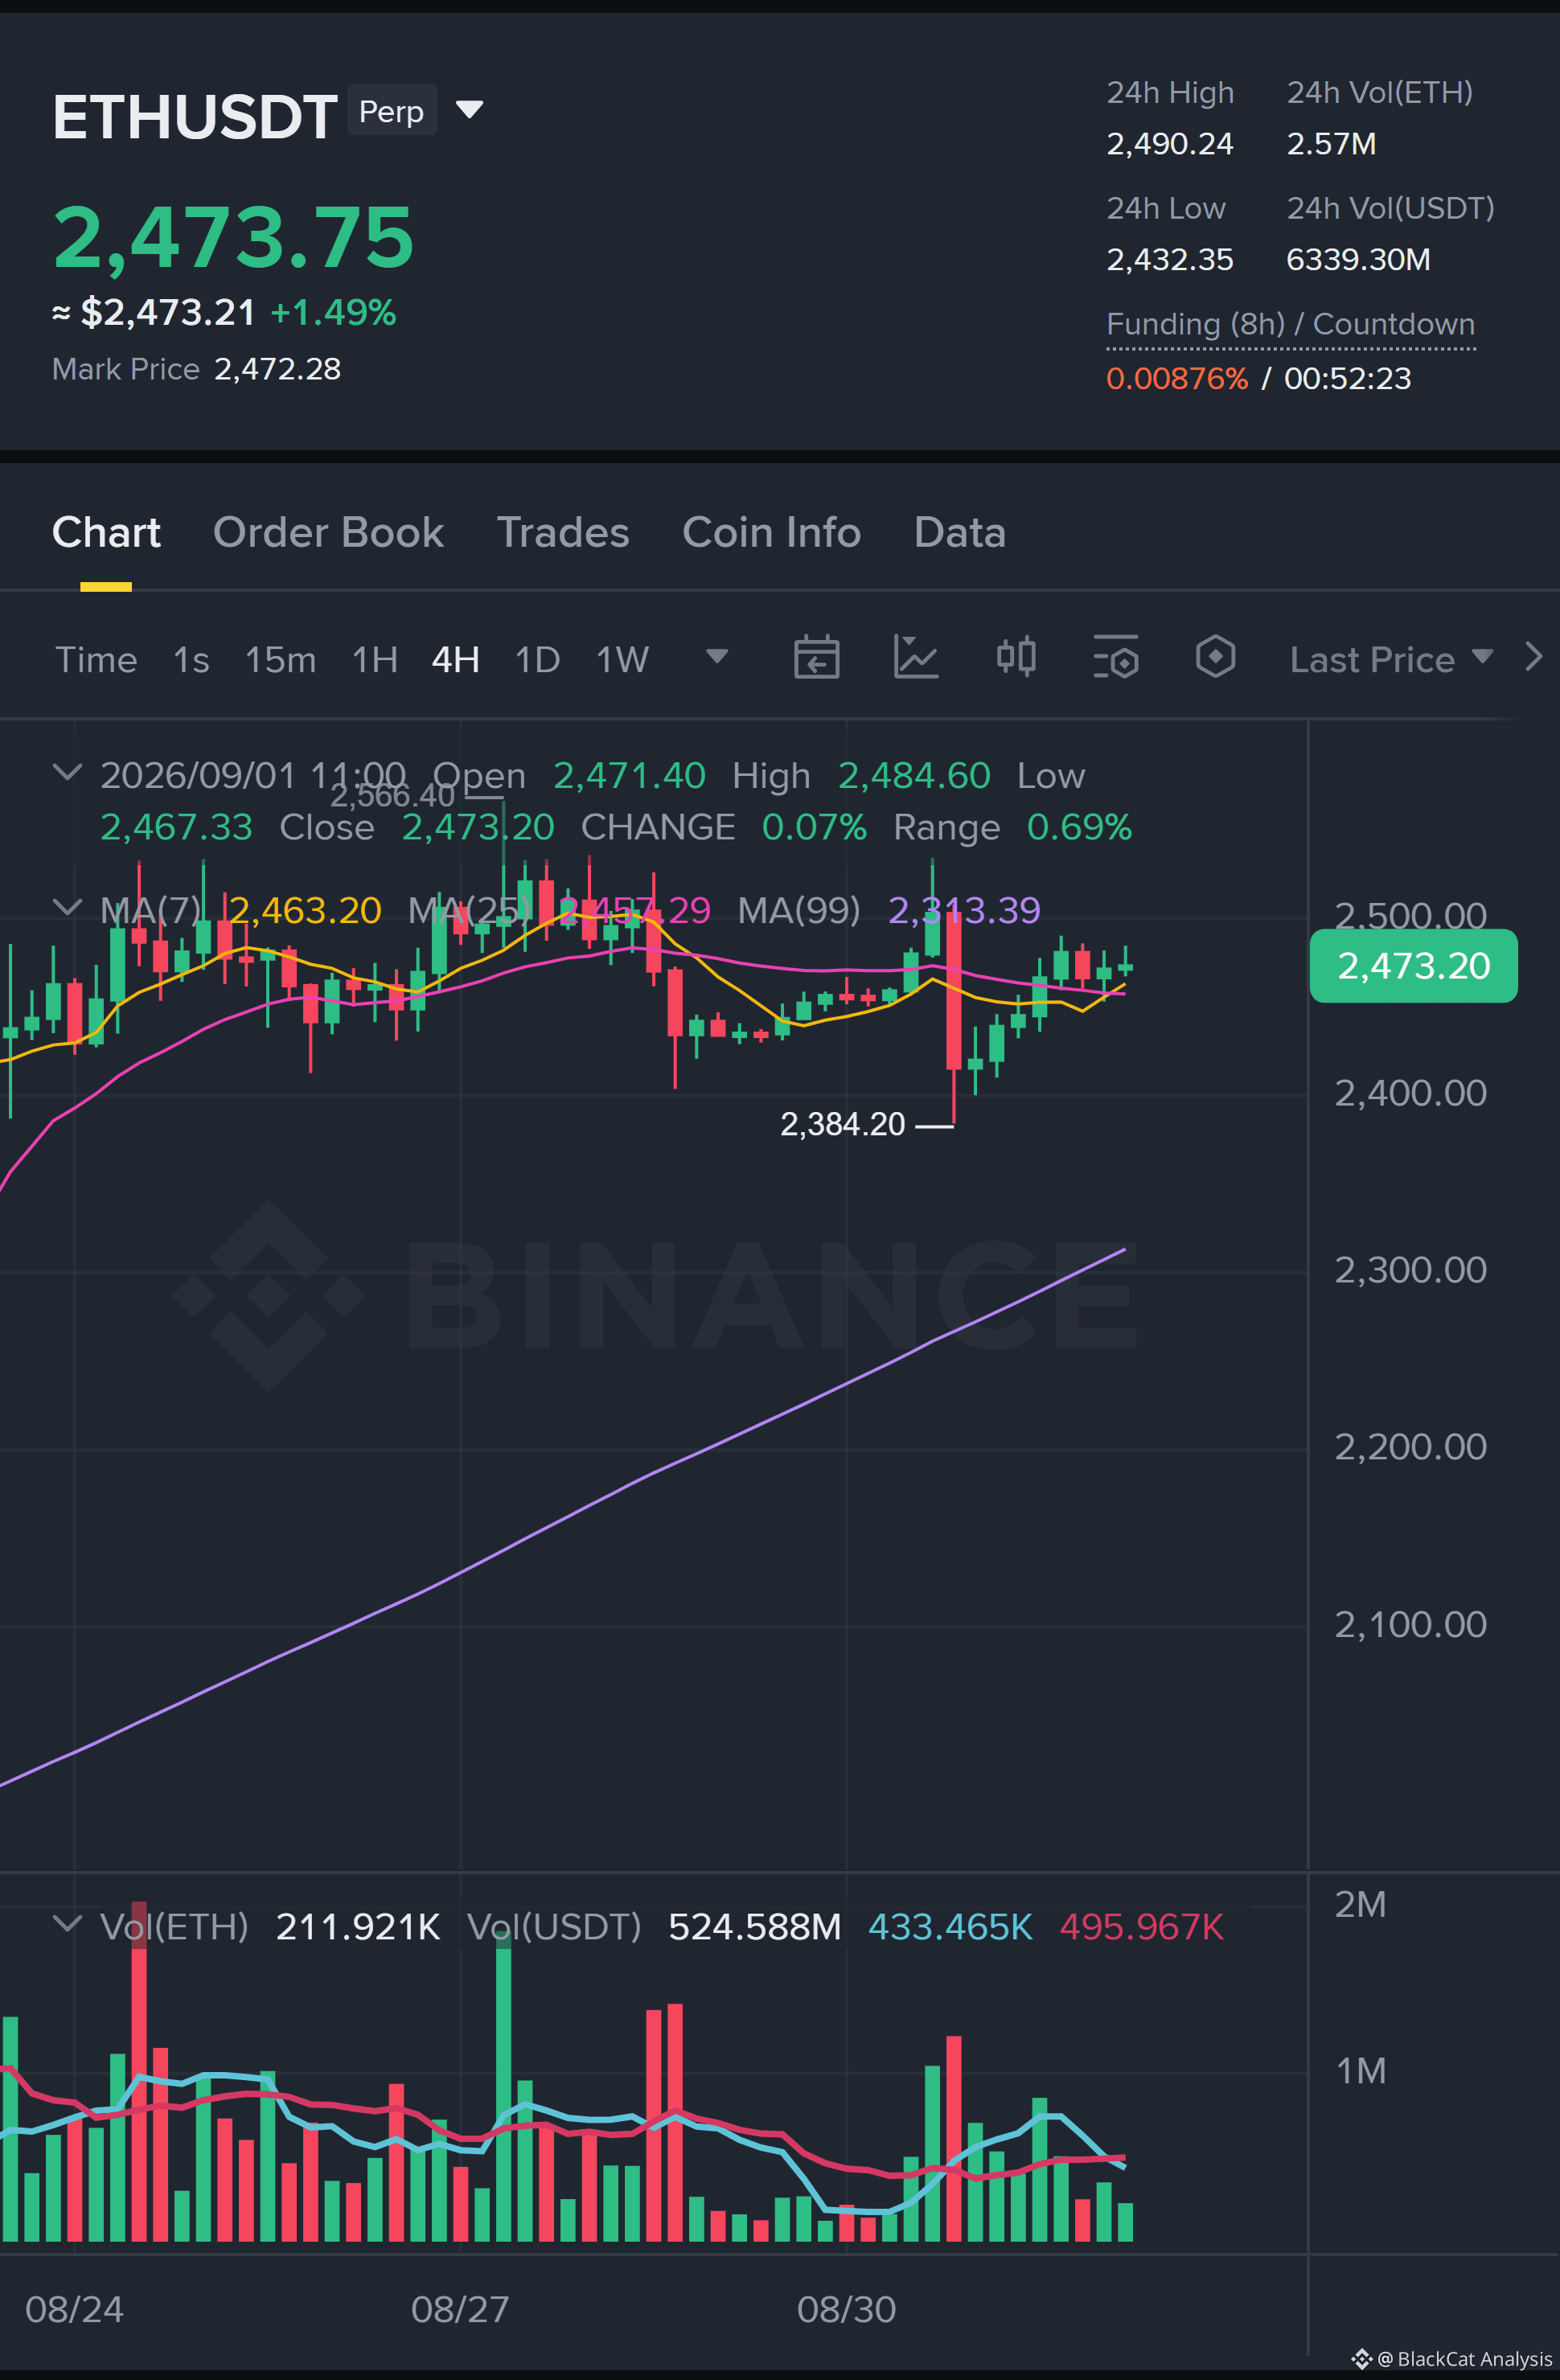
$ETH LONG SETUP | 1H
Pullback setup within the current bullish trend.
Entry zone: 2,471.51–2,473.8
Stop loss: 2,465.42
Targets: TP1 2,484.6 (1.65R) / TP2 2,490.24 (2.43R) / TP3 2,534.22 (8.5R)
Scale out: 20% / 30% / 50%
$ETH LONG SETUP | 1H
Pullback setup within the current bullish trend.
Entry zone: 2,471.51–2,473.8
Stop loss: 2,465.42
Targets: TP1 2,484.6 (1.65R) / TP2 2,490.24 (2.43R) / TP3 2,534.22 (8.5R)
Scale out: 20% / 30% / 50%
Pullback setup within the current bullish trend.
Entry zone: 2,471.51–2,473.8
Stop loss: 2,465.42
Targets: TP1 2,484.6 (1.65R) / TP2 2,490.24 (2.43R) / TP3 2,534.22 (8.5R)
Scale out: 20% / 30% / 50%
241
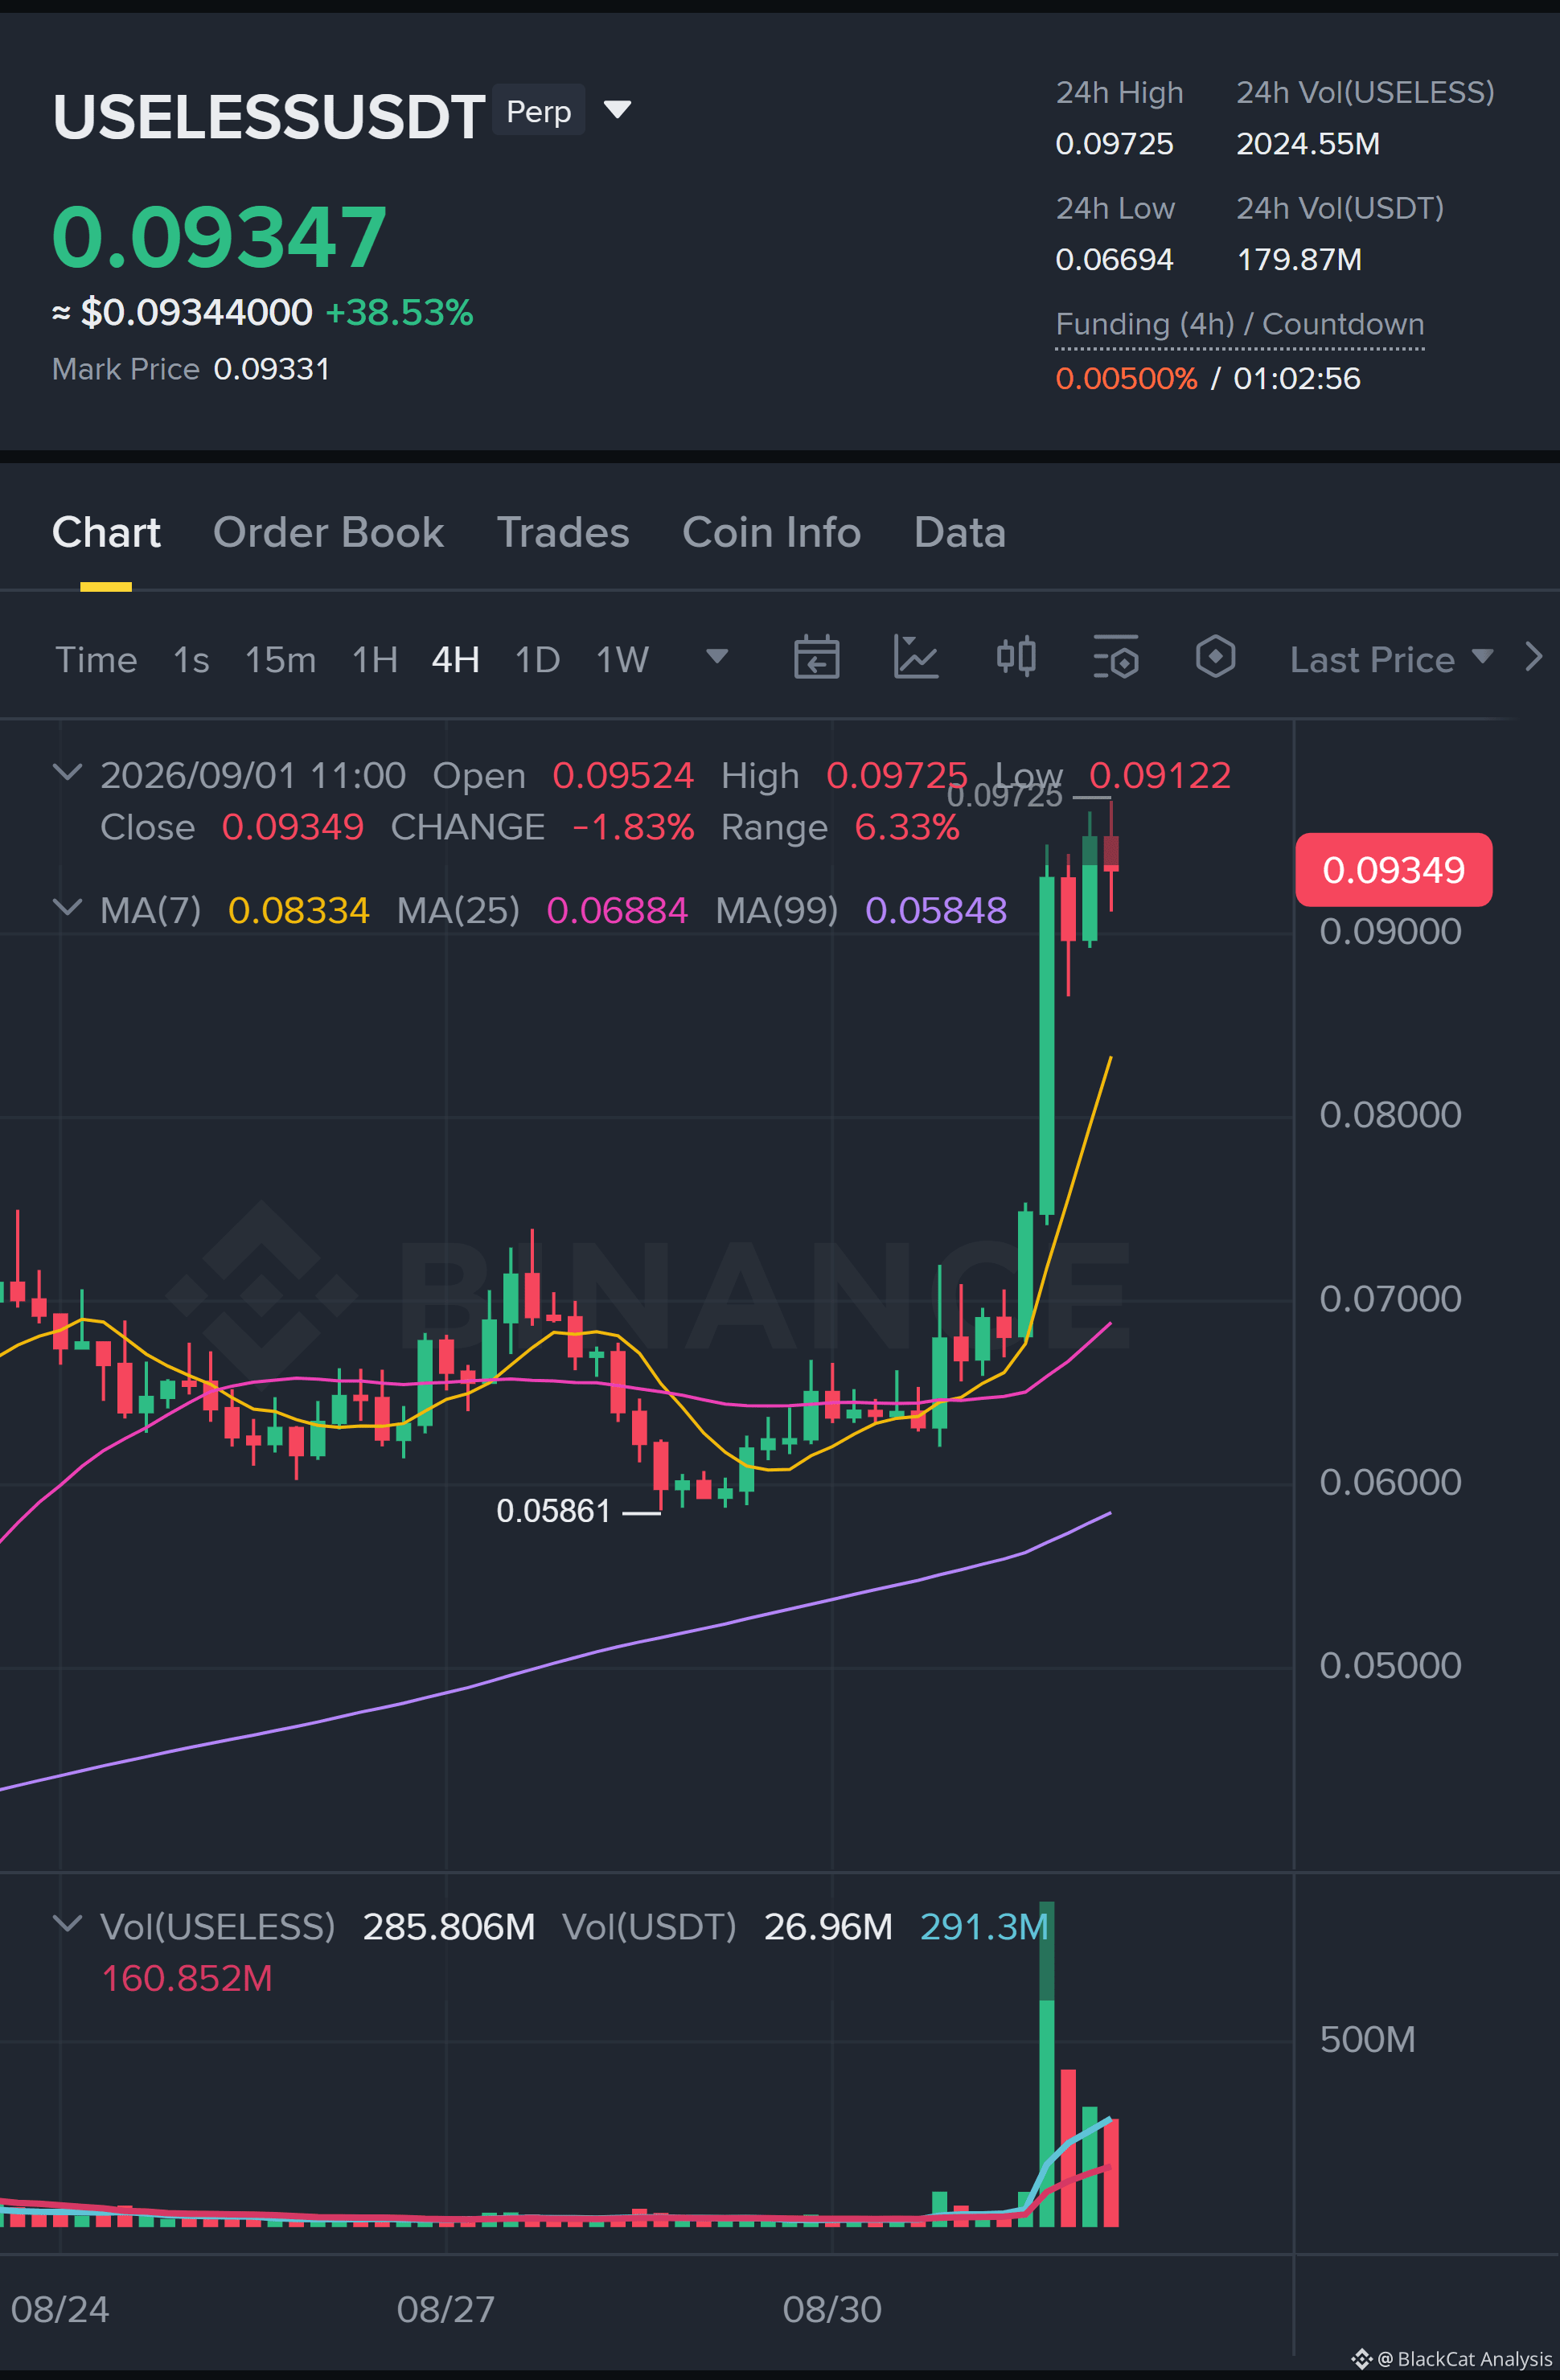
$USELESS LONG SETUP | 1H
Momentum remains aligned with the current bullish trend.
Entry zone: 0.09304–0.09386
Stop loss: 0.08988
Targets: TP1 0.09725 (1.06R) / TP2 0.10023 (1.9R) / TP3 0.10322 (2.74R)
Scale out: 20% / 30% / 50%
Considerations: estimated EV is -0.17R, below the active threshold.
Status: Watchlist only — wait for confirmation before considering the setup.
$USELESS LONG SETUP | 1H
Momentum remains aligned with the current bullish trend.
Entry zone: 0.09304–0.09386
Stop loss: 0.08988
Targets: TP1 0.09725 (1.06R) / TP2 0.10023 (1.9R) / TP3 0.10322 (2.74R)
Scale out: 20% / 30% / 50%
Considerations: estimated EV is -0.17R, below the active threshold.
Status: Watchlist only — wait for confirmation before considering the setup.
Momentum remains aligned with the current bullish trend.
Entry zone: 0.09304–0.09386
Stop loss: 0.08988
Targets: TP1 0.09725 (1.06R) / TP2 0.10023 (1.9R) / TP3 0.10322 (2.74R)
Scale out: 20% / 30% / 50%
Considerations: estimated EV is -0.17R, below the active threshold.
Status: Watchlist only — wait for confirmation before considering the setup.
301
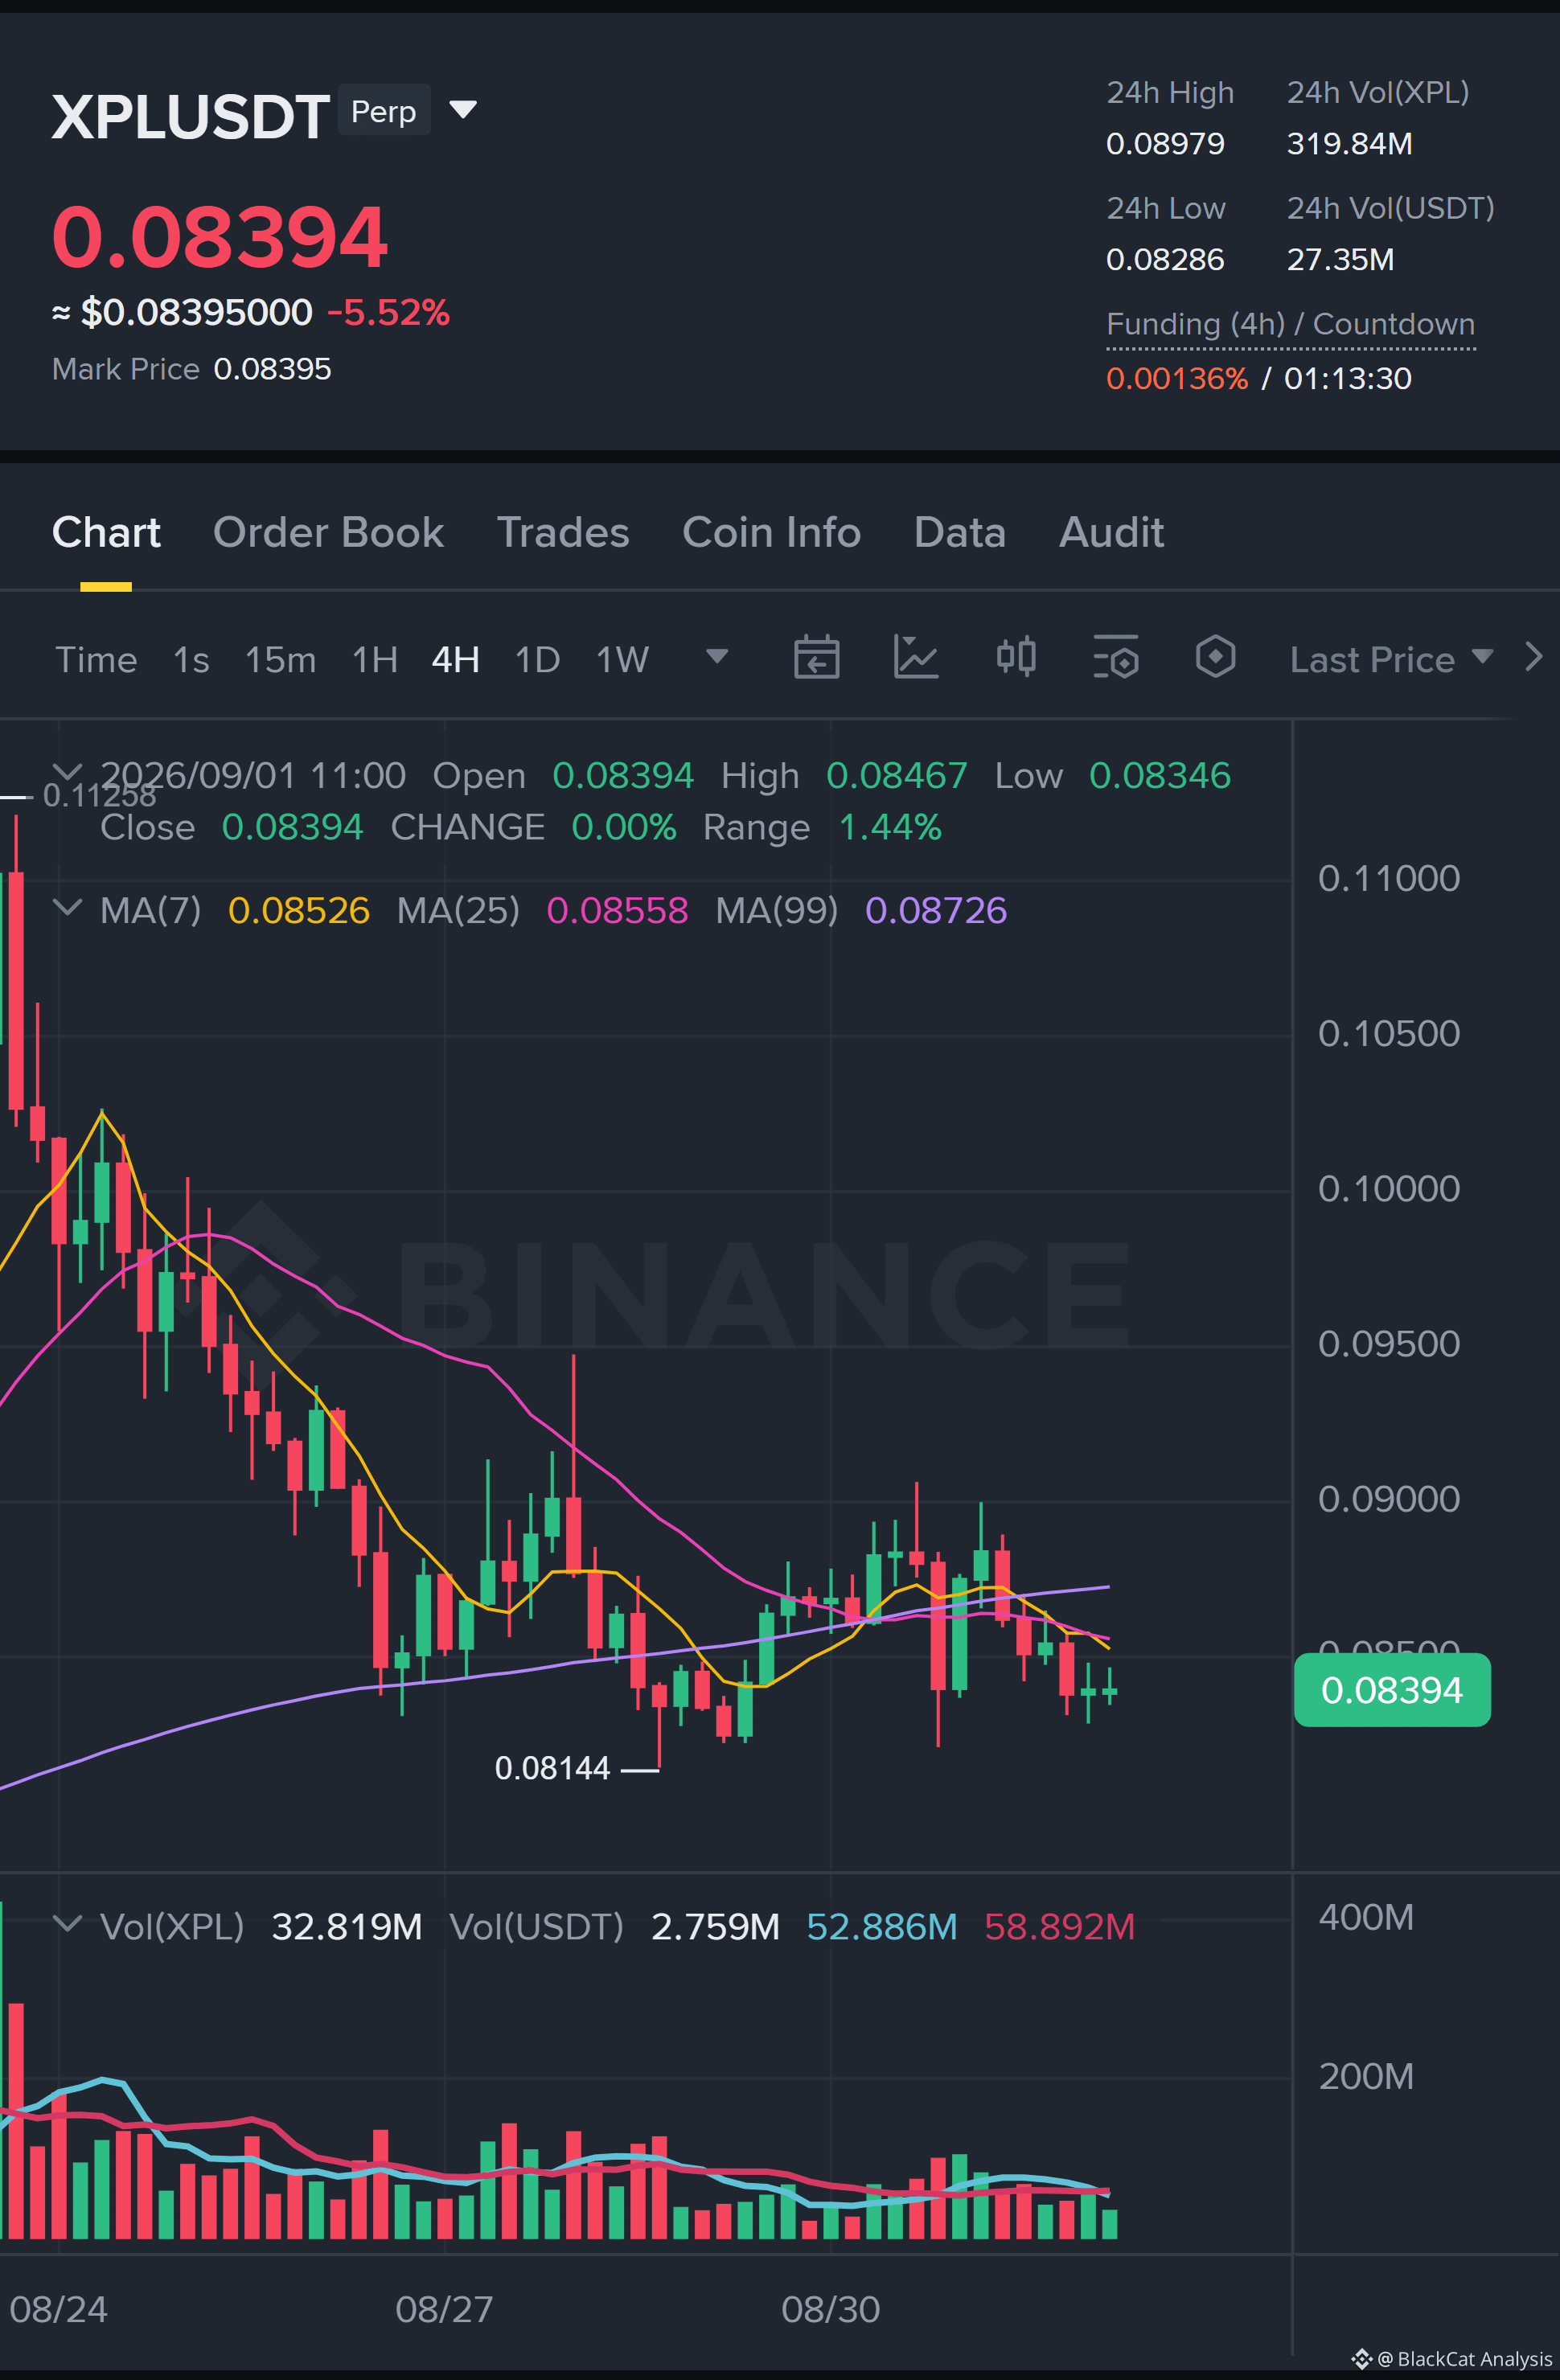
$XPL SHORT SETUP | 1H
A controlled retracement is forming a potential short entry.
Entry zone: 0.08391–0.08412
Stop loss: 0.08477
Targets: TP1 0.08286 (1.51R) / TP2 0.0821 (2.51R) / TP3 0.08144 (3.38R)
Scale out: 20% / 30% / 50%
Considerations: the direction conflicts with the BTC 4H filter; estimated EV is -0.47R, below the active threshold.
Status: Watchlist only — wait for confirmation before considering the setup.
$XPL SHORT SETUP | 1H
A controlled retracement is forming a potential short entry.
Entry zone: 0.08391–0.08412
Stop loss: 0.08477
Targets: TP1 0.08286 (1.51R) / TP2 0.0821 (2.51R) / TP3 0.08144 (3.38R)
Scale out: 20% / 30% / 50%
Considerations: the direction conflicts with the BTC 4H filter; estimated EV is -0.47R, below the active threshold.
Status: Watchlist only — wait for confirmation before considering the setup.
A controlled retracement is forming a potential short entry.
Entry zone: 0.08391–0.08412
Stop loss: 0.08477
Targets: TP1 0.08286 (1.51R) / TP2 0.0821 (2.51R) / TP3 0.08144 (3.38R)
Scale out: 20% / 30% / 50%
Considerations: the direction conflicts with the BTC 4H filter; estimated EV is -0.47R, below the active threshold.
Status: Watchlist only — wait for confirmation before considering the setup.
230
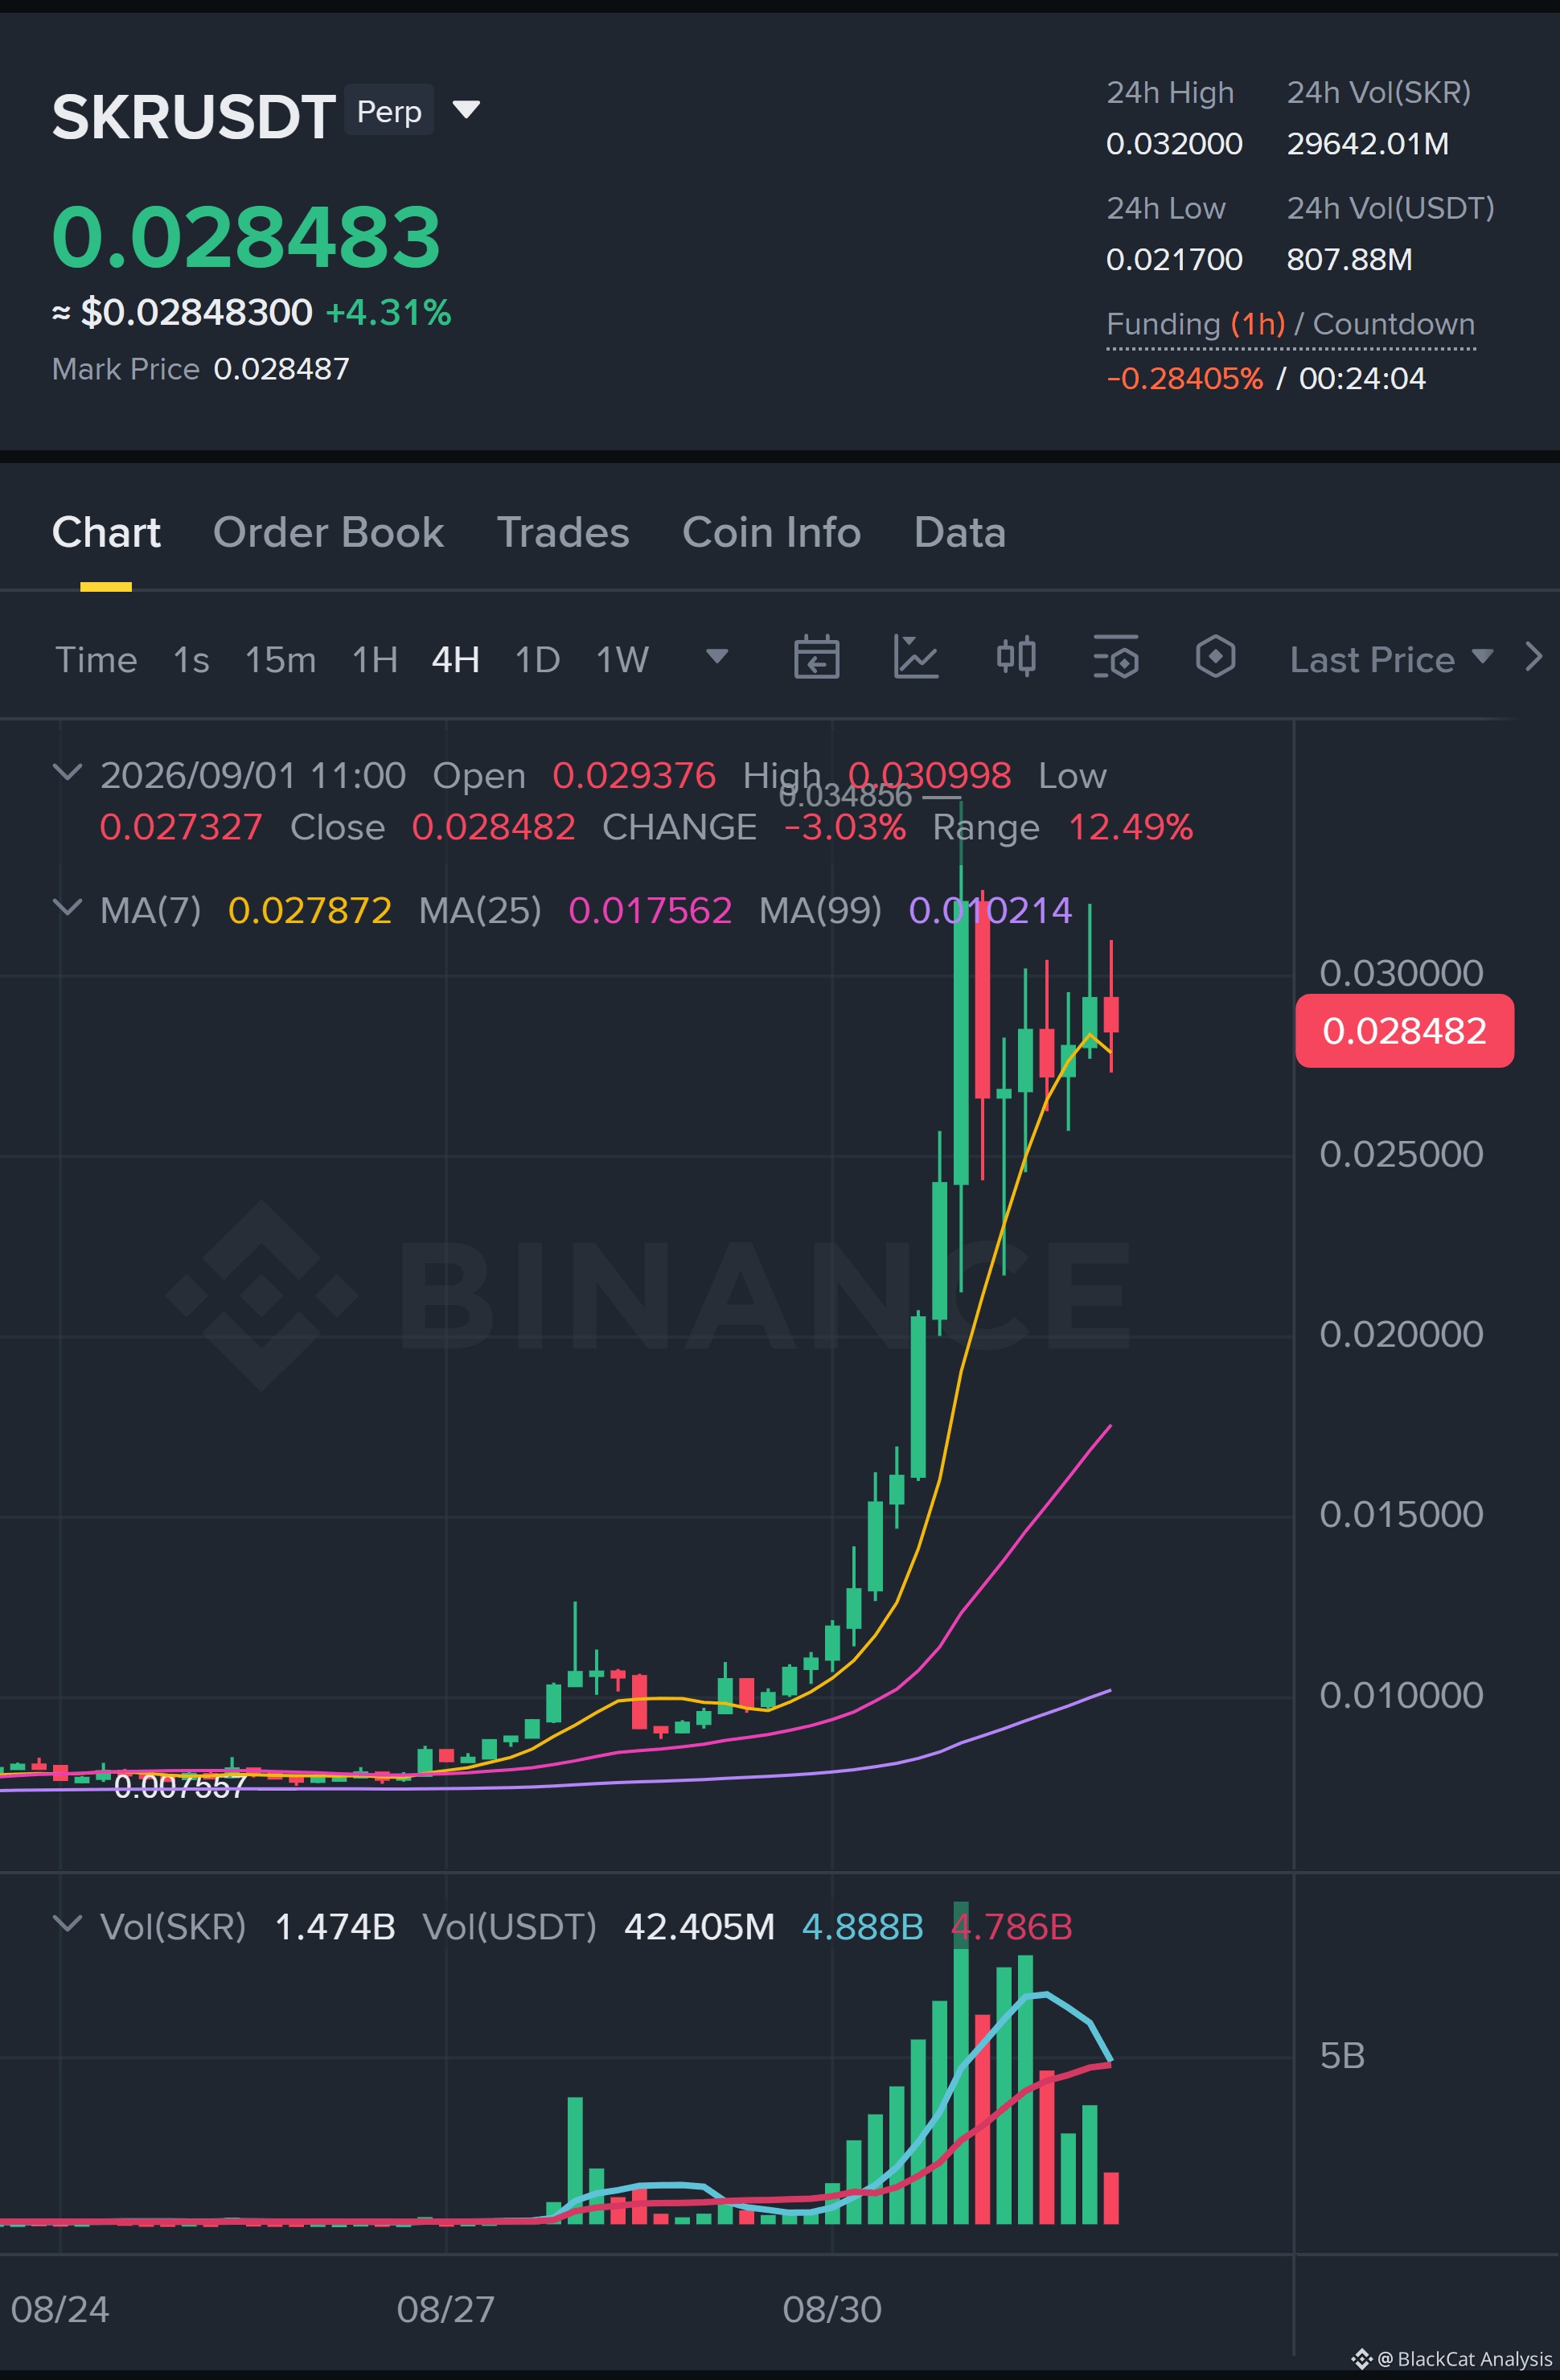
$SKR LONG SETUP | 1H
The current retracement offers a potential long continuation setup.
Entry zone: 0.027843–0.028293
Stop loss: 0.026953
Targets: TP1 0.030998 (2.63R) / TP2 0.032 (3.53R) / TP3 0.034856 (6.09R)
Scale out: 20% / 30% / 50%
Considerations: estimated EV is -0.03R, below the active threshold.
Status: Watchlist only — wait for confirmation before considering the setup.
$SKR LONG SETUP | 1H
The current retracement offers a potential long continuation setup.
Entry zone: 0.027843–0.028293
Stop loss: 0.026953
Targets: TP1 0.030998 (2.63R) / TP2 0.032 (3.53R) / TP3 0.034856 (6.09R)
Scale out: 20% / 30% / 50%
Considerations: estimated EV is -0.03R, below the active threshold.
Status: Watchlist only — wait for confirmation before considering the setup.
The current retracement offers a potential long continuation setup.
Entry zone: 0.027843–0.028293
Stop loss: 0.026953
Targets: TP1 0.030998 (2.63R) / TP2 0.032 (3.53R) / TP3 0.034856 (6.09R)
Scale out: 20% / 30% / 50%
Considerations: estimated EV is -0.03R, below the active threshold.
Status: Watchlist only — wait for confirmation before considering the setup.
313
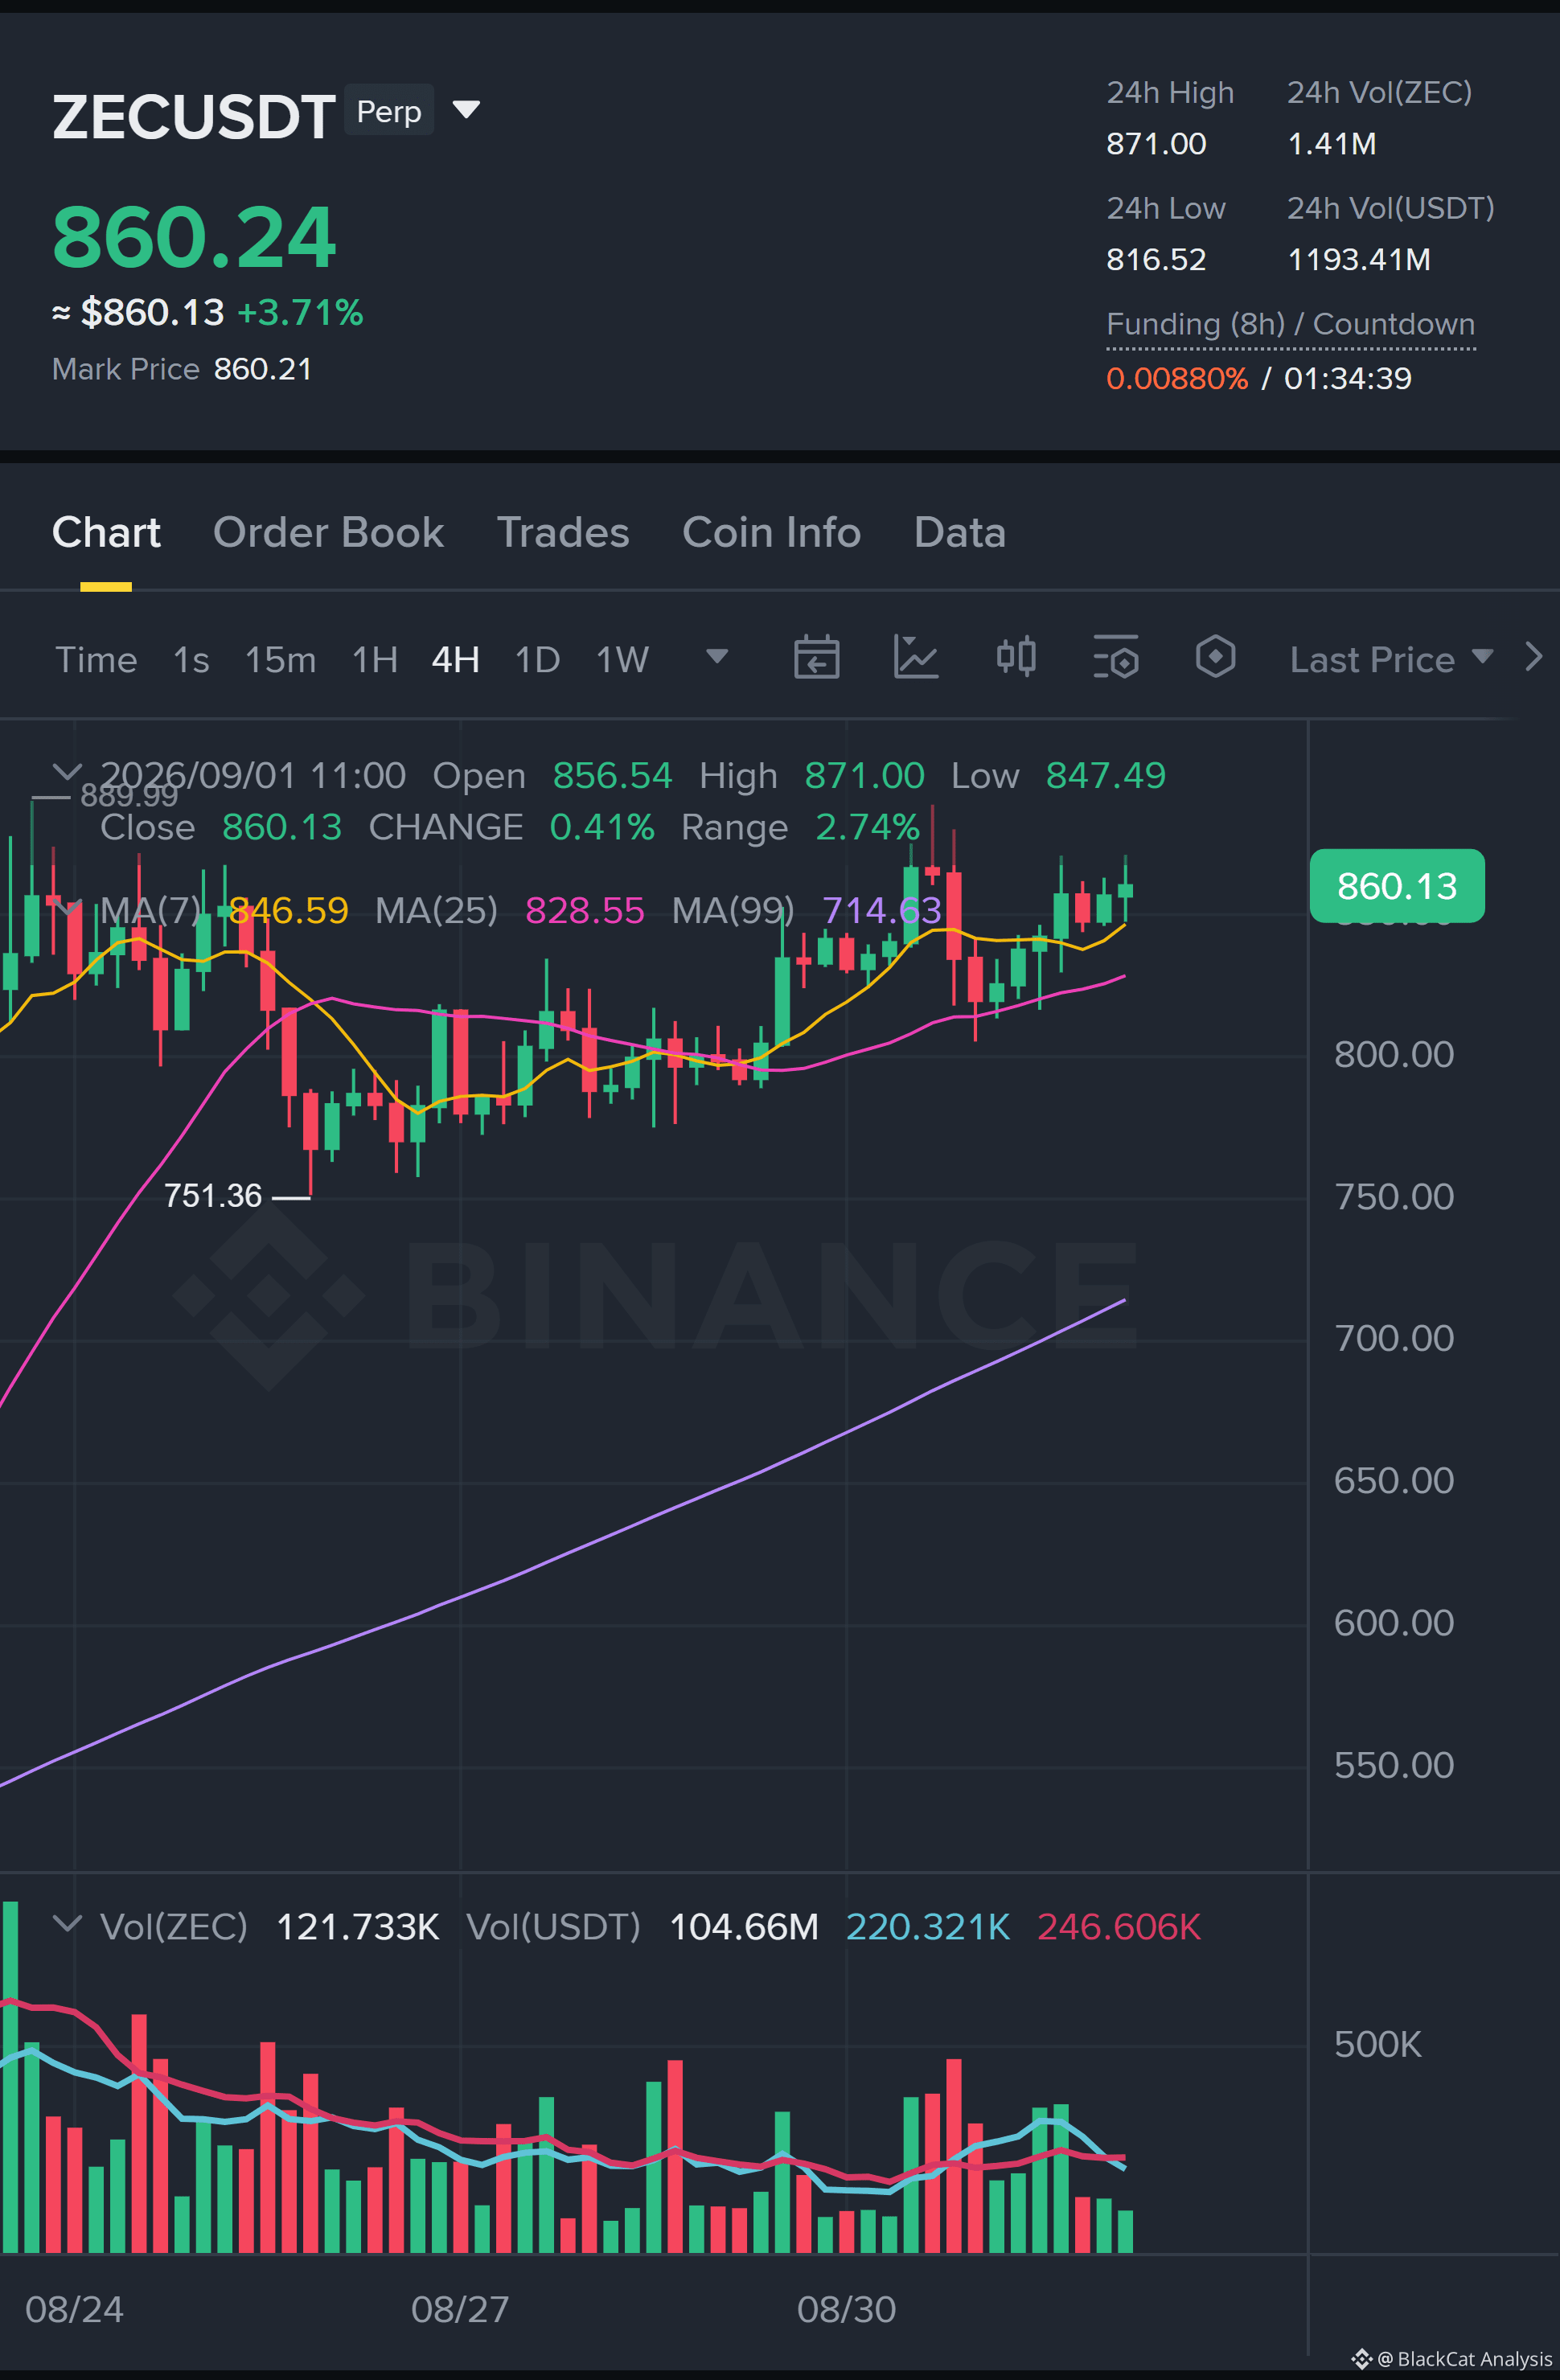
$ZEC LONG SETUP | 1H
Price action is presenting a potential entry with the bullish bias.
Entry zone: 855.22–857.38
Stop loss: 845.69
Targets: TP1 870.76 (1.36R) / TP2 888.65 (3.05R) / TP3 898.96 (4.02R)
Scale out: 50% / 30% / 20%
$ZEC LONG SETUP | 1H
Price action is presenting a potential entry with the bullish bias.
Entry zone: 855.22–857.38
Stop loss: 845.69
Targets: TP1 870.76 (1.36R) / TP2 888.65 (3.05R) / TP3 898.96 (4.02R)
Scale out: 50% / 30% / 20%
Price action is presenting a potential entry with the bullish bias.
Entry zone: 855.22–857.38
Stop loss: 845.69
Targets: TP1 870.76 (1.36R) / TP2 888.65 (3.05R) / TP3 898.96 (4.02R)
Scale out: 50% / 30% / 20%
475
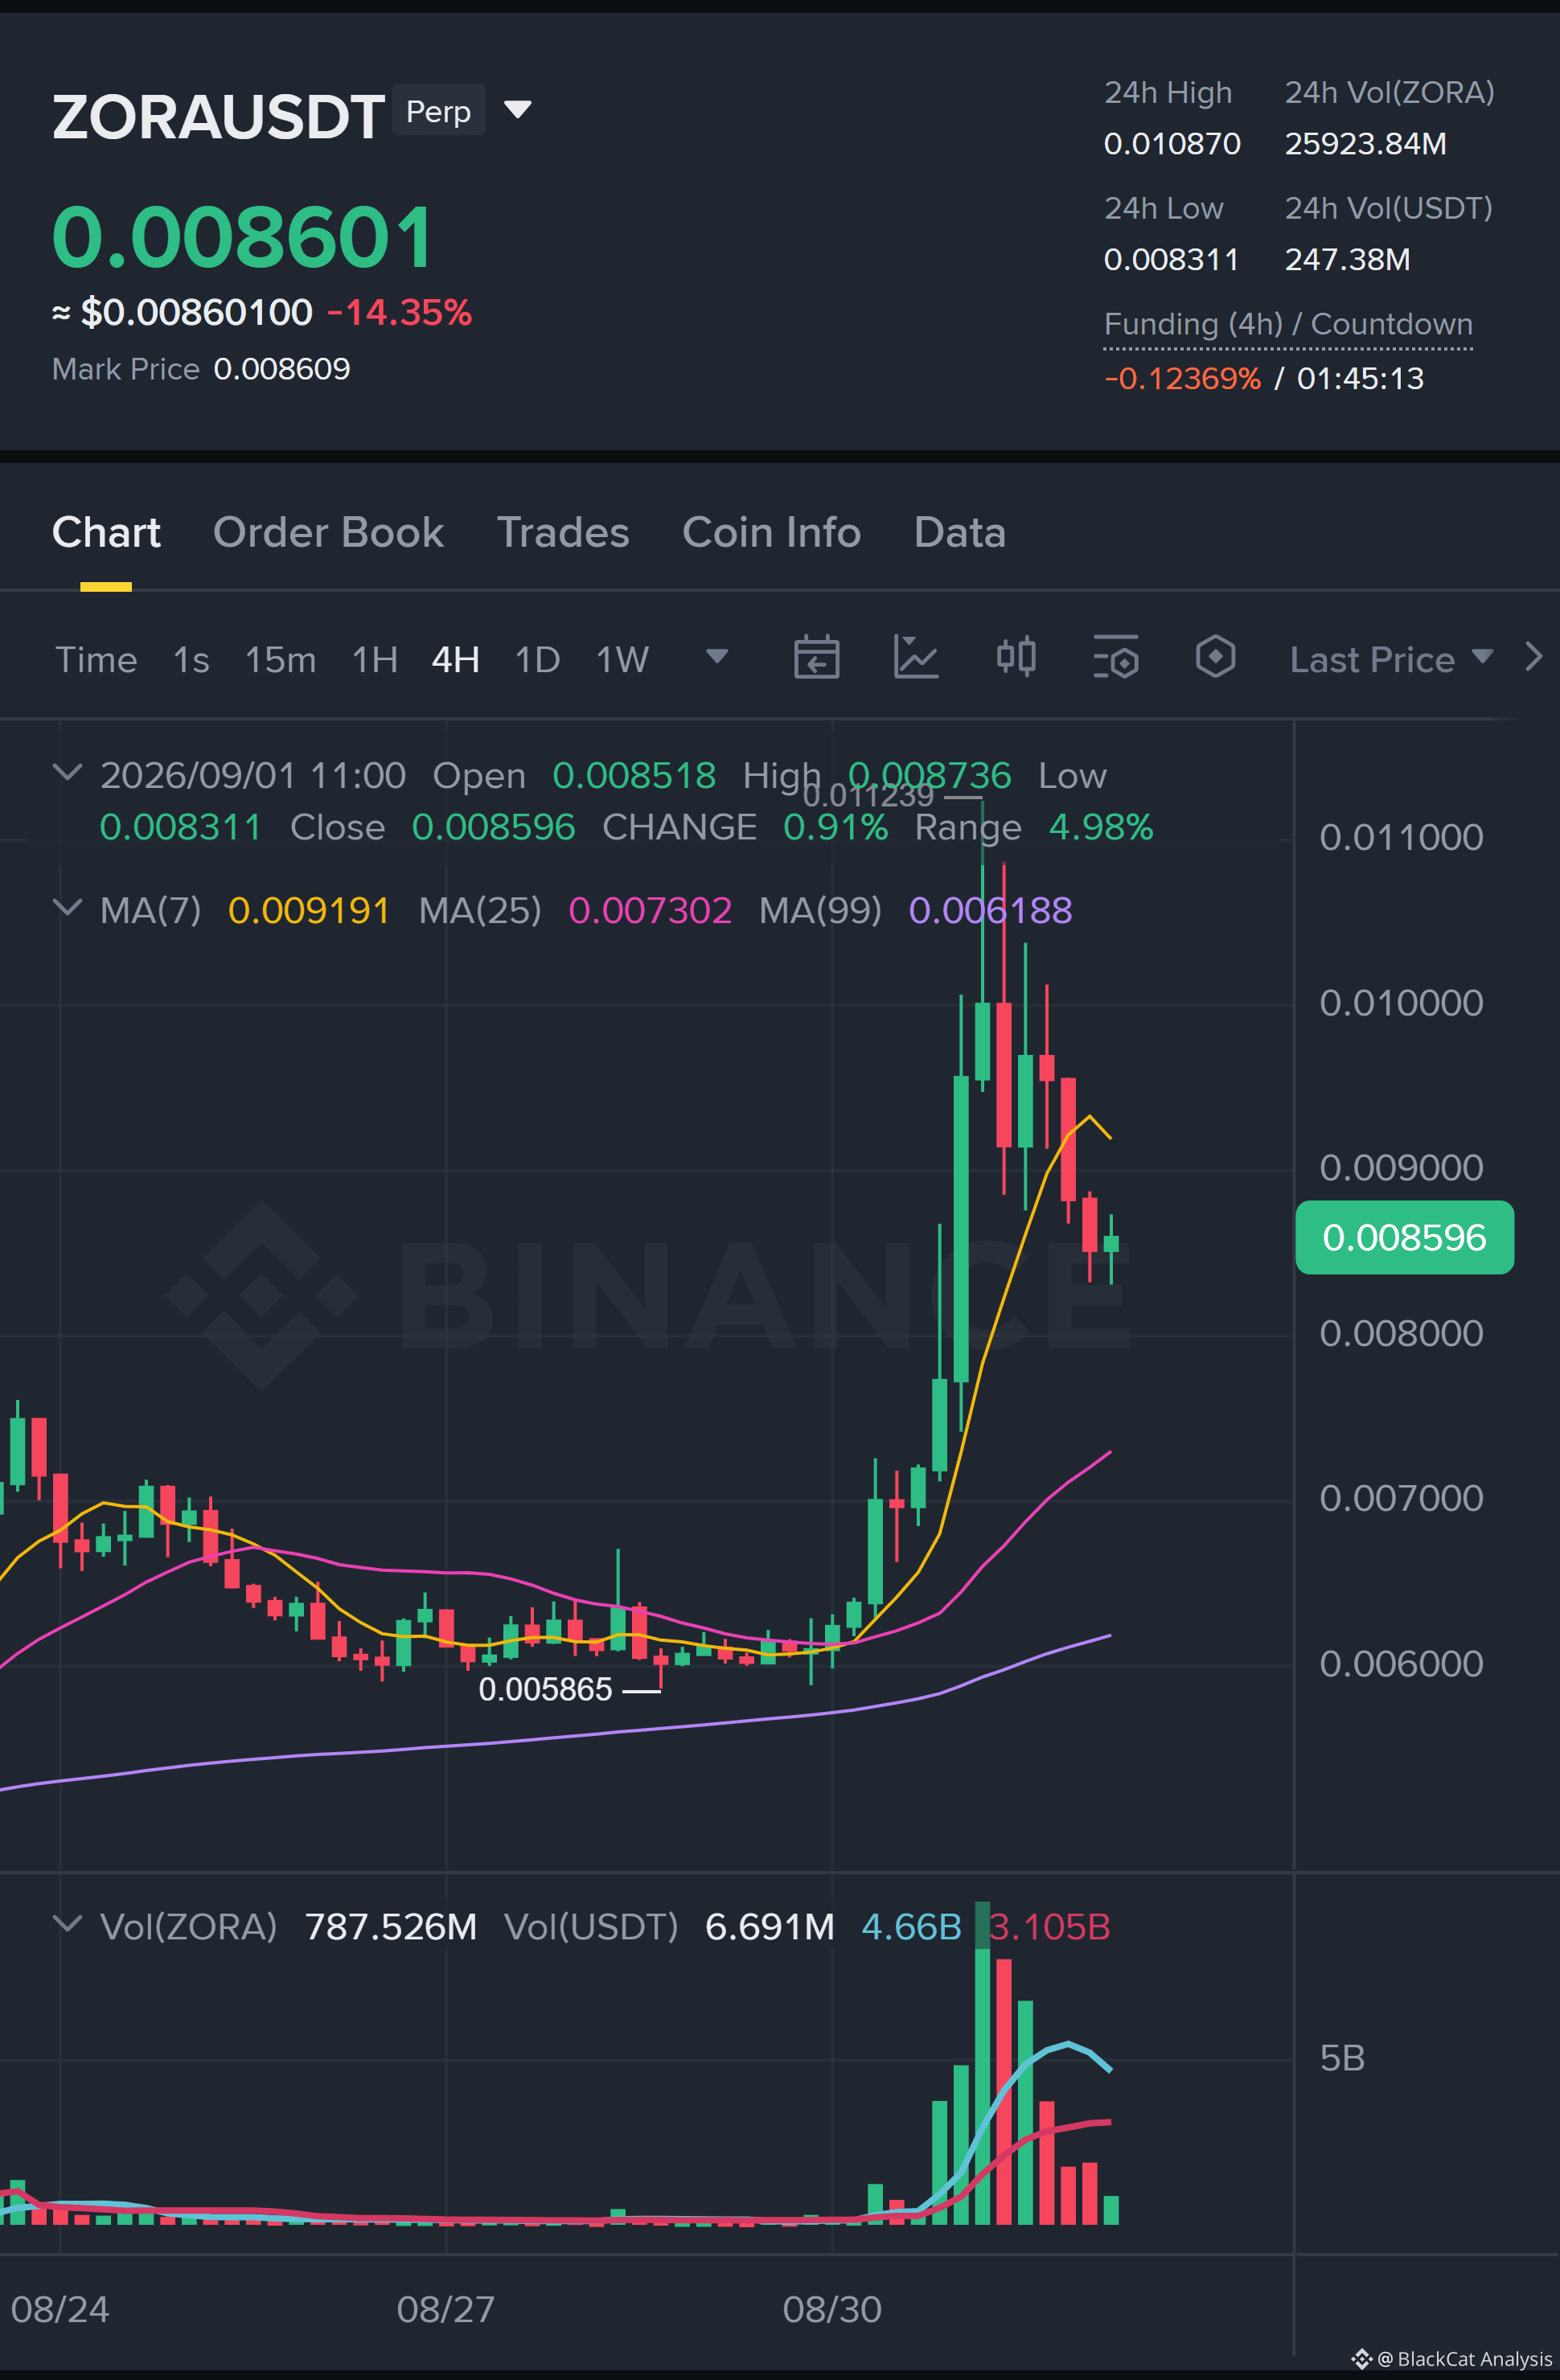
$ZORA LONG SETUP | 1H
Price is revisiting the entry area while the broader bias remains bullish.
Entry zone: 0.008574–0.008652
Stop loss: 0.008361
Targets: TP1 0.008875 (1.04R) / TP2 0.010127 (6.01R) / TP3 0.010492 (7.46R)
Scale out: 20% / 30% / 50%
Considerations: 15M entry confirmation is incomplete; estimated EV is +0.02R, below the active threshold.
Status: Watchlist only — wait for confirmation before considering the setup.
$ZORA LONG SETUP | 1H
Price is revisiting the entry area while the broader bias remains bullish.
Entry zone: 0.008574–0.008652
Stop loss: 0.008361
Targets: TP1 0.008875 (1.04R) / TP2 0.010127 (6.01R) / TP3 0.010492 (7.46R)
Scale out: 20% / 30% / 50%
Considerations: 15M entry confirmation is incomplete; estimated EV is +0.02R, below the active threshold.
Status: Watchlist only — wait for confirmation before considering the setup.
Price is revisiting the entry area while the broader bias remains bullish.
Entry zone: 0.008574–0.008652
Stop loss: 0.008361
Targets: TP1 0.008875 (1.04R) / TP2 0.010127 (6.01R) / TP3 0.010492 (7.46R)
Scale out: 20% / 30% / 50%
Considerations: 15M entry confirmation is incomplete; estimated EV is +0.02R, below the active threshold.
Status: Watchlist only — wait for confirmation before considering the setup.
268
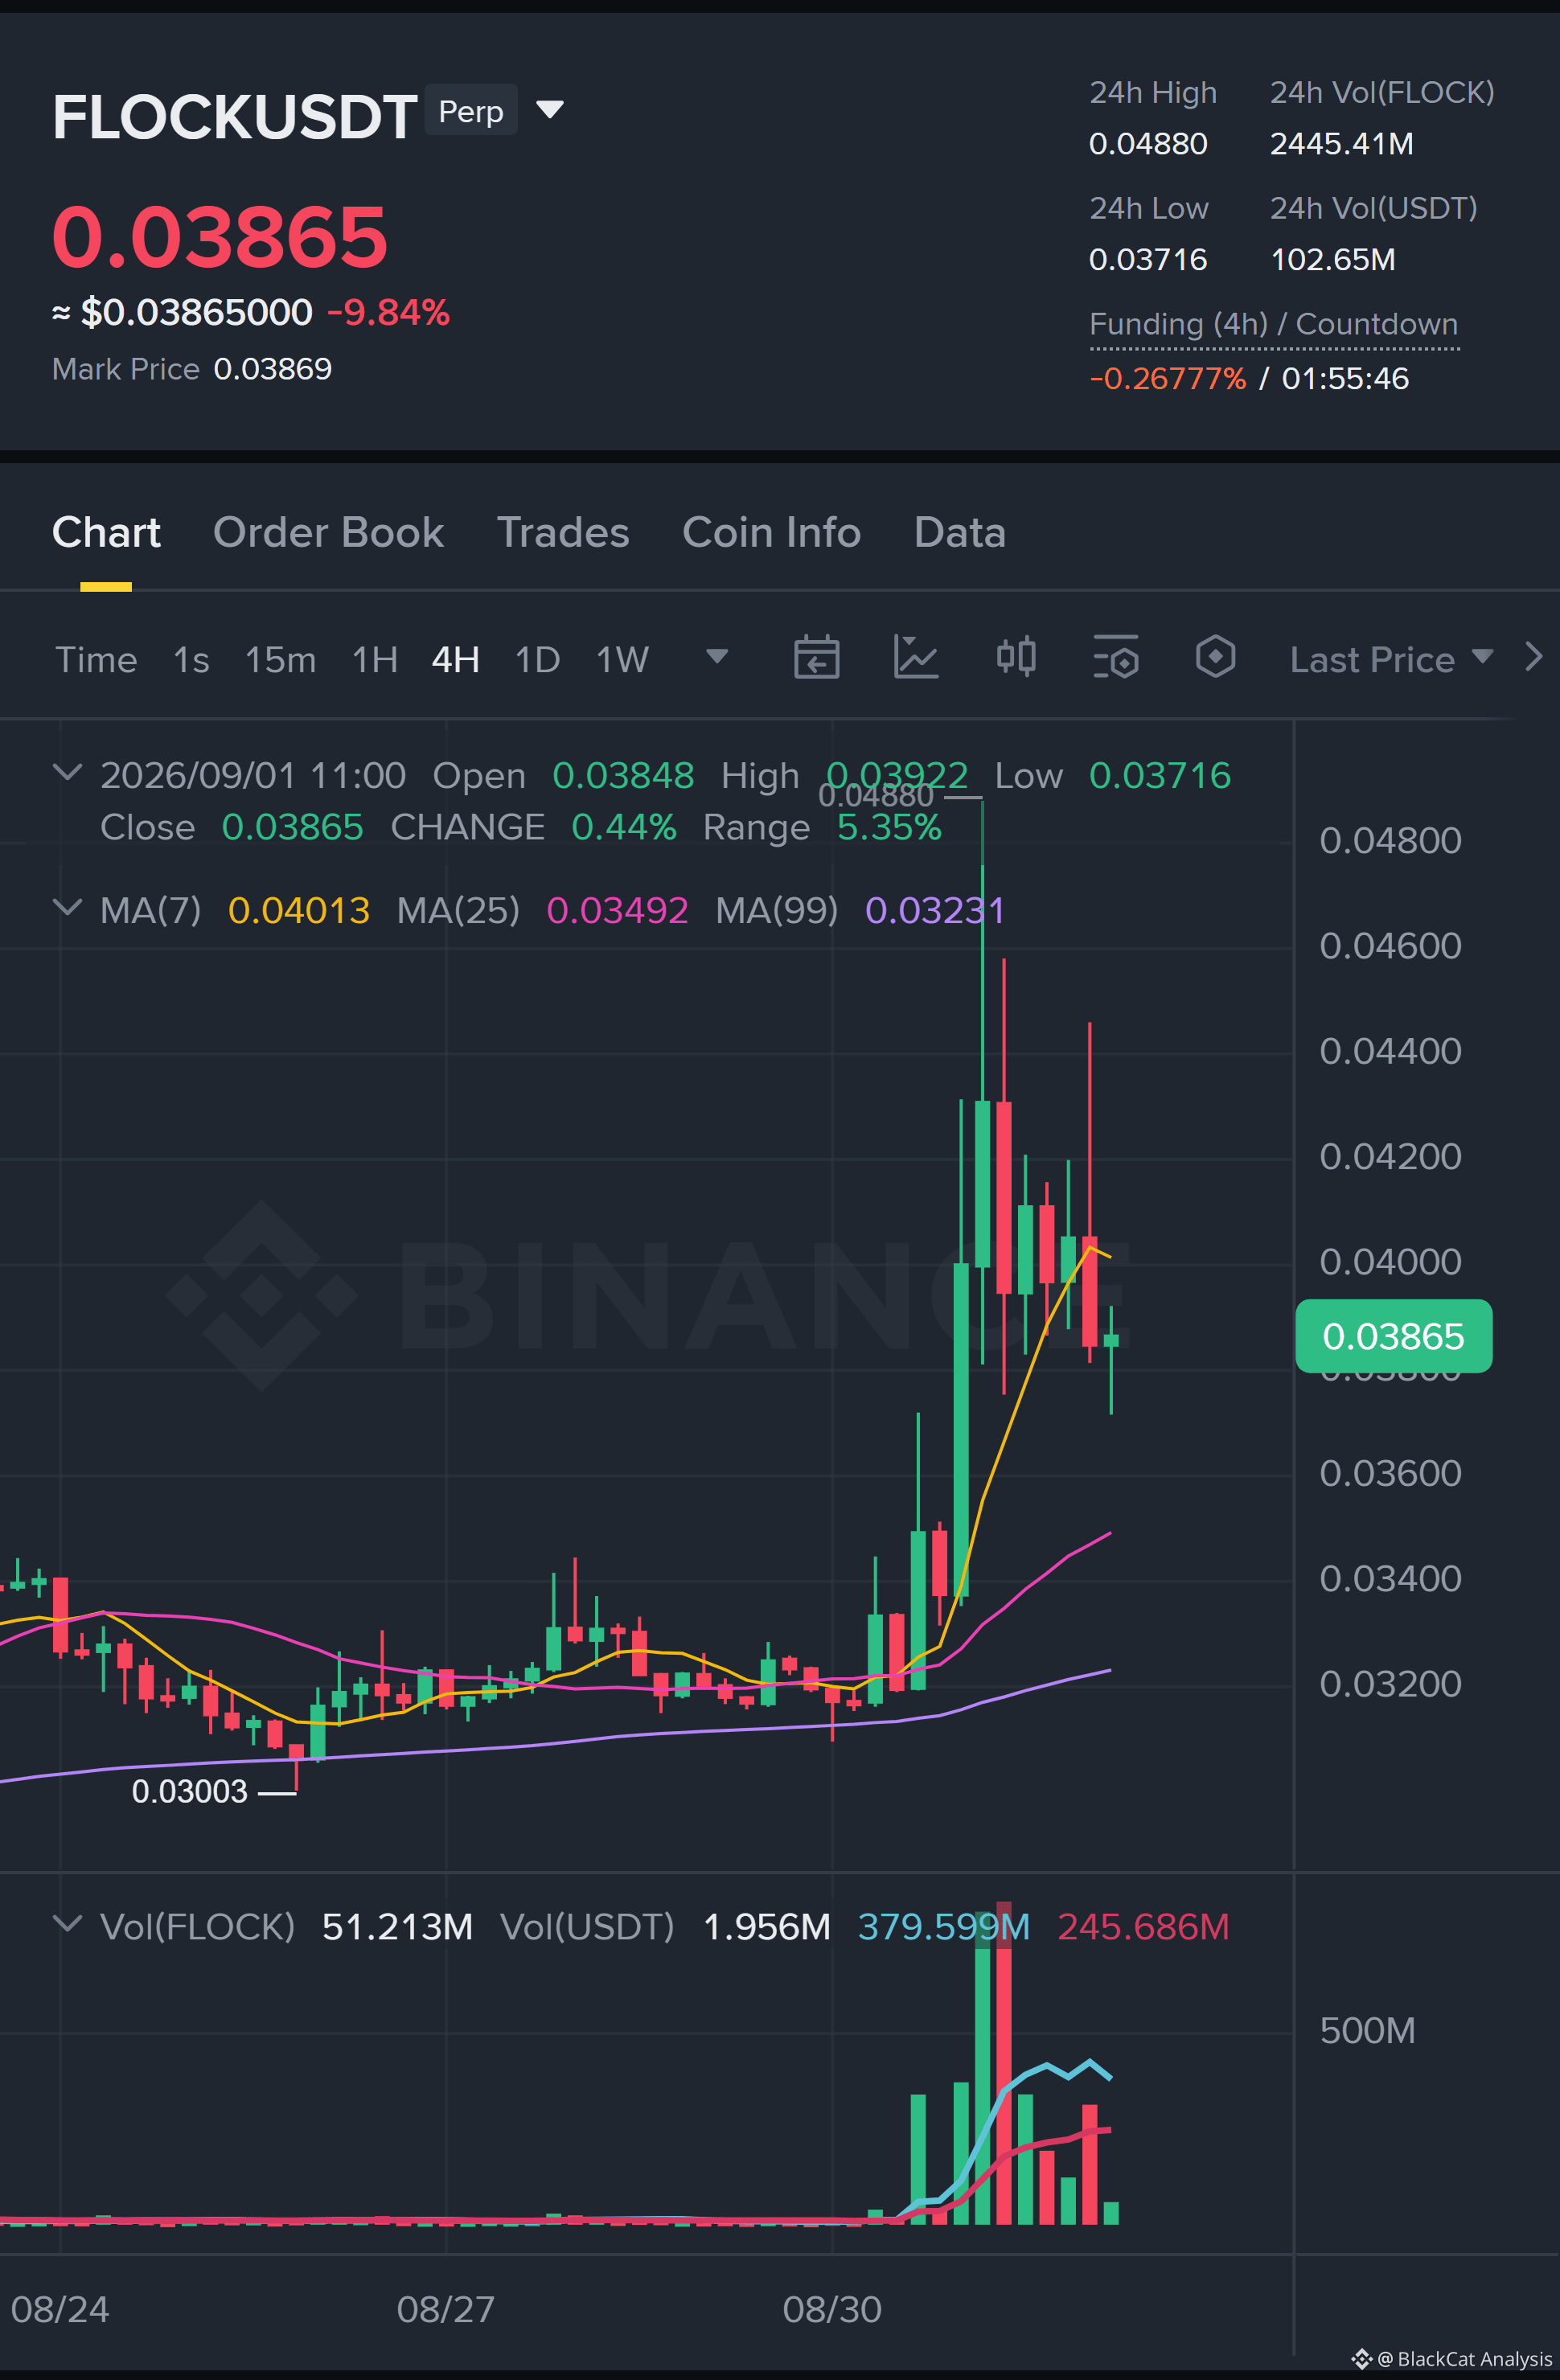
$FLOCK LONG SETUP | 1H
Price is revisiting the entry area while the broader bias remains bullish.
Entry zone: 0.03777–0.03815
Stop loss: 0.03684
Targets: TP1 0.0414 (3.07R) / TP2 0.0446 (5.93R) / TP3 0.0488 (9.68R)
Scale out: 20% / 30% / 50%
Considerations: 15M entry confirmation is incomplete; estimated EV is +0.02R, below the active threshold.
Status: Watchlist only — wait for confirmation before considering the setup.
$FLOCK LONG SETUP | 1H
Price is revisiting the entry area while the broader bias remains bullish.
Entry zone: 0.03777–0.03815
Stop loss: 0.03684
Targets: TP1 0.0414 (3.07R) / TP2 0.0446 (5.93R) / TP3 0.0488 (9.68R)
Scale out: 20% / 30% / 50%
Considerations: 15M entry confirmation is incomplete; estimated EV is +0.02R, below the active threshold.
Status: Watchlist only — wait for confirmation before considering the setup.
Price is revisiting the entry area while the broader bias remains bullish.
Entry zone: 0.03777–0.03815
Stop loss: 0.03684
Targets: TP1 0.0414 (3.07R) / TP2 0.0446 (5.93R) / TP3 0.0488 (9.68R)
Scale out: 20% / 30% / 50%
Considerations: 15M entry confirmation is incomplete; estimated EV is +0.02R, below the active threshold.
Status: Watchlist only — wait for confirmation before considering the setup.
321
Article
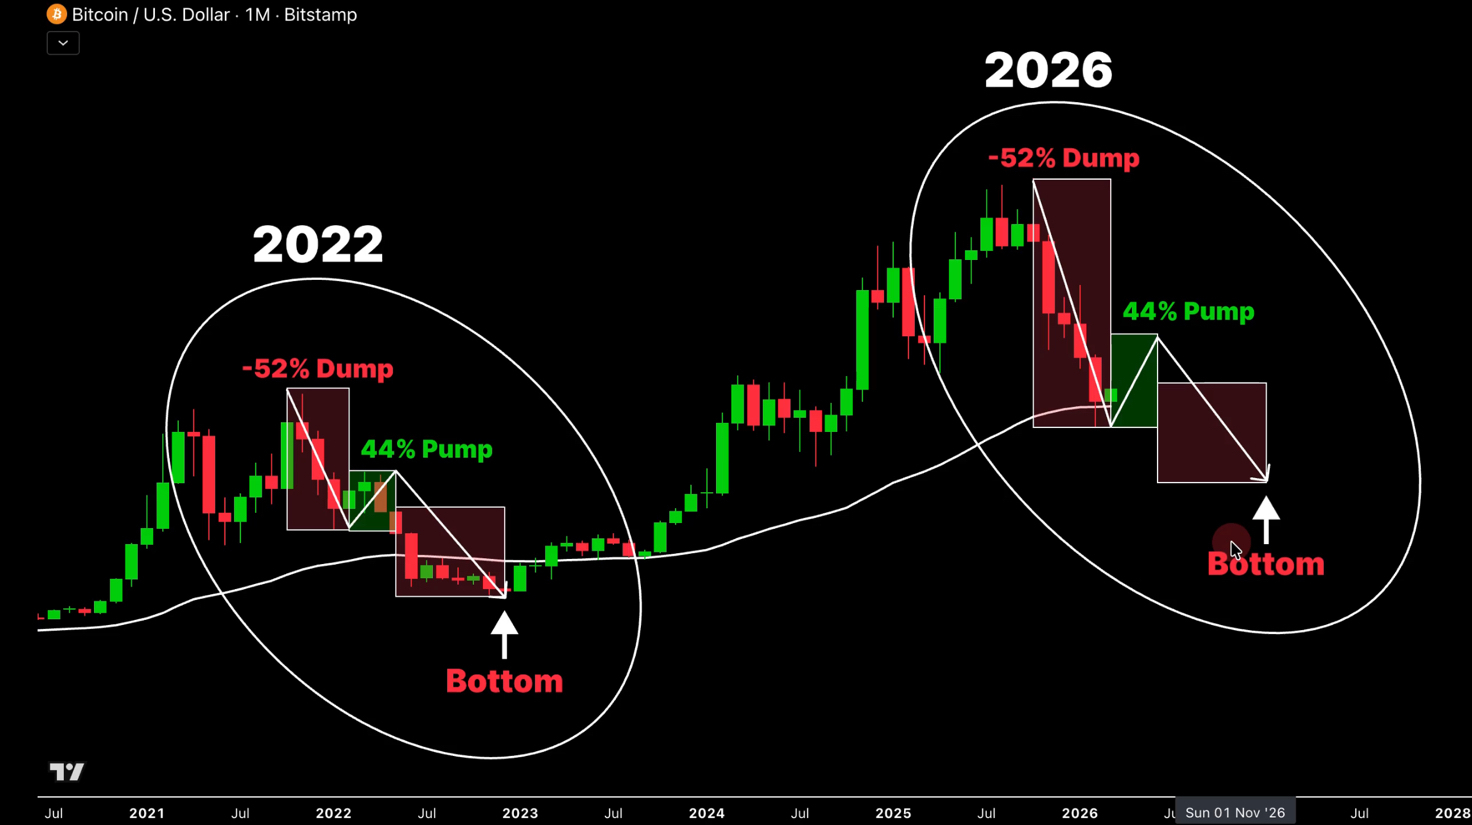
$BTC May Be Entering Wave 3 — The Most Violent Move Usually Comes Next.$BTC is beginning to show a structure that suggests the market may be transitioning into a more sensitive phase.
From a wave perspective, the recent movement resembles the completion of a wave 2 correction, which unfolded in a relatively clear zigzag pattern. If this interpretation continues to hold, the market could be approaching the start of wave 3, a phase that historically tends to produce the strongest and fastest movements in the direction of the main trend.
Structurally, wave 3 phases often coincide with expanding volatility and increasing pressure on market sentiment. Once momentum accelerates, the market can move quickly toward the next major liquidity zones.
In the current context, the 58,000–55,000 USD region becomes a key area to monitor. This zone stands out not only as a technical support region but also as a potential liquidity pocket where the market could test the strength of buyers. If selling momentum begins to accelerate, price could move toward this region relatively quickly as the market searches for deeper demand.
Liquidity dynamics also play an important role here. If Bitcoin were to approach this area with strong downside momentum, many positions that entered during the recent rebound could be forced to close. That kind of forced unwinding often amplifies volatility and can push the market into a short-term panic phase.
Psychologically, this is where the market often becomes most unstable. Traders expecting a continuation of the recovery may suddenly find themselves on the wrong side of the move, which can further accelerate selling pressure.
However, the scenario has a clear invalidation level. If price manages to reclaim and hold above 74,000 USD, the current wave structure would lose its reliability. A move above that level would suggest that the market is regaining strength rather than entering a deeper corrective phase.
For now, the key factor remains whether selling pressure continues to build. Markets at this stage can move very quickly, and shifts in structure can change the short-term outlook almost immediately.
$BTC #Bitcoin #Crypto
{future}(BTCUSDT)
$BTC May Be Entering Wave 3 — The Most Violent Move Usually Comes Next.
$BTC is beginning to show a structure that suggests the market may be transitioning into a more sensitive phase.
From a wave perspective, the recent movement resembles the completion of a wave 2 correction, which unfolded in a relatively clear zigzag pattern. If this interpretation continues to hold, the market could be approaching the start of wave 3, a phase that historically tends to produce the strongest and fastest movements in the direction of the main trend.
Structurally, wave 3 phases often coincide with expanding volatility and increasing pressure on market sentiment. Once momentum accelerates, the market can move quickly toward the next major liquidity zones.
In the current context, the 58,000–55,000 USD region becomes a key area to monitor. This zone stands out not only as a technical support region but also as a potential liquidity pocket where the market could test the strength of buyers. If selling momentum begins to accelerate, price could move toward this region relatively quickly as the market searches for deeper demand.
Liquidity dynamics also play an important role here. If Bitcoin were to approach this area with strong downside momentum, many positions that entered during the recent rebound could be forced to close. That kind of forced unwinding often amplifies volatility and can push the market into a short-term panic phase.
Psychologically, this is where the market often becomes most unstable. Traders expecting a continuation of the recovery may suddenly find themselves on the wrong side of the move, which can further accelerate selling pressure.
However, the scenario has a clear invalidation level. If price manages to reclaim and hold above 74,000 USD, the current wave structure would lose its reliability. A move above that level would suggest that the market is regaining strength rather than entering a deeper corrective phase.
For now, the key factor remains whether selling pressure continues to build. Markets at this stage can move very quickly, and shifts in structure can change the short-term outlook almost immediately.
$BTC #Bitcoin #Crypto
From a wave perspective, the recent movement resembles the completion of a wave 2 correction, which unfolded in a relatively clear zigzag pattern. If this interpretation continues to hold, the market could be approaching the start of wave 3, a phase that historically tends to produce the strongest and fastest movements in the direction of the main trend.
Structurally, wave 3 phases often coincide with expanding volatility and increasing pressure on market sentiment. Once momentum accelerates, the market can move quickly toward the next major liquidity zones.
In the current context, the 58,000–55,000 USD region becomes a key area to monitor. This zone stands out not only as a technical support region but also as a potential liquidity pocket where the market could test the strength of buyers. If selling momentum begins to accelerate, price could move toward this region relatively quickly as the market searches for deeper demand.
Liquidity dynamics also play an important role here. If Bitcoin were to approach this area with strong downside momentum, many positions that entered during the recent rebound could be forced to close. That kind of forced unwinding often amplifies volatility and can push the market into a short-term panic phase.
Psychologically, this is where the market often becomes most unstable. Traders expecting a continuation of the recovery may suddenly find themselves on the wrong side of the move, which can further accelerate selling pressure.
However, the scenario has a clear invalidation level. If price manages to reclaim and hold above 74,000 USD, the current wave structure would lose its reliability. A move above that level would suggest that the market is regaining strength rather than entering a deeper corrective phase.
For now, the key factor remains whether selling pressure continues to build. Markets at this stage can move very quickly, and shifts in structure can change the short-term outlook almost immediately.
$BTC #Bitcoin #Crypto
14
1
138
83.5k
Article
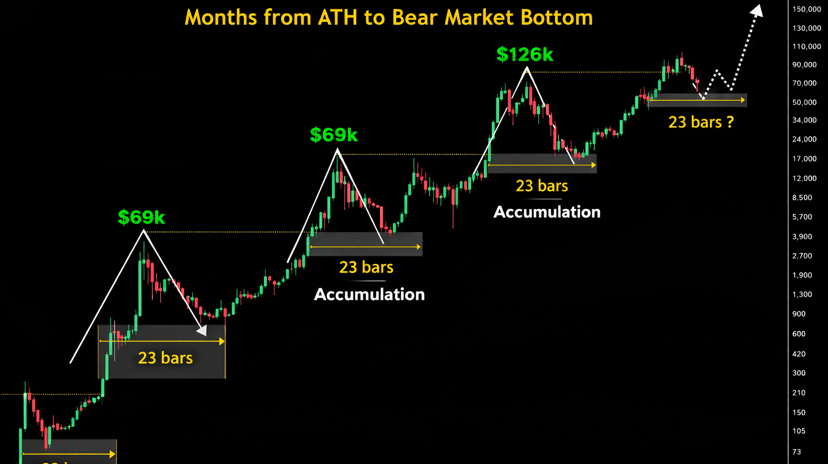
Bitcoin vs Altcoins: Early Rotation or Beginning of Expansion?While $BTC continues navigating macro pressure and uneven liquidity conditions, parts of the altcoin market are beginning to show a different behavior.
After nearly four years of prolonged correction and consolidation, several altcoins are quietly transitioning away from pure downtrend structure. The shift isn’t obvious through headlines or narratives — it’s showing up directly in price action.
What stands out is structural change.
Higher lows are beginning to form.
Trading ranges are expanding instead of compressing.
Former resistance zones are gradually being absorbed rather than rejected.
These are often early characteristics seen when markets move from accumulation into the first stages of expansion.
Interestingly, this rotation is happening while broader attention remains fixed on Bitcoin’s uncertainty. When the majority of participants are still focused on whether $BTC might weaken further, speculative capital sometimes begins exploring higher-beta assets earlier in the cycle.
That doesn’t automatically confirm a full altseason.
Early rotations can fail if liquidity doesn’t follow through. Sustainable growth usually requires improving participation, expanding volume, and consistent capital inflow — not just isolated price strength.
For now, the environment appears selective rather than euphoric.
This phase tends to reward patience and asset selection more than aggressive chasing. Markets often build new foundations quietly before wider recognition arrives.
If liquidity continues strengthening alongside improving structure, the current transition could evolve into a broader growth phase — one that typically becomes obvious only after much of the initial move has already unfolded.
$BTC #Bitcoin #Crypto
{future}(BTCUSDT)
Bitcoin vs Altcoins: Early Rotation or Beginning of Expansion?
While $BTC continues navigating macro pressure and uneven liquidity conditions, parts of the altcoin market are beginning to show a different behavior.
After nearly four years of prolonged correction and consolidation, several altcoins are quietly transitioning away from pure downtrend structure. The shift isn’t obvious through headlines or narratives — it’s showing up directly in price action.
What stands out is structural change.
Higher lows are beginning to form.
Trading ranges are expanding instead of compressing.
Former resistance zones are gradually being absorbed rather than rejected.
These are often early characteristics seen when markets move from accumulation into the first stages of expansion.
Interestingly, this rotation is happening while broader attention remains fixed on Bitcoin’s uncertainty. When the majority of participants are still focused on whether $BTC might weaken further, speculative capital sometimes begins exploring higher-beta assets earlier in the cycle.
That doesn’t automatically confirm a full altseason.
Early rotations can fail if liquidity doesn’t follow through. Sustainable growth usually requires improving participation, expanding volume, and consistent capital inflow — not just isolated price strength.
For now, the environment appears selective rather than euphoric.
This phase tends to reward patience and asset selection more than aggressive chasing. Markets often build new foundations quietly before wider recognition arrives.
If liquidity continues strengthening alongside improving structure, the current transition could evolve into a broader growth phase — one that typically becomes obvious only after much of the initial move has already unfolded.
$BTC #Bitcoin #Crypto
After nearly four years of prolonged correction and consolidation, several altcoins are quietly transitioning away from pure downtrend structure. The shift isn’t obvious through headlines or narratives — it’s showing up directly in price action.
What stands out is structural change.
Higher lows are beginning to form.
Trading ranges are expanding instead of compressing.
Former resistance zones are gradually being absorbed rather than rejected.
These are often early characteristics seen when markets move from accumulation into the first stages of expansion.
Interestingly, this rotation is happening while broader attention remains fixed on Bitcoin’s uncertainty. When the majority of participants are still focused on whether $BTC might weaken further, speculative capital sometimes begins exploring higher-beta assets earlier in the cycle.
That doesn’t automatically confirm a full altseason.
Early rotations can fail if liquidity doesn’t follow through. Sustainable growth usually requires improving participation, expanding volume, and consistent capital inflow — not just isolated price strength.
For now, the environment appears selective rather than euphoric.
This phase tends to reward patience and asset selection more than aggressive chasing. Markets often build new foundations quietly before wider recognition arrives.
If liquidity continues strengthening alongside improving structure, the current transition could evolve into a broader growth phase — one that typically becomes obvious only after much of the initial move has already unfolded.
$BTC #Bitcoin #Crypto
9
7
88
85.6k
Article
Bitcoin Cycle Mechanics: Compression Before Expansion?There’s a recurring rhythm in $BTC that many overlook:
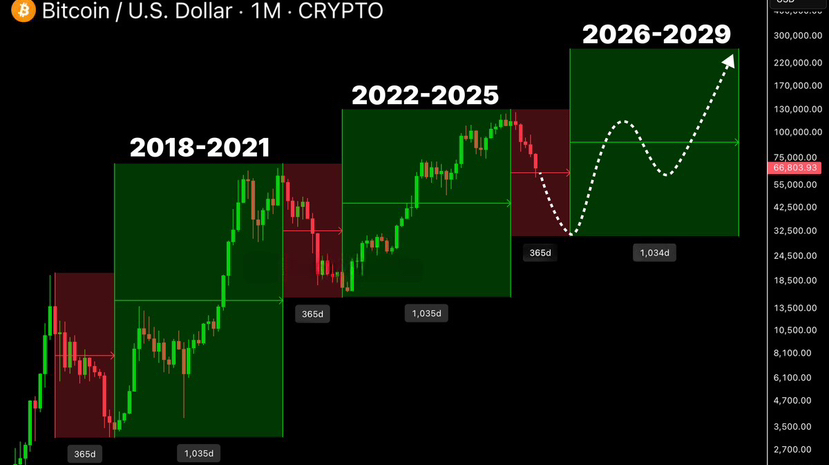
Roughly 1 year of contraction → followed by ~3 years of expansion.
Not perfectly timed.
Not mechanically identical.
But structurally consistent.
How the cycle typically unfolds:
Phase 1 – Cleanup
Price declines. Excess leverage clears. Weak positioning exits.
Volatility compresses near the bottom as liquidity stabilizes.
Phase 2 – Base Formation
Sideways structure. Sentiment remains skeptical.
Accumulation happens quietly while narratives stay muted.
Phase 3 – Expansion
Momentum returns. Higher highs form.
Liquidity expands alongside participation.
New all-time highs develop only after structure confirms.
Now look at the present context.
We’ve already seen a correction phase that reset leverage and sentiment. The question is whether this compression is transitioning into a growth-loading phase — or whether more structural rebuilding is required.
For a true growth phase to begin, $BTC needs:
• Clear higher lows on higher timeframes
• Resistance zones reclaimed with follow-through
• Expanding volume, not thinning liquidity
• Reduced volatility on pullbacks
Cycles are not about predicting the exact week of reversal.
They’re about recognizing phase shifts.
If the contraction has largely completed, the market will start showing it through structure first — not headlines.
Correction phases exhaust participants.
Growth phases reward patience.
Right now, the chart is closer to transition than collapse.
But confirmation always comes from price behavior, not from cycle theory alone.
#BTC #Bitcoin #Crypto
{future}(BTCUSDT)
Bitcoin Cycle Mechanics: Compression Before Expansion?
There’s a recurring rhythm in $BTC that many overlook:
Roughly 1 year of contraction → followed by ~3 years of expansion.
Not perfectly timed.
Not mechanically identical.
But structurally consistent.
How the cycle typically unfolds:
Phase 1 – Cleanup
Price declines. Excess leverage clears. Weak positioning exits.
Volatility compresses near the bottom as liquidity stabilizes.
Phase 2 – Base Formation
Sideways structure. Sentiment remains skeptical.
Accumulation happens quietly while narratives stay muted.
Phase 3 – Expansion
Momentum returns. Higher highs form.
Liquidity expands alongside participation.
New all-time highs develop only after structure confirms.
Now look at the present context.
We’ve already seen a correction phase that reset leverage and sentiment. The question is whether this compression is transitioning into a growth-loading phase — or whether more structural rebuilding is required.
For a true growth phase to begin, $BTC needs:
• Clear higher lows on higher timeframes
• Resistance zones reclaimed with follow-through
• Expanding volume, not thinning liquidity
• Reduced volatility on pullbacks
Cycles are not about predicting the exact week of reversal.
They’re about recognizing phase shifts.
If the contraction has largely completed, the market will start showing it through structure first — not headlines.
Correction phases exhaust participants.
Growth phases reward patience.
Right now, the chart is closer to transition than collapse.
But confirmation always comes from price behavior, not from cycle theory alone.
#BTC #Bitcoin #Crypto
Roughly 1 year of contraction → followed by ~3 years of expansion.
Not perfectly timed.
Not mechanically identical.
But structurally consistent.
How the cycle typically unfolds:
Phase 1 – Cleanup
Price declines. Excess leverage clears. Weak positioning exits.
Volatility compresses near the bottom as liquidity stabilizes.
Phase 2 – Base Formation
Sideways structure. Sentiment remains skeptical.
Accumulation happens quietly while narratives stay muted.
Phase 3 – Expansion
Momentum returns. Higher highs form.
Liquidity expands alongside participation.
New all-time highs develop only after structure confirms.
Now look at the present context.
We’ve already seen a correction phase that reset leverage and sentiment. The question is whether this compression is transitioning into a growth-loading phase — or whether more structural rebuilding is required.
For a true growth phase to begin, $BTC needs:
• Clear higher lows on higher timeframes
• Resistance zones reclaimed with follow-through
• Expanding volume, not thinning liquidity
• Reduced volatility on pullbacks
Cycles are not about predicting the exact week of reversal.
They’re about recognizing phase shifts.
If the contraction has largely completed, the market will start showing it through structure first — not headlines.
Correction phases exhaust participants.
Growth phases reward patience.
Right now, the chart is closer to transition than collapse.
But confirmation always comes from price behavior, not from cycle theory alone.
#BTC #Bitcoin #Crypto
12
6
73
69.1k
Article
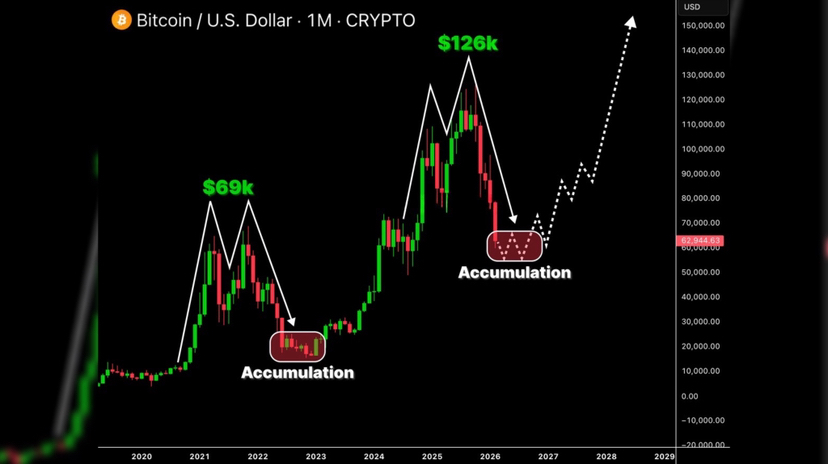
Bitcoin: Is the 2019–2022 Structure Repeating?There’s a growing narrative that $BTC is mirroring the 2019–2022 cycle almost step by step.
The sequence looks familiar:
Double top → sharp correction → extended accumulation → expansion phase.
On higher timeframes, the structural resemblance is noticeable. After a euphoric peak, price retraces aggressively, volatility compresses, and the market shifts into a prolonged sideways range where both bulls and bears lose conviction. That’s typically where long-term positioning quietly rebuilds.
But similarity is not certainty.
In 2019, the accumulation phase formed after liquidity was fully flushed and volatility contracted significantly. The breakout only happened once structure shifted — higher lows, resistance reclaim, sustained volume expansion.
If the pattern truly repeats, the current phase would represent late-stage consolidation rather than early-stage collapse.
However, there are a few conditions to monitor before concluding we are “closer to the bottom”:
• Is selling pressure decreasing on each push lower?
• Are higher timeframe lows holding consistently?
• Is liquidity being absorbed instead of aggressively rejected?
• Is volatility compressing instead of expanding?
Accumulation is not about blindly buying weakness. It’s about recognizing when downside momentum fades and structure stabilizes.
If this is indeed a historical rhyme, positioning during consolidation — not during breakout euphoria — tends to offer the best asymmetric opportunity.
But confirmation always comes from structure, not from pattern comparison alone.
Markets can echo the past.
They don’t copy it perfectly.
If you’re building positions, do it with structure awareness — not just historical optimism.
$BTC #Bitcoin #Crypto
{future}(BTCUSDT)
Bitcoin: Is the 2019–2022 Structure Repeating?
There’s a growing narrative that $BTC is mirroring the 2019–2022 cycle almost step by step.
The sequence looks familiar:
Double top → sharp correction → extended accumulation → expansion phase.
On higher timeframes, the structural resemblance is noticeable. After a euphoric peak, price retraces aggressively, volatility compresses, and the market shifts into a prolonged sideways range where both bulls and bears lose conviction. That’s typically where long-term positioning quietly rebuilds.
But similarity is not certainty.
In 2019, the accumulation phase formed after liquidity was fully flushed and volatility contracted significantly. The breakout only happened once structure shifted — higher lows, resistance reclaim, sustained volume expansion.
If the pattern truly repeats, the current phase would represent late-stage consolidation rather than early-stage collapse.
However, there are a few conditions to monitor before concluding we are “closer to the bottom”:
• Is selling pressure decreasing on each push lower?
• Are higher timeframe lows holding consistently?
• Is liquidity being absorbed instead of aggressively rejected?
• Is volatility compressing instead of expanding?
Accumulation is not about blindly buying weakness. It’s about recognizing when downside momentum fades and structure stabilizes.
If this is indeed a historical rhyme, positioning during consolidation — not during breakout euphoria — tends to offer the best asymmetric opportunity.
But confirmation always comes from structure, not from pattern comparison alone.
Markets can echo the past.
They don’t copy it perfectly.
If you’re building positions, do it with structure awareness — not just historical optimism.
$BTC #Bitcoin #Crypto
The sequence looks familiar:
Double top → sharp correction → extended accumulation → expansion phase.
On higher timeframes, the structural resemblance is noticeable. After a euphoric peak, price retraces aggressively, volatility compresses, and the market shifts into a prolonged sideways range where both bulls and bears lose conviction. That’s typically where long-term positioning quietly rebuilds.
But similarity is not certainty.
In 2019, the accumulation phase formed after liquidity was fully flushed and volatility contracted significantly. The breakout only happened once structure shifted — higher lows, resistance reclaim, sustained volume expansion.
If the pattern truly repeats, the current phase would represent late-stage consolidation rather than early-stage collapse.
However, there are a few conditions to monitor before concluding we are “closer to the bottom”:
• Is selling pressure decreasing on each push lower?
• Are higher timeframe lows holding consistently?
• Is liquidity being absorbed instead of aggressively rejected?
• Is volatility compressing instead of expanding?
Accumulation is not about blindly buying weakness. It’s about recognizing when downside momentum fades and structure stabilizes.
If this is indeed a historical rhyme, positioning during consolidation — not during breakout euphoria — tends to offer the best asymmetric opportunity.
But confirmation always comes from structure, not from pattern comparison alone.
Markets can echo the past.
They don’t copy it perfectly.
If you’re building positions, do it with structure awareness — not just historical optimism.
$BTC #Bitcoin #Crypto
8
6
90
109k
Article
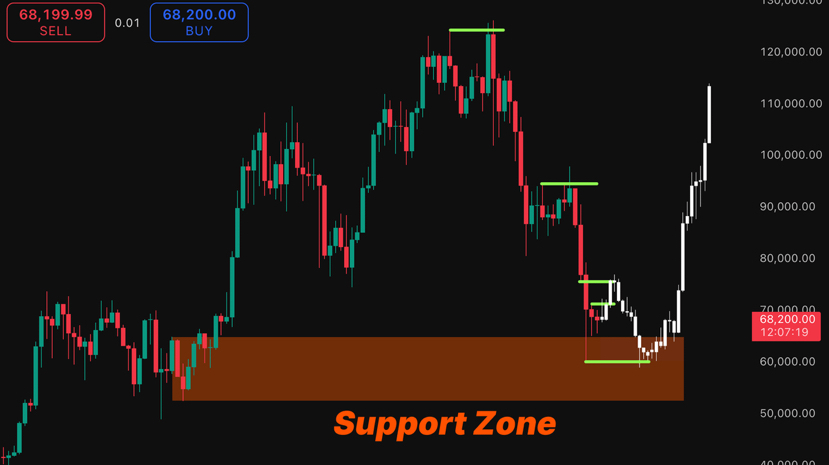
BTC Range Update — The Tape Already SpokeThis is what a real post-capitulation range looks like.
The drop to $60K wasn’t random volatility.
It was a selling climax.
Forced liquidations. Panic exits. Peak supply.
That low defines the floor.
The bounce to $72K wasn’t strength returning.
It was a reaction rally.
Short covering. Relief. Mechanical mean reversion.
That high defines the ceiling.
Now you have the battlefield:
$60K–$72K.
And this is where most traders get it wrong.
A Range Isn’t Noise — It’s A Process
After a heavy selloff, the range isn’t sideways chaos.
It’s a negotiation.
It answers one question:
Who is quietly gaining control?
If buyers are absorbing supply:
• Volume contracts over time
• Pullbacks get shallower
• Down candles shrink
• Upside expansions widen
That’s accumulation.
If sellers remain dominant:
• Volume stays elevated
• Drops expand aggressively
• Bounces overlap and stall
• Lower highs form inside the box
That’s distribution.
What The Structure Actually Shows
Look closely at how this range matured.
Volume never meaningfully cooled.
Upside attempts lacked follow-through.
Down candles consistently expanded wider than the up legs.
Sellers pressed for two consecutive weeks.
That’s not neutral tape.
That’s pressure.
The climax and the reaction rally only set the boundaries.
The real information comes from behavior inside the box.
And the behavior hasn’t been buyer-controlled.
Why Most Traders Misread It
People see chop and assume equilibrium.
But ranges after heavy selloffs often resolve in the direction of internal pressure.
If sellers dominate inside the range, the eventual break usually comes lower.
Not because of drama.
Because of exhaustion.
The Key Takeaway
$60K–$72K is not random consolidation.
It’s a structural decision zone.
The tape has been leaning one direction.
Most see sideways.
The market is actually revealing intent.
$BTC #Bitcoin #Crypto
{future}(BTCUSDT)
BTC Range Update — The Tape Already Spoke
This is what a real post-capitulation range looks like.
The drop to $60K wasn’t random volatility.
It was a selling climax.
Forced liquidations. Panic exits. Peak supply.
That low defines the floor.
The bounce to $72K wasn’t strength returning.
It was a reaction rally.
Short covering. Relief. Mechanical mean reversion.
That high defines the ceiling.
Now you have the battlefield:
$60K–$72K.
And this is where most traders get it wrong.
A Range Isn’t Noise — It’s A Process
After a heavy selloff, the range isn’t sideways chaos.
It’s a negotiation.
It answers one question:
Who is quietly gaining control?
If buyers are absorbing supply:
• Volume contracts over time
• Pullbacks get shallower
• Down candles shrink
• Upside expansions widen
That’s accumulation.
If sellers remain dominant:
• Volume stays elevated
• Drops expand aggressively
• Bounces overlap and stall
• Lower highs form inside the box
That’s distribution.
What The Structure Actually Shows
Look closely at how this range matured.
Volume never meaningfully cooled.
Upside attempts lacked follow-through.
Down candles consistently expanded wider than the up legs.
Sellers pressed for two consecutive weeks.
That’s not neutral tape.
That’s pressure.
The climax and the reaction rally only set the boundaries.
The real information comes from behavior inside the box.
And the behavior hasn’t been buyer-controlled.
Why Most Traders Misread It
People see chop and assume equilibrium.
But ranges after heavy selloffs often resolve in the direction of internal pressure.
If sellers dominate inside the range, the eventual break usually comes lower.
Not because of drama.
Because of exhaustion.
The Key Takeaway
$60K–$72K is not random consolidation.
It’s a structural decision zone.
The tape has been leaning one direction.
Most see sideways.
The market is actually revealing intent.
$BTC #Bitcoin #Crypto
The drop to $60K wasn’t random volatility.
It was a selling climax.
Forced liquidations. Panic exits. Peak supply.
That low defines the floor.
The bounce to $72K wasn’t strength returning.
It was a reaction rally.
Short covering. Relief. Mechanical mean reversion.
That high defines the ceiling.
Now you have the battlefield:
$60K–$72K.
And this is where most traders get it wrong.
A Range Isn’t Noise — It’s A Process
After a heavy selloff, the range isn’t sideways chaos.
It’s a negotiation.
It answers one question:
Who is quietly gaining control?
If buyers are absorbing supply:
• Volume contracts over time
• Pullbacks get shallower
• Down candles shrink
• Upside expansions widen
That’s accumulation.
If sellers remain dominant:
• Volume stays elevated
• Drops expand aggressively
• Bounces overlap and stall
• Lower highs form inside the box
That’s distribution.
What The Structure Actually Shows
Look closely at how this range matured.
Volume never meaningfully cooled.
Upside attempts lacked follow-through.
Down candles consistently expanded wider than the up legs.
Sellers pressed for two consecutive weeks.
That’s not neutral tape.
That’s pressure.
The climax and the reaction rally only set the boundaries.
The real information comes from behavior inside the box.
And the behavior hasn’t been buyer-controlled.
Why Most Traders Misread It
People see chop and assume equilibrium.
But ranges after heavy selloffs often resolve in the direction of internal pressure.
If sellers dominate inside the range, the eventual break usually comes lower.
Not because of drama.
Because of exhaustion.
The Key Takeaway
$60K–$72K is not random consolidation.
It’s a structural decision zone.
The tape has been leaning one direction.
Most see sideways.
The market is actually revealing intent.
$BTC #Bitcoin #Crypto
3
1
37
22.9k
Article
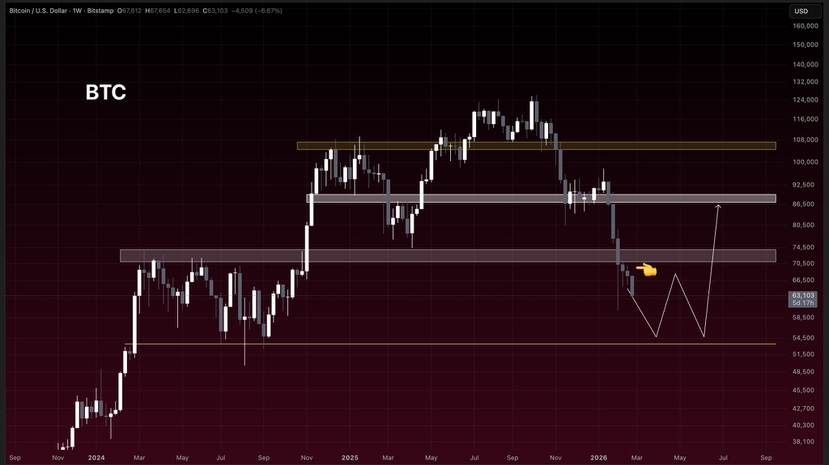
BTC Lost $70K — And That Changes The StructureFor nearly a year, the $70K–$71K weekly band acted as a structural shelf.
Support.
Acceptance.
Confidence.
Now it’s gone.
And this isn’t about intraday wicks — we’re talking about weekly closes below the level. That’s a structural shift, not noise.
When a level holds that long and then breaks, pretending nothing changed is dangerous.
Why $70K Mattered
That zone wasn’t just psychological.
It represented:
• Prior breakout acceptance
• High-volume consolidation
• Institutional cost clusters
• Trend continuation support
Once price loses a level like that and starts closing below it, it flips from support → resistance.
That grey shelf now caps upside until reclaimed.
The Downside Map
As long as $BTC remains below that weekly band:
➜ $60K becomes the first liquidity magnet
➜ $53K (yellow zone) becomes the deeper structural test
Those aren’t dramatic predictions — they’re logical liquidity pools below the breakdown.
Markets move toward inefficiencies.
Right now, liquidity sits lower.
What Flips The Script
The invalidation is simple:
Reclaim $70.8K
Close ABOVE it on a weekly basis
Hold it — not spike it
If that happens, the breakdown becomes a shakeout.
Structure would rotate back toward:
• Mid-$70Ks
• Possibly $80Ks
But until that reclaim happens, the burden of proof stays with bulls.
This Isn’t Emotional — It’s Structural
Every breakdown thesis needs an invalidation.
Here it is.
Below $70K weekly = defensive posture
Above $70.8K weekly hold = structural recovery
No guessing. No bias.
Just levels.
Right now, price is trading beneath a level that defined the market for a year.
That’s not something to ignore.
It’s something to respect.
$BTC #Bitcoin #Crypto
{future}(BTCUSDT)
BTC Lost $70K — And That Changes The Structure
For nearly a year, the $70K–$71K weekly band acted as a structural shelf.
Support.
Acceptance.
Confidence.
Now it’s gone.
And this isn’t about intraday wicks — we’re talking about weekly closes below the level. That’s a structural shift, not noise.
When a level holds that long and then breaks, pretending nothing changed is dangerous.
Why $70K Mattered
That zone wasn’t just psychological.
It represented:
• Prior breakout acceptance
• High-volume consolidation
• Institutional cost clusters
• Trend continuation support
Once price loses a level like that and starts closing below it, it flips from support → resistance.
That grey shelf now caps upside until reclaimed.
The Downside Map
As long as $BTC remains below that weekly band:
➜ $60K becomes the first liquidity magnet
➜ $53K (yellow zone) becomes the deeper structural test
Those aren’t dramatic predictions — they’re logical liquidity pools below the breakdown.
Markets move toward inefficiencies.
Right now, liquidity sits lower.
What Flips The Script
The invalidation is simple:
Reclaim $70.8K
Close ABOVE it on a weekly basis
Hold it — not spike it
If that happens, the breakdown becomes a shakeout.
Structure would rotate back toward:
• Mid-$70Ks
• Possibly $80Ks
But until that reclaim happens, the burden of proof stays with bulls.
This Isn’t Emotional — It’s Structural
Every breakdown thesis needs an invalidation.
Here it is.
Below $70K weekly = defensive posture
Above $70.8K weekly hold = structural recovery
No guessing. No bias.
Just levels.
Right now, price is trading beneath a level that defined the market for a year.
That’s not something to ignore.
It’s something to respect.
$BTC #Bitcoin #Crypto
Support.
Acceptance.
Confidence.
Now it’s gone.
And this isn’t about intraday wicks — we’re talking about weekly closes below the level. That’s a structural shift, not noise.
When a level holds that long and then breaks, pretending nothing changed is dangerous.
Why $70K Mattered
That zone wasn’t just psychological.
It represented:
• Prior breakout acceptance
• High-volume consolidation
• Institutional cost clusters
• Trend continuation support
Once price loses a level like that and starts closing below it, it flips from support → resistance.
That grey shelf now caps upside until reclaimed.
The Downside Map
As long as $BTC remains below that weekly band:
➜ $60K becomes the first liquidity magnet
➜ $53K (yellow zone) becomes the deeper structural test
Those aren’t dramatic predictions — they’re logical liquidity pools below the breakdown.
Markets move toward inefficiencies.
Right now, liquidity sits lower.
What Flips The Script
The invalidation is simple:
Reclaim $70.8K
Close ABOVE it on a weekly basis
Hold it — not spike it
If that happens, the breakdown becomes a shakeout.
Structure would rotate back toward:
• Mid-$70Ks
• Possibly $80Ks
But until that reclaim happens, the burden of proof stays with bulls.
This Isn’t Emotional — It’s Structural
Every breakdown thesis needs an invalidation.
Here it is.
Below $70K weekly = defensive posture
Above $70.8K weekly hold = structural recovery
No guessing. No bias.
Just levels.
Right now, price is trading beneath a level that defined the market for a year.
That’s not something to ignore.
It’s something to respect.
$BTC #Bitcoin #Crypto
15
7
27
20.7k
Article
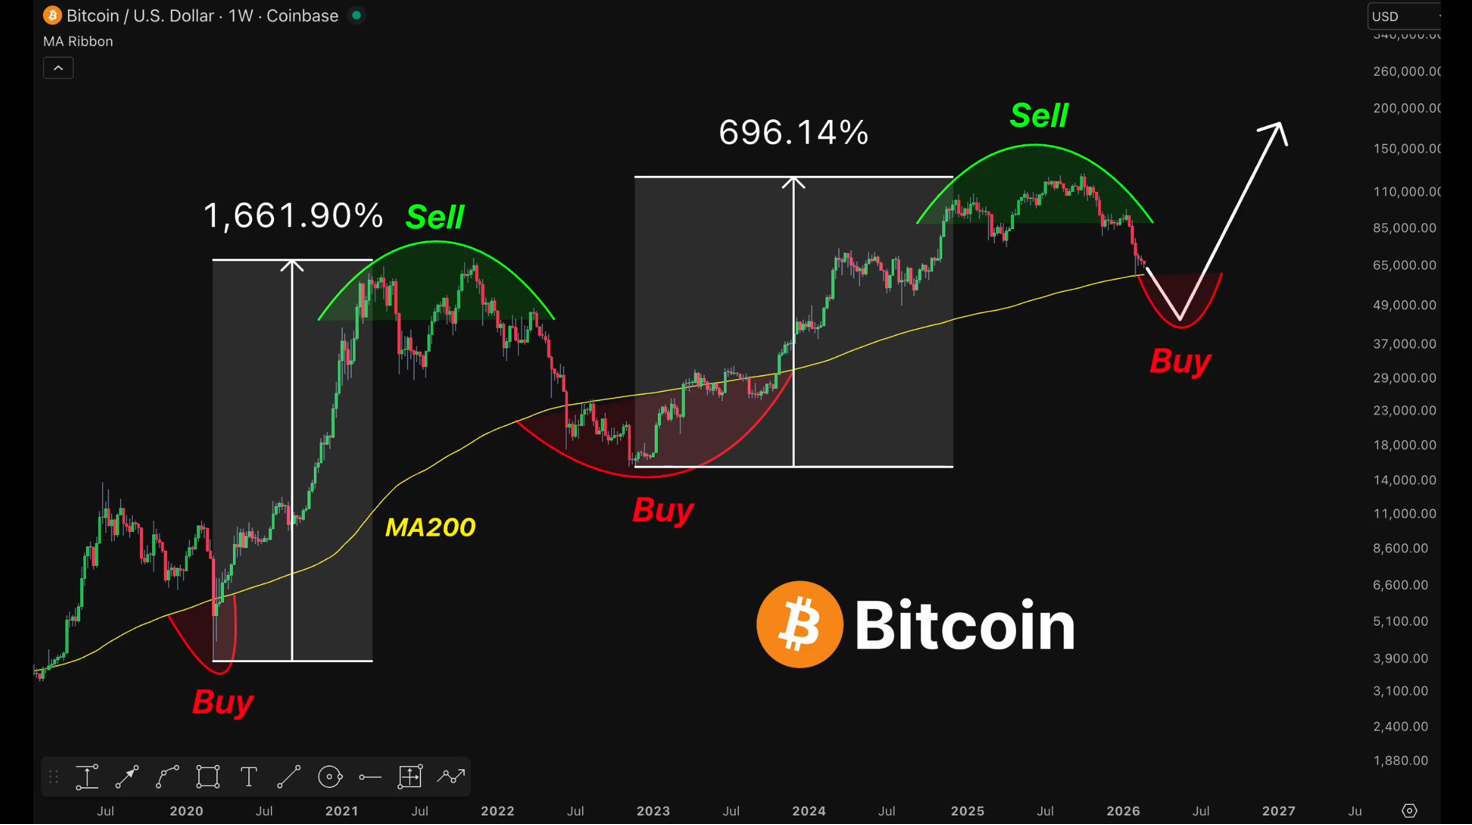
Why I Think BTC This Crypto Bull Cycle Has Already BegunFor months, the market felt exhausted.
Every bounce was sold.
Every breakout failed.
Confidence was thin.
But recently, the tone has shifted — not dramatically, not euphorically — just subtly and structurally. And that kind of shift is often how real bull cycles begin.
This doesn’t look like hype.
It looks like transition.
1. Structure Is Quietly Improving
In every major cycle, the change happens before the headlines catch up.
First, the lower lows stop printing.
Then higher lows begin forming.
Then pullbacks become shallower.
That’s what’s developing now.
Instead of cascading breakdowns, dips are getting absorbed faster. Volatility feels controlled rather than chaotic. The market isn’t collapsing on weakness — it’s stabilizing.
Structural resilience is the earliest bullish tell.
2. BTC Is Acting Like a Leader Again
Bitcoin doesn’t need vertical candles to signal strength.
Slow grinding accumulation is often more powerful than explosive rallies. When $BTC holds levels despite negative sentiment and reclaims key zones without euphoria, it suggests positioning — not speculation.
Bull markets often start in boredom.
Not excitement.
Right now feels more like silent positioning than retail mania.
3. Liquidity Is Slowly Returning
Crypto doesn’t move on hope.
It moves on liquidity.
We’re beginning to see capital rotate back into risk assets. Institutional participation is more measured, but it’s present. Long-term investors are engaging again.
Liquidity expansions always precede strong crypto cycles.
When money flows, crypto tends to amplify.
And the early flow signals are appearing.
4. Ethereum and Infrastructure Are Quietly Building
Ethereum doesn’t always lead loudly.
In past cycles, $ETH often lagged slightly before accelerating aggressively. Development activity remains consistent. On-chain engagement hasn’t collapsed.
Strong ecosystems build before price reacts.
That pattern looks familiar.
5. Altcoins Are Showing Selective Strength
Deep bear markets crush everything indiscriminately.
That’s not happening now.
We’re seeing selective rotation:
• AI-related projects
• Infrastructure protocols
• High-liquidity meme assets
Not everything is pumping — and that’s healthy.
Early bull phases reward selectivity, not chaos.
6. Sentiment Is Still Skeptical
This might be the strongest signal of all.
People are cautious.
Narratives are restrained.
Doubt dominates discussions.
True bull markets don’t begin with consensus optimism. They begin when most participants remain defensive.
When everyone agrees it’s bullish, the easy move is gone.
Right now, skepticism remains high — and that’s constructive.
7. On-Chain Behavior Is Supportive
Long-term holders aren’t distributing aggressively.
Supply isn’t flooding exchanges.
Coins are moving into stronger hands.
Selling pressure feels absorbed rather than expanding.
Tightening supply combined with gradual demand recovery creates sustainable conditions.
Not explosive — sustainable.
8. The Market Is Absorbing Bad News
In bear markets, negative headlines cause violent reactions.
Recently, bad news hasn’t triggered collapse. Price reacts — but doesn’t cascade.
That shift in reaction function matters.
Markets that absorb negativity tend to be transitioning upward.
Important Reality
This doesn’t mean straight-line gains.
Early bull cycles are messy:
• Choppy ranges
• Fake breakdowns
• Frustrating consolidations
They don’t feel obvious.
They feel confusing.
Only later do they become obvious in hindsight.
Why I Believe the Shift Is Underway
Because:
• Structure is stabilizing
• Liquidity is rotating
• Supply is tightening
• Sentiment remains skeptical
• Downside reactions are weakening
That alignment doesn’t guarantee parabolic upside tomorrow.
But it strongly resembles the early stages of past cycle transitions.
Bull markets don’t begin with fireworks.
They begin with subtle strength.
And right now, the market feels quietly strong.
That’s usually how the biggest moves start.
#Bitcoin #Ethereum #Crypto
{future}(BTCUSDT)
{future}(ETHUSDT)
Why I Think BTC This Crypto Bull Cycle Has Already Begun
For months, the market felt exhausted.
Every bounce was sold.
Every breakout failed.
Confidence was thin.
But recently, the tone has shifted — not dramatically, not euphorically — just subtly and structurally. And that kind of shift is often how real bull cycles begin.
This doesn’t look like hype.
It looks like transition.
1. Structure Is Quietly Improving
In every major cycle, the change happens before the headlines catch up.
First, the lower lows stop printing.
Then higher lows begin forming.
Then pullbacks become shallower.
That’s what’s developing now.
Instead of cascading breakdowns, dips are getting absorbed faster. Volatility feels controlled rather than chaotic. The market isn’t collapsing on weakness — it’s stabilizing.
Structural resilience is the earliest bullish tell.
2. BTC Is Acting Like a Leader Again
Bitcoin doesn’t need vertical candles to signal strength.
Slow grinding accumulation is often more powerful than explosive rallies. When $BTC holds levels despite negative sentiment and reclaims key zones without euphoria, it suggests positioning — not speculation.
Bull markets often start in boredom.
Not excitement.
Right now feels more like silent positioning than retail mania.
3. Liquidity Is Slowly Returning
Crypto doesn’t move on hope.
It moves on liquidity.
We’re beginning to see capital rotate back into risk assets. Institutional participation is more measured, but it’s present. Long-term investors are engaging again.
Liquidity expansions always precede strong crypto cycles.
When money flows, crypto tends to amplify.
And the early flow signals are appearing.
4. Ethereum and Infrastructure Are Quietly Building
Ethereum doesn’t always lead loudly.
In past cycles, $ETH often lagged slightly before accelerating aggressively. Development activity remains consistent. On-chain engagement hasn’t collapsed.
Strong ecosystems build before price reacts.
That pattern looks familiar.
5. Altcoins Are Showing Selective Strength
Deep bear markets crush everything indiscriminately.
That’s not happening now.
We’re seeing selective rotation:
• AI-related projects
• Infrastructure protocols
• High-liquidity meme assets
Not everything is pumping — and that’s healthy.
Early bull phases reward selectivity, not chaos.
6. Sentiment Is Still Skeptical
This might be the strongest signal of all.
People are cautious.
Narratives are restrained.
Doubt dominates discussions.
True bull markets don’t begin with consensus optimism. They begin when most participants remain defensive.
When everyone agrees it’s bullish, the easy move is gone.
Right now, skepticism remains high — and that’s constructive.
7. On-Chain Behavior Is Supportive
Long-term holders aren’t distributing aggressively.
Supply isn’t flooding exchanges.
Coins are moving into stronger hands.
Selling pressure feels absorbed rather than expanding.
Tightening supply combined with gradual demand recovery creates sustainable conditions.
Not explosive — sustainable.
8. The Market Is Absorbing Bad News
In bear markets, negative headlines cause violent reactions.
Recently, bad news hasn’t triggered collapse. Price reacts — but doesn’t cascade.
That shift in reaction function matters.
Markets that absorb negativity tend to be transitioning upward.
Important Reality
This doesn’t mean straight-line gains.
Early bull cycles are messy:
• Choppy ranges
• Fake breakdowns
• Frustrating consolidations
They don’t feel obvious.
They feel confusing.
Only later do they become obvious in hindsight.
Why I Believe the Shift Is Underway
Because:
• Structure is stabilizing
• Liquidity is rotating
• Supply is tightening
• Sentiment remains skeptical
• Downside reactions are weakening
That alignment doesn’t guarantee parabolic upside tomorrow.
But it strongly resembles the early stages of past cycle transitions.
Bull markets don’t begin with fireworks.
They begin with subtle strength.
And right now, the market feels quietly strong.
That’s usually how the biggest moves start.
#Bitcoin #Ethereum #Crypto
Every bounce was sold.
Every breakout failed.
Confidence was thin.
But recently, the tone has shifted — not dramatically, not euphorically — just subtly and structurally. And that kind of shift is often how real bull cycles begin.
This doesn’t look like hype.
It looks like transition.
1. Structure Is Quietly Improving
In every major cycle, the change happens before the headlines catch up.
First, the lower lows stop printing.
Then higher lows begin forming.
Then pullbacks become shallower.
That’s what’s developing now.
Instead of cascading breakdowns, dips are getting absorbed faster. Volatility feels controlled rather than chaotic. The market isn’t collapsing on weakness — it’s stabilizing.
Structural resilience is the earliest bullish tell.
2. BTC Is Acting Like a Leader Again
Bitcoin doesn’t need vertical candles to signal strength.
Slow grinding accumulation is often more powerful than explosive rallies. When $BTC holds levels despite negative sentiment and reclaims key zones without euphoria, it suggests positioning — not speculation.
Bull markets often start in boredom.
Not excitement.
Right now feels more like silent positioning than retail mania.
3. Liquidity Is Slowly Returning
Crypto doesn’t move on hope.
It moves on liquidity.
We’re beginning to see capital rotate back into risk assets. Institutional participation is more measured, but it’s present. Long-term investors are engaging again.
Liquidity expansions always precede strong crypto cycles.
When money flows, crypto tends to amplify.
And the early flow signals are appearing.
4. Ethereum and Infrastructure Are Quietly Building
Ethereum doesn’t always lead loudly.
In past cycles, $ETH often lagged slightly before accelerating aggressively. Development activity remains consistent. On-chain engagement hasn’t collapsed.
Strong ecosystems build before price reacts.
That pattern looks familiar.
5. Altcoins Are Showing Selective Strength
Deep bear markets crush everything indiscriminately.
That’s not happening now.
We’re seeing selective rotation:
• AI-related projects
• Infrastructure protocols
• High-liquidity meme assets
Not everything is pumping — and that’s healthy.
Early bull phases reward selectivity, not chaos.
6. Sentiment Is Still Skeptical
This might be the strongest signal of all.
People are cautious.
Narratives are restrained.
Doubt dominates discussions.
True bull markets don’t begin with consensus optimism. They begin when most participants remain defensive.
When everyone agrees it’s bullish, the easy move is gone.
Right now, skepticism remains high — and that’s constructive.
7. On-Chain Behavior Is Supportive
Long-term holders aren’t distributing aggressively.
Supply isn’t flooding exchanges.
Coins are moving into stronger hands.
Selling pressure feels absorbed rather than expanding.
Tightening supply combined with gradual demand recovery creates sustainable conditions.
Not explosive — sustainable.
8. The Market Is Absorbing Bad News
In bear markets, negative headlines cause violent reactions.
Recently, bad news hasn’t triggered collapse. Price reacts — but doesn’t cascade.
That shift in reaction function matters.
Markets that absorb negativity tend to be transitioning upward.
Important Reality
This doesn’t mean straight-line gains.
Early bull cycles are messy:
• Choppy ranges
• Fake breakdowns
• Frustrating consolidations
They don’t feel obvious.
They feel confusing.
Only later do they become obvious in hindsight.
Why I Believe the Shift Is Underway
Because:
• Structure is stabilizing
• Liquidity is rotating
• Supply is tightening
• Sentiment remains skeptical
• Downside reactions are weakening
That alignment doesn’t guarantee parabolic upside tomorrow.
But it strongly resembles the early stages of past cycle transitions.
Bull markets don’t begin with fireworks.
They begin with subtle strength.
And right now, the market feels quietly strong.
That’s usually how the biggest moves start.
#Bitcoin #Ethereum #Crypto
15
8
87
94.8k
Article
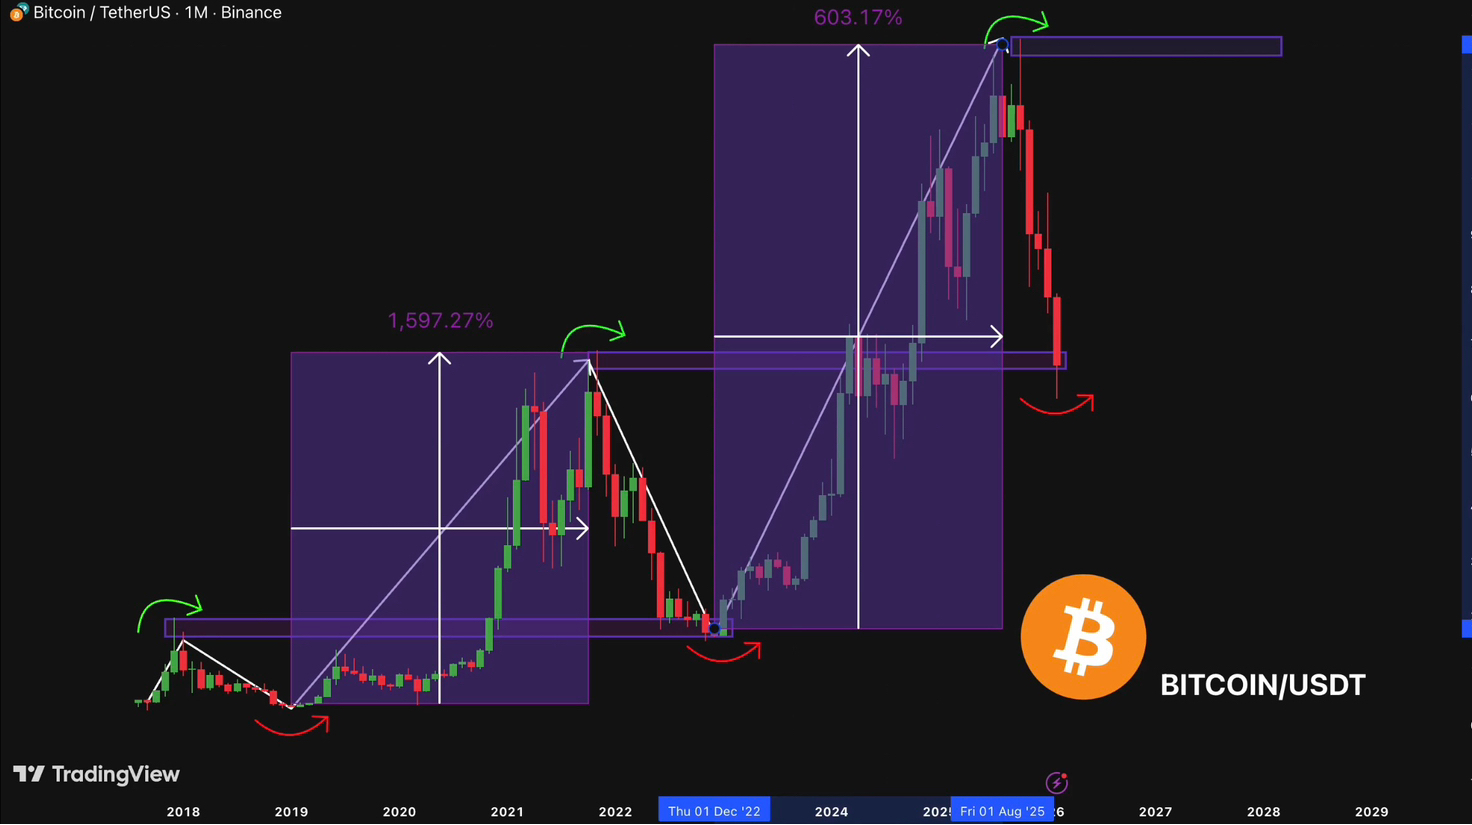
BTC At Historical Production Cost ZoneThere’s a level on the chart that doesn’t get enough attention.
Not resistance.
Not a trendline.
Not a moving average.
Production cost.
Right now, Bitcoin is trading very close to its estimated average mining cost — the same economic zone that has quietly marked every major macro bottom in previous cycles.
And that’s not random.
Why Production Cost Matters
Production cost represents the real economic floor of the network.
When price approaches this zone:
➜ Miner profit margins compress
➜ Aggressive selling slows down
➜ Inefficient miners shut off
➜ Network sell pressure naturally declines
Mining is a business. When margins shrink, forced supply decreases over time. That supply contraction changes the balance between buyers and sellers.
Not overnight.
But structurally.
The Historical Pattern
Look back at prior cycle bottoms:
• 2015 → Bottom formed near production cost
• 2018 → Bottom aligned with mining cost compression
• 2022 → Price stabilized around the same economic floor
• 2026 → Price once again testing that zone
Every time price fell materially below production cost, it didn’t stay there long. Extended mining at a loss is unsustainable.
Eventually, equilibrium returns.
What Typically Follows
This zone doesn’t trigger instant rallies.
It usually triggers a process:
➜ Volatility contracts
➜ Sentiment deteriorates
➜ Weak hands exit
➜ Stronger capital accumulates
➜ Structure slowly rebuilds
Only later does expansion begin.
By the time momentum returns, the opportunity window is already smaller.
The Psychology of This Phase
This is where:
• Fear dominates narratives
• Analysts call for extreme lower targets
• Retail conviction collapses
• Long-term capital quietly positions
Production cost zones don’t feel bullish when they form.
They feel uncomfortable.
That discomfort is part of the structure.
Important Context
This level is not a guaranteed bottom.
Black swans can push price lower temporarily.
Macro shocks can distort cycles.
But historically, production cost has acted as a gravity zone — a place where downside risk compresses relative to long-term upside.
Markets don’t respect this area because of magic.
They respect it because it reflects real economic pressure inside the system.
When economics stabilize, structure stabilizes.
And when structure stabilizes, cycles reset.
History doesn’t repeat perfectly.
But the rhythm of supply economics has remained surprisingly consistent.
Smart capital isn’t reacting emotionally here.
It’s observing the cost floor.
And so far, $BTC is trading right on top of it.
$BTC #Bitcoin #Crypto
{future}(BTCUSDT)
BTC At Historical Production Cost Zone
There’s a level on the chart that doesn’t get enough attention.
Not resistance.
Not a trendline.
Not a moving average.
Production cost.
Right now, Bitcoin is trading very close to its estimated average mining cost — the same economic zone that has quietly marked every major macro bottom in previous cycles.
And that’s not random.
Why Production Cost Matters
Production cost represents the real economic floor of the network.
When price approaches this zone:
➜ Miner profit margins compress
➜ Aggressive selling slows down
➜ Inefficient miners shut off
➜ Network sell pressure naturally declines
Mining is a business. When margins shrink, forced supply decreases over time. That supply contraction changes the balance between buyers and sellers.
Not overnight.
But structurally.
The Historical Pattern
Look back at prior cycle bottoms:
• 2015 → Bottom formed near production cost
• 2018 → Bottom aligned with mining cost compression
• 2022 → Price stabilized around the same economic floor
• 2026 → Price once again testing that zone
Every time price fell materially below production cost, it didn’t stay there long. Extended mining at a loss is unsustainable.
Eventually, equilibrium returns.
What Typically Follows
This zone doesn’t trigger instant rallies.
It usually triggers a process:
➜ Volatility contracts
➜ Sentiment deteriorates
➜ Weak hands exit
➜ Stronger capital accumulates
➜ Structure slowly rebuilds
Only later does expansion begin.
By the time momentum returns, the opportunity window is already smaller.
The Psychology of This Phase
This is where:
• Fear dominates narratives
• Analysts call for extreme lower targets
• Retail conviction collapses
• Long-term capital quietly positions
Production cost zones don’t feel bullish when they form.
They feel uncomfortable.
That discomfort is part of the structure.
Important Context
This level is not a guaranteed bottom.
Black swans can push price lower temporarily.
Macro shocks can distort cycles.
But historically, production cost has acted as a gravity zone — a place where downside risk compresses relative to long-term upside.
Markets don’t respect this area because of magic.
They respect it because it reflects real economic pressure inside the system.
When economics stabilize, structure stabilizes.
And when structure stabilizes, cycles reset.
History doesn’t repeat perfectly.
But the rhythm of supply economics has remained surprisingly consistent.
Smart capital isn’t reacting emotionally here.
It’s observing the cost floor.
And so far, $BTC is trading right on top of it.
$BTC #Bitcoin #Crypto
Not resistance.
Not a trendline.
Not a moving average.
Production cost.
Right now, Bitcoin is trading very close to its estimated average mining cost — the same economic zone that has quietly marked every major macro bottom in previous cycles.
And that’s not random.
Why Production Cost Matters
Production cost represents the real economic floor of the network.
When price approaches this zone:
➜ Miner profit margins compress
➜ Aggressive selling slows down
➜ Inefficient miners shut off
➜ Network sell pressure naturally declines
Mining is a business. When margins shrink, forced supply decreases over time. That supply contraction changes the balance between buyers and sellers.
Not overnight.
But structurally.
The Historical Pattern
Look back at prior cycle bottoms:
• 2015 → Bottom formed near production cost
• 2018 → Bottom aligned with mining cost compression
• 2022 → Price stabilized around the same economic floor
• 2026 → Price once again testing that zone
Every time price fell materially below production cost, it didn’t stay there long. Extended mining at a loss is unsustainable.
Eventually, equilibrium returns.
What Typically Follows
This zone doesn’t trigger instant rallies.
It usually triggers a process:
➜ Volatility contracts
➜ Sentiment deteriorates
➜ Weak hands exit
➜ Stronger capital accumulates
➜ Structure slowly rebuilds
Only later does expansion begin.
By the time momentum returns, the opportunity window is already smaller.
The Psychology of This Phase
This is where:
• Fear dominates narratives
• Analysts call for extreme lower targets
• Retail conviction collapses
• Long-term capital quietly positions
Production cost zones don’t feel bullish when they form.
They feel uncomfortable.
That discomfort is part of the structure.
Important Context
This level is not a guaranteed bottom.
Black swans can push price lower temporarily.
Macro shocks can distort cycles.
But historically, production cost has acted as a gravity zone — a place where downside risk compresses relative to long-term upside.
Markets don’t respect this area because of magic.
They respect it because it reflects real economic pressure inside the system.
When economics stabilize, structure stabilizes.
And when structure stabilizes, cycles reset.
History doesn’t repeat perfectly.
But the rhythm of supply economics has remained surprisingly consistent.
Smart capital isn’t reacting emotionally here.
It’s observing the cost floor.
And so far, $BTC is trading right on top of it.
$BTC #Bitcoin #Crypto
2
2
14
14.7k
Article
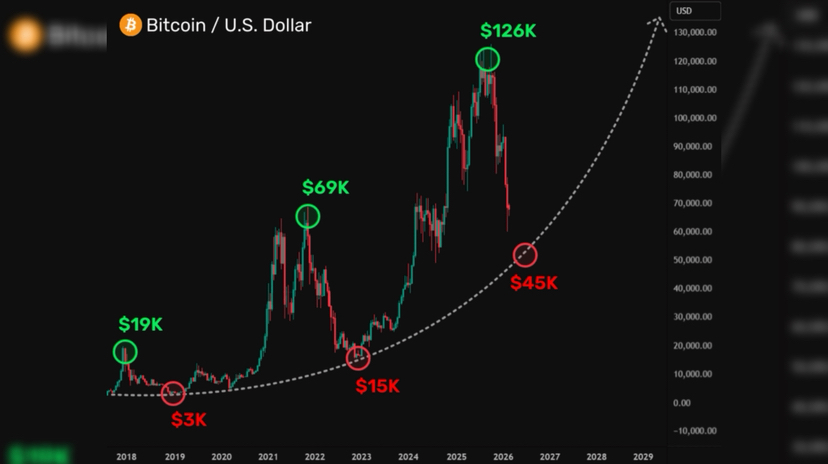
BTC At a Reversal Threshold: Hold the Low, Open the Path to $70KNo matter how you frame it, the current $BTC structure still leans toward a constructive scenario. When I look at the chart, one thing stands out clearly: the market is behaving exactly how strong trends often behave before expansion.
First, it did what needed to be done — it swept liquidity.
Thin pockets below support were taken out. Leveraged longs were flushed. Weak hands were removed. What remains is cleaner structure and redistributed positioning. That kind of reset is often a prerequisite before a sustainable move higher.
Interestingly, instead of squeezing shorts immediately by pushing higher, the market chose to clear downside leverage first. To me, that signals prioritization — remove excess long exposure before attempting expansion.
The Bearish Argument Still Exists
From a purely technical standpoint, one could argue that the recent move resembles a breakdown from a bearish flag, with deeper targets — potentially even below $50,000.
But if that scenario plays out, price would be driven directly into major long-term support — zones where historical demand has reacted aggressively. For bears, pushing price that deep without a significant macro catalyst would likely be overextension at this stage.
The Key Variable: The Most Recent Low
Everything now hinges on how price closes and reacts around the recent low.
If that zone:
• Holds firmly
• Shows absorption
• Builds higher lows
• Compresses volatility
Then the entire recent move shifts from “breakdown” to “tight accumulation.”
And in that case, the path toward $70K — and potentially higher — opens naturally through structural expansion.
This is still a scenario, not certainty.
But markets rarely expand without first cleaning out excess positioning.
Right now, the structure suggests that process may already be underway.
Hold the low — build the base — target expansion.
$BTC #Bitcoin #Crypto
{future}(BTCUSDT)
BTC At a Reversal Threshold: Hold the Low, Open the Path to $70K
No matter how you frame it, the current $BTC structure still leans toward a constructive scenario. When I look at the chart, one thing stands out clearly: the market is behaving exactly how strong trends often behave before expansion.
First, it did what needed to be done — it swept liquidity.
Thin pockets below support were taken out. Leveraged longs were flushed. Weak hands were removed. What remains is cleaner structure and redistributed positioning. That kind of reset is often a prerequisite before a sustainable move higher.
Interestingly, instead of squeezing shorts immediately by pushing higher, the market chose to clear downside leverage first. To me, that signals prioritization — remove excess long exposure before attempting expansion.
The Bearish Argument Still Exists
From a purely technical standpoint, one could argue that the recent move resembles a breakdown from a bearish flag, with deeper targets — potentially even below $50,000.
But if that scenario plays out, price would be driven directly into major long-term support — zones where historical demand has reacted aggressively. For bears, pushing price that deep without a significant macro catalyst would likely be overextension at this stage.
The Key Variable: The Most Recent Low
Everything now hinges on how price closes and reacts around the recent low.
If that zone:
• Holds firmly
• Shows absorption
• Builds higher lows
• Compresses volatility
Then the entire recent move shifts from “breakdown” to “tight accumulation.”
And in that case, the path toward $70K — and potentially higher — opens naturally through structural expansion.
This is still a scenario, not certainty.
But markets rarely expand without first cleaning out excess positioning.
Right now, the structure suggests that process may already be underway.
Hold the low — build the base — target expansion.
$BTC #Bitcoin #Crypto
First, it did what needed to be done — it swept liquidity.
Thin pockets below support were taken out. Leveraged longs were flushed. Weak hands were removed. What remains is cleaner structure and redistributed positioning. That kind of reset is often a prerequisite before a sustainable move higher.
Interestingly, instead of squeezing shorts immediately by pushing higher, the market chose to clear downside leverage first. To me, that signals prioritization — remove excess long exposure before attempting expansion.
The Bearish Argument Still Exists
From a purely technical standpoint, one could argue that the recent move resembles a breakdown from a bearish flag, with deeper targets — potentially even below $50,000.
But if that scenario plays out, price would be driven directly into major long-term support — zones where historical demand has reacted aggressively. For bears, pushing price that deep without a significant macro catalyst would likely be overextension at this stage.
The Key Variable: The Most Recent Low
Everything now hinges on how price closes and reacts around the recent low.
If that zone:
• Holds firmly
• Shows absorption
• Builds higher lows
• Compresses volatility
Then the entire recent move shifts from “breakdown” to “tight accumulation.”
And in that case, the path toward $70K — and potentially higher — opens naturally through structural expansion.
This is still a scenario, not certainty.
But markets rarely expand without first cleaning out excess positioning.
Right now, the structure suggests that process may already be underway.
Hold the low — build the base — target expansion.
$BTC #Bitcoin #Crypto
5
3
56
55.2k
Article
Data From 3 Bear Cycles: How Much Longer Until $BTC Finds a Bottom?Every cycle feels unique in the moment.
But when you zoom out, momentum behaves in surprisingly repetitive ways.
I compared the last three major bear markets using the monthly Stochastic — not as a crystal ball, but as a higher-timeframe momentum gauge.
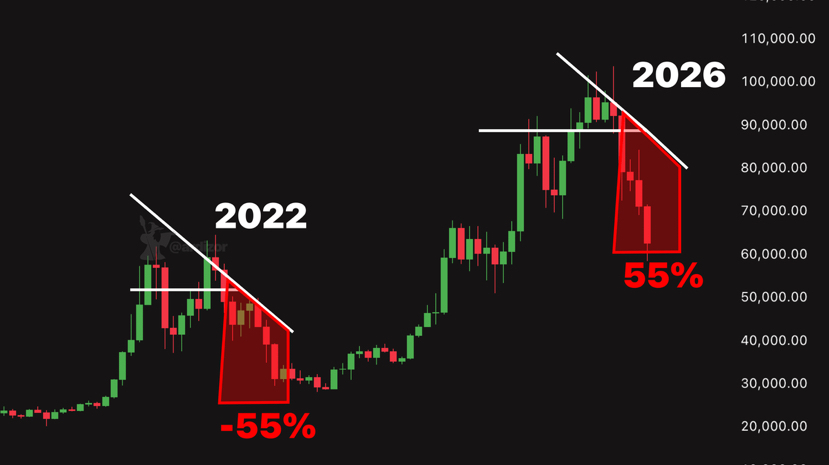
Right now, the monthly Stochastic sits around the 56th percentile and falling. That matters because historically, once momentum rolls over from this zone, the path toward deeper compression often continues.
What History Shows
From roughly the same momentum percentile in prior cycles:
• 2014–2015: ~396 days to reach the macro low
• 2018–2019: ~335 days
• 2022–2023: ~275 days
There’s a clear pattern:
Each bear cycle shortened by roughly 60 days.
If that structural compression continues, it suggests roughly ~200–220 days may remain before a comparable macro bottom forms.
That doesn’t mean price must follow that timeline — only that the momentum decay rhythm has been accelerating across cycles.
Important Clarification
Stochastic does not predict bottoms.
It confirms momentum exhaustion on a higher timeframe.
Historically:
• The strongest accumulation windows occurred when monthly Stochastic dropped below the 20th percentile
• Price often bottomed 2–4 months before the official momentum crossover
• Structural bases formed before sentiment shifted
Momentum confirms.
Structure leads.
What This Implies
If the pattern rhymes:
A potential macro bottom window could develop sometime in the mid-year zone — assuming no major black swan event accelerates or distorts the cycle.
But price alone isn’t enough.
What I’m watching for:
• A clearly defined accumulation range
• Volatility compression
• Diminishing sell pressure
• Monthly Stochastic approaching sub-20 territory
That confluence matters more than a specific dollar level.
Current Positioning
I’ve accumulated some spot exposure.
There are buy orders staged lower — including around the $50K region — but levels are secondary.
The real trigger is structural confirmation.
The Bigger Truth
No one knows the exact bottom.
Not analysts.
Not influencers.
Not even those who’ve navigated multiple cycles successfully.
But markets leave footprints.
Momentum weakens before reversal.
Liquidity dries before expansion.
Sentiment collapses before rebuilding.
Every cycle tells a story.
The question is whether you’re reacting emotionally — or reading the structure patiently.
$BTC #Bitcoin #Crypto
{future}(BTCUSDT)
Data From 3 Bear Cycles: How Much Longer Until $BTC Finds a Bottom?
Every cycle feels unique in the moment.
But when you zoom out, momentum behaves in surprisingly repetitive ways.
I compared the last three major bear markets using the monthly Stochastic — not as a crystal ball, but as a higher-timeframe momentum gauge.
Right now, the monthly Stochastic sits around the 56th percentile and falling. That matters because historically, once momentum rolls over from this zone, the path toward deeper compression often continues.
What History Shows
From roughly the same momentum percentile in prior cycles:
• 2014–2015: ~396 days to reach the macro low
• 2018–2019: ~335 days
• 2022–2023: ~275 days
There’s a clear pattern:
Each bear cycle shortened by roughly 60 days.
If that structural compression continues, it suggests roughly ~200–220 days may remain before a comparable macro bottom forms.
That doesn’t mean price must follow that timeline — only that the momentum decay rhythm has been accelerating across cycles.
Important Clarification
Stochastic does not predict bottoms.
It confirms momentum exhaustion on a higher timeframe.
Historically:
• The strongest accumulation windows occurred when monthly Stochastic dropped below the 20th percentile
• Price often bottomed 2–4 months before the official momentum crossover
• Structural bases formed before sentiment shifted
Momentum confirms.
Structure leads.
What This Implies
If the pattern rhymes:
A potential macro bottom window could develop sometime in the mid-year zone — assuming no major black swan event accelerates or distorts the cycle.
But price alone isn’t enough.
What I’m watching for:
• A clearly defined accumulation range
• Volatility compression
• Diminishing sell pressure
• Monthly Stochastic approaching sub-20 territory
That confluence matters more than a specific dollar level.
Current Positioning
I’ve accumulated some spot exposure.
There are buy orders staged lower — including around the $50K region — but levels are secondary.
The real trigger is structural confirmation.
The Bigger Truth
No one knows the exact bottom.
Not analysts.
Not influencers.
Not even those who’ve navigated multiple cycles successfully.
But markets leave footprints.
Momentum weakens before reversal.
Liquidity dries before expansion.
Sentiment collapses before rebuilding.
Every cycle tells a story.
The question is whether you’re reacting emotionally — or reading the structure patiently.
$BTC #Bitcoin #Crypto
But when you zoom out, momentum behaves in surprisingly repetitive ways.
I compared the last three major bear markets using the monthly Stochastic — not as a crystal ball, but as a higher-timeframe momentum gauge.
Right now, the monthly Stochastic sits around the 56th percentile and falling. That matters because historically, once momentum rolls over from this zone, the path toward deeper compression often continues.
What History Shows
From roughly the same momentum percentile in prior cycles:
• 2014–2015: ~396 days to reach the macro low
• 2018–2019: ~335 days
• 2022–2023: ~275 days
There’s a clear pattern:
Each bear cycle shortened by roughly 60 days.
If that structural compression continues, it suggests roughly ~200–220 days may remain before a comparable macro bottom forms.
That doesn’t mean price must follow that timeline — only that the momentum decay rhythm has been accelerating across cycles.
Important Clarification
Stochastic does not predict bottoms.
It confirms momentum exhaustion on a higher timeframe.
Historically:
• The strongest accumulation windows occurred when monthly Stochastic dropped below the 20th percentile
• Price often bottomed 2–4 months before the official momentum crossover
• Structural bases formed before sentiment shifted
Momentum confirms.
Structure leads.
What This Implies
If the pattern rhymes:
A potential macro bottom window could develop sometime in the mid-year zone — assuming no major black swan event accelerates or distorts the cycle.
But price alone isn’t enough.
What I’m watching for:
• A clearly defined accumulation range
• Volatility compression
• Diminishing sell pressure
• Monthly Stochastic approaching sub-20 territory
That confluence matters more than a specific dollar level.
Current Positioning
I’ve accumulated some spot exposure.
There are buy orders staged lower — including around the $50K region — but levels are secondary.
The real trigger is structural confirmation.
The Bigger Truth
No one knows the exact bottom.
Not analysts.
Not influencers.
Not even those who’ve navigated multiple cycles successfully.
But markets leave footprints.
Momentum weakens before reversal.
Liquidity dries before expansion.
Sentiment collapses before rebuilding.
Every cycle tells a story.
The question is whether you’re reacting emotionally — or reading the structure patiently.
$BTC #Bitcoin #Crypto
10
3
51
53.2k
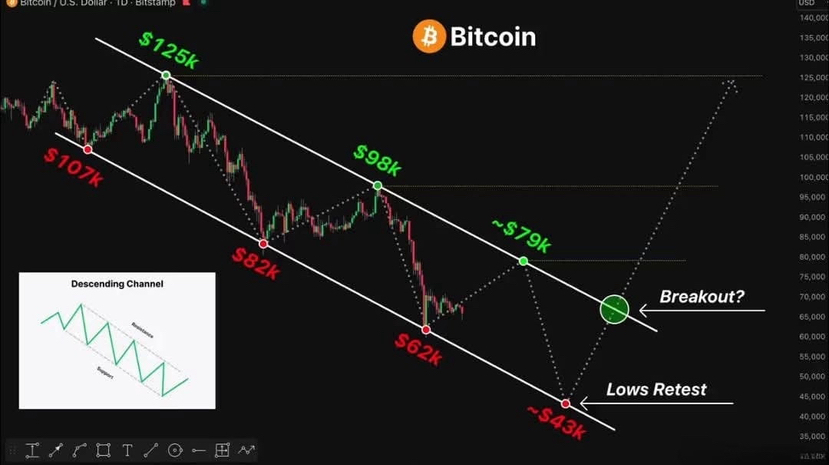
Article
BTC Descending Channel Structure in PlayZoom out and the sequence becomes clear.
$125K → $82K → $98K → $62K → ~$79K → ~$43K
Progressive lower highs.
Repeated support interactions.
Clean channel compression.
This isn’t random volatility — it’s a structured descending channel.
What the Pattern Tells Us
Inside the channel:
• Each rally fails below the previous high
• Each selloff revisits liquidity near support
• Volatility compresses over time
• Momentum weakens into the lower boundary
This kind of structure reflects controlled distribution and mechanical repricing — not chaotic collapse.
But descending channels eventually resolve.
And when they do, expansion tends to be decisive.
The Breakout Phase
If price establishes acceptance above the upper boundary:
• Lower-high structure breaks
• Shorts lose structural control
• Momentum flips from compression to expansion
• Liquidity above becomes fuel
Breakouts from prolonged descending channels historically produce aggressive moves — not slow drifts.
Because energy has been stored.
The Critical Detail
A wick above resistance isn’t enough.
The structure must:
• Close above the channel
• Hold the breakout on retest
• Print higher highs and higher lows
• Expand volume with momentum
Without that confirmation, it’s just another liquidity sweep.
If Structure Holds
Compression → Break → Expansion.
That’s the cycle.
If the breakout confirms, parabolic acceleration becomes structurally possible — not guaranteed, but possible.
Until then, it’s still a channel.
Watch the boundary.
That’s where compression turns into momentum.
$BTC #Bitcoin #Crypto
{future}(BTCUSDT)
BTC Descending Channel Structure in Play
Zoom out and the sequence becomes clear.
$125K → $82K → $98K → $62K → ~$79K → ~$43K
Progressive lower highs.
Repeated support interactions.
Clean channel compression.
This isn’t random volatility — it’s a structured descending channel.
What the Pattern Tells Us
Inside the channel:
• Each rally fails below the previous high
• Each selloff revisits liquidity near support
• Volatility compresses over time
• Momentum weakens into the lower boundary
This kind of structure reflects controlled distribution and mechanical repricing — not chaotic collapse.
But descending channels eventually resolve.
And when they do, expansion tends to be decisive.
The Breakout Phase
If price establishes acceptance above the upper boundary:
• Lower-high structure breaks
• Shorts lose structural control
• Momentum flips from compression to expansion
• Liquidity above becomes fuel
Breakouts from prolonged descending channels historically produce aggressive moves — not slow drifts.
Because energy has been stored.
The Critical Detail
A wick above resistance isn’t enough.
The structure must:
• Close above the channel
• Hold the breakout on retest
• Print higher highs and higher lows
• Expand volume with momentum
Without that confirmation, it’s just another liquidity sweep.
If Structure Holds
Compression → Break → Expansion.
That’s the cycle.
If the breakout confirms, parabolic acceleration becomes structurally possible — not guaranteed, but possible.
Until then, it’s still a channel.
Watch the boundary.
That’s where compression turns into momentum.
$BTC #Bitcoin #Crypto
$125K → $82K → $98K → $62K → ~$79K → ~$43K
Progressive lower highs.
Repeated support interactions.
Clean channel compression.
This isn’t random volatility — it’s a structured descending channel.
What the Pattern Tells Us
Inside the channel:
• Each rally fails below the previous high
• Each selloff revisits liquidity near support
• Volatility compresses over time
• Momentum weakens into the lower boundary
This kind of structure reflects controlled distribution and mechanical repricing — not chaotic collapse.
But descending channels eventually resolve.
And when they do, expansion tends to be decisive.
The Breakout Phase
If price establishes acceptance above the upper boundary:
• Lower-high structure breaks
• Shorts lose structural control
• Momentum flips from compression to expansion
• Liquidity above becomes fuel
Breakouts from prolonged descending channels historically produce aggressive moves — not slow drifts.
Because energy has been stored.
The Critical Detail
A wick above resistance isn’t enough.
The structure must:
• Close above the channel
• Hold the breakout on retest
• Print higher highs and higher lows
• Expand volume with momentum
Without that confirmation, it’s just another liquidity sweep.
If Structure Holds
Compression → Break → Expansion.
That’s the cycle.
If the breakout confirms, parabolic acceleration becomes structurally possible — not guaranteed, but possible.
Until then, it’s still a channel.
Watch the boundary.
That’s where compression turns into momentum.
$BTC #Bitcoin #Crypto
32
10
98
99.2k
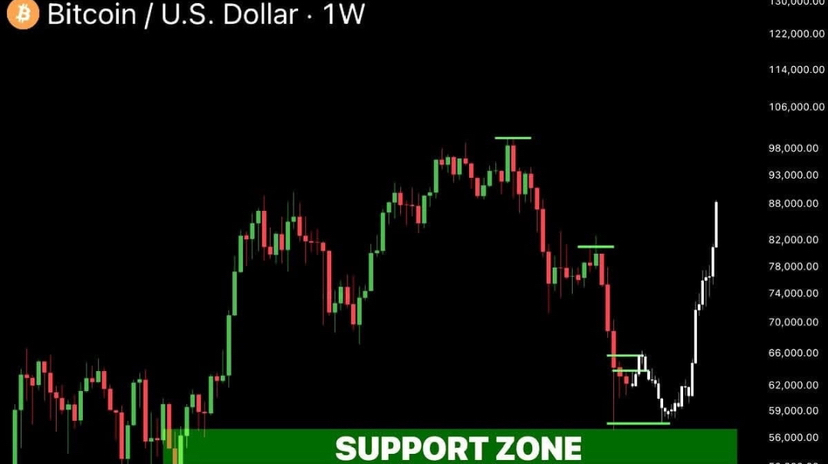
Article
FINAL LEG? $BTC Compression Before Another Sweep$BTC is currently rotating inside the $67K–$69K pocket — a tight intraday range that looks stable on the surface, but structurally fragile underneath.
Momentum isn’t expanding.
Buyers aren’t accelerating.
And every push higher lacks follow-through.
When price stalls mid-range like this, it often signals imbalance below.
Why ~$58K Matters
If the current structure continues — lower highs, muted volume, slow drift — a gradual move toward the $58K liquidity zone becomes increasingly probable.
That region holds:
• Prior demand interaction
• Stop clusters from late longs
• Untested liquidity pockets
• Structural imbalance from the previous bounce
Markets tend to revisit unfinished zones before rebuilding trend.
Base Formation Or Breakdown?
A move into ~$58K doesn’t automatically mean collapse.
It could represent:
• Final liquidity sweep
• Sentiment exhaustion
• Repricing before stabilization
What matters most isn’t the touch.
It’s the reaction.
• Strong absorption + compression → potential base building
• Weak bounce + heavy supply → continuation risk
Current Context
Inside $67K–$69K, we’re in equilibrium.
But equilibrium without expansion usually resolves with expansion.
The question is direction.
Structure will confirm it.
Watch how price behaves near $58K if it gets there.
That’s where the real decision may unfold.
$BTC #Bitcoin #Crypto
{future}(BTCUSDT)
FINAL LEG? $BTC Compression Before Another Sweep
$BTC is currently rotating inside the $67K–$69K pocket — a tight intraday range that looks stable on the surface, but structurally fragile underneath.
Momentum isn’t expanding.
Buyers aren’t accelerating.
And every push higher lacks follow-through.
When price stalls mid-range like this, it often signals imbalance below.
Why ~$58K Matters
If the current structure continues — lower highs, muted volume, slow drift — a gradual move toward the $58K liquidity zone becomes increasingly probable.
That region holds:
• Prior demand interaction
• Stop clusters from late longs
• Untested liquidity pockets
• Structural imbalance from the previous bounce
Markets tend to revisit unfinished zones before rebuilding trend.
Base Formation Or Breakdown?
A move into ~$58K doesn’t automatically mean collapse.
It could represent:
• Final liquidity sweep
• Sentiment exhaustion
• Repricing before stabilization
What matters most isn’t the touch.
It’s the reaction.
• Strong absorption + compression → potential base building
• Weak bounce + heavy supply → continuation risk
Current Context
Inside $67K–$69K, we’re in equilibrium.
But equilibrium without expansion usually resolves with expansion.
The question is direction.
Structure will confirm it.
Watch how price behaves near $58K if it gets there.
That’s where the real decision may unfold.
$BTC #Bitcoin #Crypto
Momentum isn’t expanding.
Buyers aren’t accelerating.
And every push higher lacks follow-through.
When price stalls mid-range like this, it often signals imbalance below.
Why ~$58K Matters
If the current structure continues — lower highs, muted volume, slow drift — a gradual move toward the $58K liquidity zone becomes increasingly probable.
That region holds:
• Prior demand interaction
• Stop clusters from late longs
• Untested liquidity pockets
• Structural imbalance from the previous bounce
Markets tend to revisit unfinished zones before rebuilding trend.
Base Formation Or Breakdown?
A move into ~$58K doesn’t automatically mean collapse.
It could represent:
• Final liquidity sweep
• Sentiment exhaustion
• Repricing before stabilization
What matters most isn’t the touch.
It’s the reaction.
• Strong absorption + compression → potential base building
• Weak bounce + heavy supply → continuation risk
Current Context
Inside $67K–$69K, we’re in equilibrium.
But equilibrium without expansion usually resolves with expansion.
The question is direction.
Structure will confirm it.
Watch how price behaves near $58K if it gets there.
That’s where the real decision may unfold.
$BTC #Bitcoin #Crypto
22
17.9k
Log in to explore more content
Join global crypto users on Binance Square
⚡️ Get latest and useful information about crypto.
💬 Trusted by the world’s largest crypto exchange.
👍 Discover real insights from verified creators.
Email / Phone number
Trending Topics
XRPRises40%InTwoWeeksAsOpenInterestFalls
8,347 views
277 Discussing
#xrprises40%intwoweeksasopeninterestfalls
🚨 XRP JUST RIPPED 40% IN TWO WEEKS — AND THE INTERESTING PART? 👀🔥
XRP is showing serious strength while Open Interest is falling.
That means this rally isn’t simply fueled by traders piling into leveraged positions — shorts may be getting squeezed and excessive leverage is being flushed out. 📉➡️📈
🔥 Price UP
🧹 Leverage DOWN
🚀 Momentum STILL ALIVE
If XRP keeps climbing while leverage stays controlled, the next move could catch late sellers completely off guard.
The market is resetting… while XRP keeps moving. 👀
Are you watching XRP before the next leg? 🚀
#xrp #rippl #crypto
Faizan Crypto Learner
·1 Likes
·1.2k views
HangSengFalls1%
2,635 views
132 Discussing
USStocksCloseLowerAmazonSuedByFTC
10,470 views
356 Discussing