$XRP Crypto markets often reveal their intentions long before price reacts decisively. In these moments, tension builds quietly, visible only to traders watching structure and momentum closely.
XRP now appears to be in such a phase where surface-level weakness contrasts with subtle but meaningful internal shifts. While price action still reflects caution, the underlying signals suggest the market may be approaching an important turning point.
As volatility compresses, XRP traders are focusing less on headlines and more on how the price behaves around key technical levels. The current setup shows a market that is not capitulating, but rather stabilizing under pressure.
✨Price Action Remains Compressed Within a Descending Structure
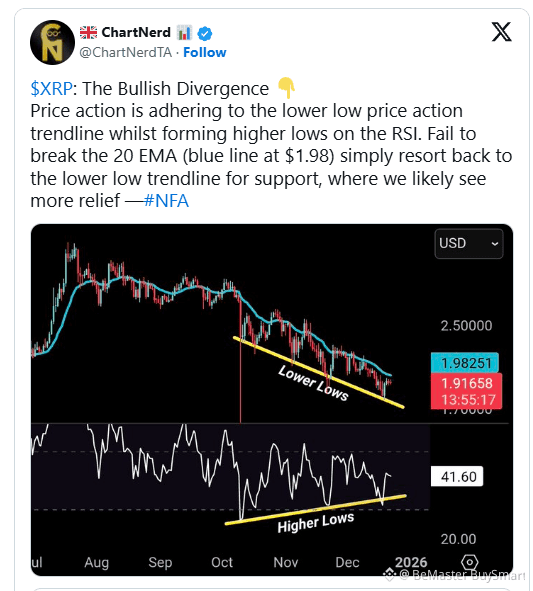
XRP continues to respect a clearly defined downtrend, marked by a sequence of lower lows. This structure confirms that sellers remain active and that bullish control has not yet been reclaimed. Price is also trading below the 20-period exponential moving average near the $1.98 region, which has repeatedly acted as dynamic resistance.
Each attempt to reclaim this moving average has failed, reinforcing its importance. However, repeated rejection without acceleration often signals weakening downside momentum rather than strength.
✨Momentum Divergence Signals Seller Exhaustion
According to ChartNerd, a respected technical analyst on X, XRP’s momentum profile is diverging from its price structure. While price continues to make lower lows, the Relative Strength Index is forming higher lows. This bullish divergence suggests that selling pressure is gradually fading.
In technical analysis, this pattern frequently appears during late-stage corrections. Sellers continue pushing prices lower, but with diminishing force. Over time, this imbalance increases the probability of stabilization or a relief move.
✨The Role of the 20 EMA and Trendline Support
ChartNerd highlights the 20 EMA near $1.98 as a critical decision point. Failure to break above this level does not automatically invalidate the bullish divergence. Instead, price may rotate back toward the lower trendline, where support has consistently emerged.
This trendline has acted as a pressure valve, absorbing selling pressure and triggering short-term rebounds. As long as the price continues respecting this structure and RSI maintains higher lows, sharp downside continuation becomes less likely.
✨What This Setup Means for XRP’s Near-Term Outlook
This technical configuration does not confirm an immediate breakout, but it does indicate growing structural tension. Bullish divergence often precedes either a trend reversal or a meaningful relief rally, particularly when aligned with well-defined support zones.
XRP now sits at a crossroads. A sustained move above the 20 EMA would significantly improve market structure. Conversely, another controlled pullback toward trendline support may offer one more test of buyer strength.
As ChartNerd’s analysis suggests, momentum is shifting beneath the surface. How price resolves this tension will define XRP’s next directional move.
🚀🚀🚀 FOLLOW BE_MASTER BUY_SMART 💰💰💰
Appreciate the work. 😍 Thank You. 👍 FOLLOW BeMaster BuySmart 🚀 TO FIND OUT MORE $$$$$ 🤩 BE MASTER BUY SMART 💰🤩
🚀🚀🚀 PLEASE CLICK FOLLOW BE MASTER BUY SMART - Thank You.

