

The information, views, and judgments regarding the market, projects, and currencies mentioned in this report are for reference only and do not constitute any investment advice.
Written by 0xWeilan
Currently, as the prospects of interest rate cuts face new twists, risk appetite has not fully improved, and cyclical sell-offs (cyclicality) have become the main force driving BTC's trend. Without further economic and employment data support, a shift in risk appetite may lead to capital inflows, and long positions still being liquidated, if BTC effectively breaks below the bull-bear line, the likelihood of a 'long squeeze' will significantly increase, raising the probability of the end of the BTC cycle.
Ultimately, BTC experienced the 'multiple killings' stampede that we warned about in the October report, with a single-month decline of 17.51%, marking the second-largest monthly decline in this cycle. By the end of the month, the maximum retracement from the peak reached 36.45%, the largest of this cycle.
Technically, BTC once fell below the 'Trump floor' constructed in the $90,000 to $110,000 range and has operated below the 360-day moving average for three consecutive weeks. In terms of space and time, it has completed a daily-level 'bull to bear' confirmation and is currently completing a weekly confirmation, while the monthly-level confirmation still awaits observation.
The short-term liquidity tightness caused by the US government shutdown, combined with the chaotic economic and employment data leading to the 'roller coaster' fluctuation of the Federal Reserve's interest rate cut expectations (medium-term liquidity tightness expectations), triggered a massive sell-off/hedging of global funds against high-β assets and internal cyclical movements in the cryptocurrency market, which were fundamental reasons for the extreme conditions in BTC and the entire cryptocurrency market. The unpredictability of macro liquidity makes it increasingly difficult to assess the 'transition between old and new cycles' in the cryptocurrency market.
In this report, we will conduct a structured analysis of the November market based on the EMC Labs 'BTC Cycle Multi-Factor Judgment Model' to seek the logic and path of the decline and to assess the medium-term adjustment versus the transition into a bear market.
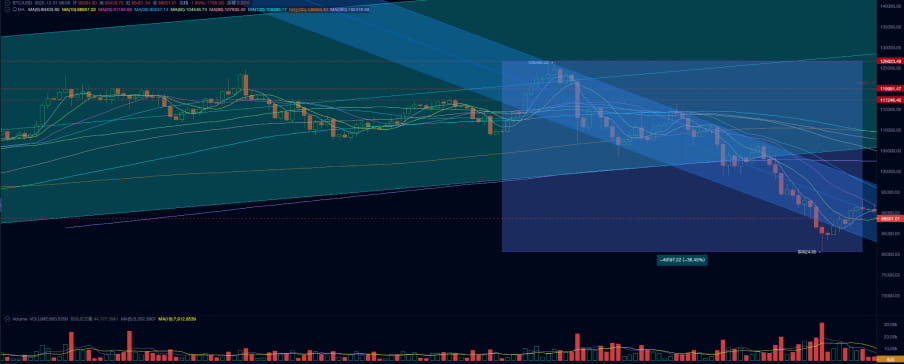
BTC Price Daily
Liquidity Crisis: Exhaustion and Uncertainty
As of November 12, the US government shutdown reached 43 days, setting a historical record. During the shutdown, fiscal spending was significantly compressed, but revenues from taxes and tariffs continued to flow in, creating a cash flow accumulation of 'only inflow and no outflow', directly pushing up the Treasury's TGA account balance at the Federal Reserve, resulting in a fierce 'water absorption' effect on the market.
The TGA balance increased by over $200 billion in a single month, with the total balance approaching $1 trillion, extracting bank reserves from the private sector and causing a 'liquidity vacuum'. Bank reserves dropped from approximately $3.3 trillion to about $2.8 trillion, nearing the market's perceived lower limit of 'ample reserves'. Eventually, the ON RRP Rate (Overnight Reverse Repurchase Rate) and SOFR (Secured Overnight Financing Rate) continued to exceed IORB (Federal Reserve's Interest on Reserve Balances), making it difficult for trading institutions to obtain sufficient funds from banks, even forcing them to repay.
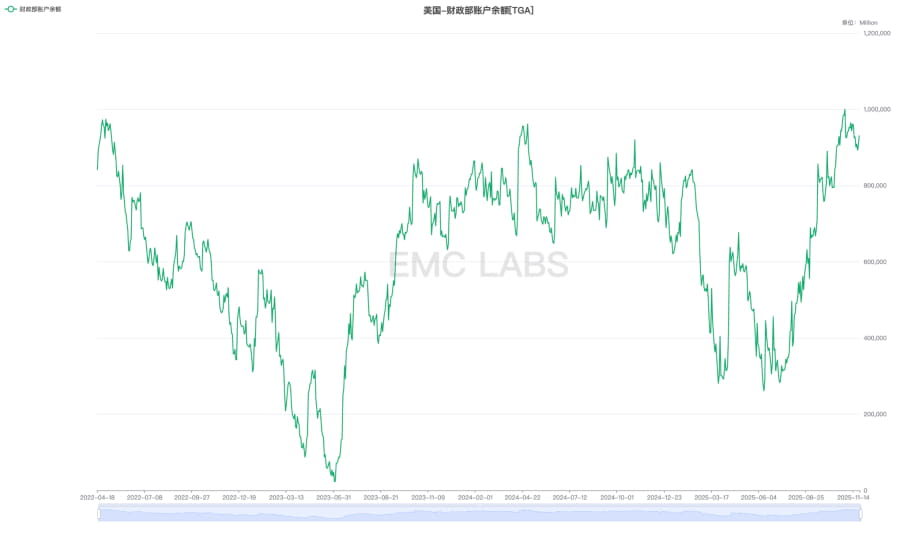
US Treasury TAG account balance
The Federal Reserve announced its second interest rate cut of the year during the FOMC meeting on October 29. Many people judged that medium-term liquidity was being released, but overlooked the micro-structural impediments—the liquidity that the Federal Reserve is actually releasing to the market has been continuously declining since late July.

Federal Reserve market liquidity net injection volume
Liquidity tightness has pushed up the funding costs in the trading market, exerting valuation pressure on US AI concept stocks and high-β assets like BTC.
EMC Labs notes that as actual liquidity gradually exhausts, market risk appetite deteriorates, leading to valuation pressure that ultimately results in high-β assets being sequentially sold off, with BTC being the first link in this sell-off chain.
In early October, BTC ETF inflows were abundant, driving BTC to reach an all-time high. Subsequently, with the Federal Reserve's market liquidity injections declining to a low point, outflows began, leading to a dominant trend of significant outflows thereafter.
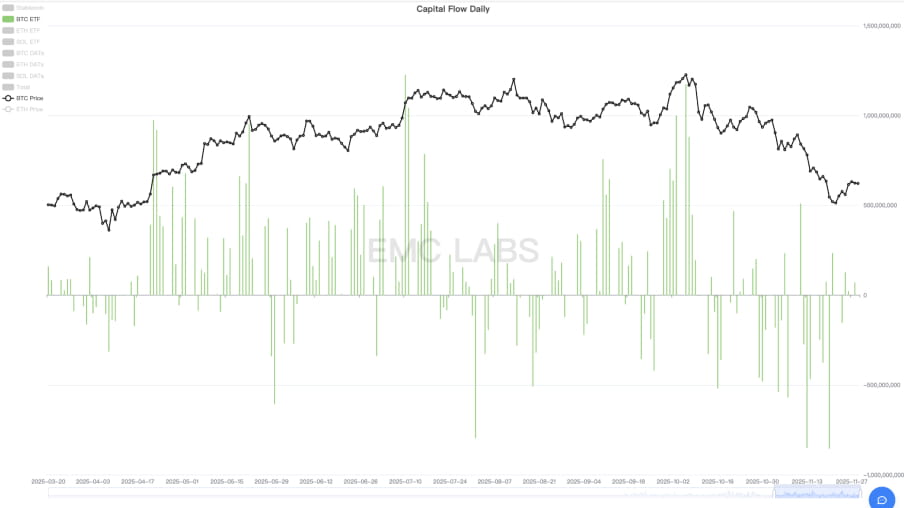
US 11 ETFs inflow and outflow statistics (Daily)
Similarly, as a high-β asset, the Nasdaq AI concept stocks outperformed the cryptocurrency assets lacking fundamental support. After BTC began to decline and initiate rebalancing, it still continuously set new historical highs under the impetus of the seven major companies' unexpectedly strong earnings reports, only starting to break down on November 4.
After the US stock market broke down, the outflow of funds from the cryptocurrency market accelerated further. On one hand, there was the continued withdrawal of funds from BTC ETF channels, and on the other hand, the further sell-off by long position groups within the market led to BTC, which fell ahead of the Nasdaq, further breaking down and reaching the low point of this round of adjustments on November 21.
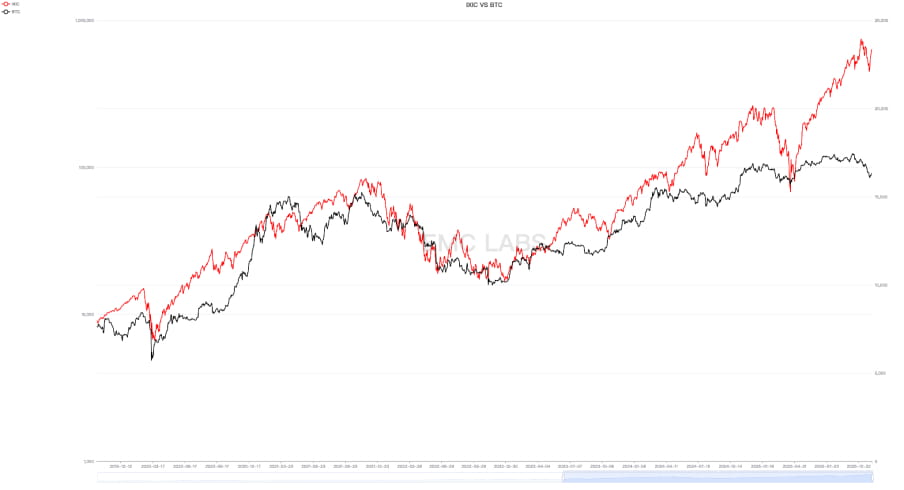
Nasdaq VS BTC Price Trend
During this period, BTC adjusted nearly a month earlier than the Nasdaq, with a magnitude nearly four times that of the Nasdaq (BTC: -36.45%, Nasdaq: -8.87%), exhibiting elasticity greater than 2-3 times before.
Apart from short-term liquidity pressures, we continue to focus on an important indicator of medium-term liquidity expectations—the Federal Reserve's December interest rate cut probability. In October, the December cut expectation once reached as high as 98.78% (October 20), and later, under the continuous 'hawkish' stance of Federal Reserve officials, it dropped to a low of 30.07% (November 19). The changes in funding risk appetite triggered by the weakening medium-term liquidity expectations have undoubtedly intensified traders' sell-off of high-β duration assets.
On November 12, the US government ended its shutdown, and short-term liquidity began to slowly release. However, the Federal Reserve's ongoing 'hawkish' stance has caused the probability of a December interest rate cut to continue decreasing. We judge that initially, it was a genuine short-term liquidity exhaustion, followed by a pessimistic expectation for medium-term liquidity, which jointly dominated the recent decline and price rebalancing in the US stock and cryptocurrency markets.
The true turning point for BTC and US stocks occurred on November 21. That day was a Friday when the Federal Reserve's 'number three person', New York Fed President John Williams, stated in a public forum that the risks to employment had increased and there was room for further adjustments to the federal funds rate to bring the policy stance closer to the neutral range. This statement was regarded as the opinion of the Federal Reserve 'management', and on that day, the probability of a December interest rate cut rapidly traded above 70%, with US stocks and BTC both turning from decline to increase.
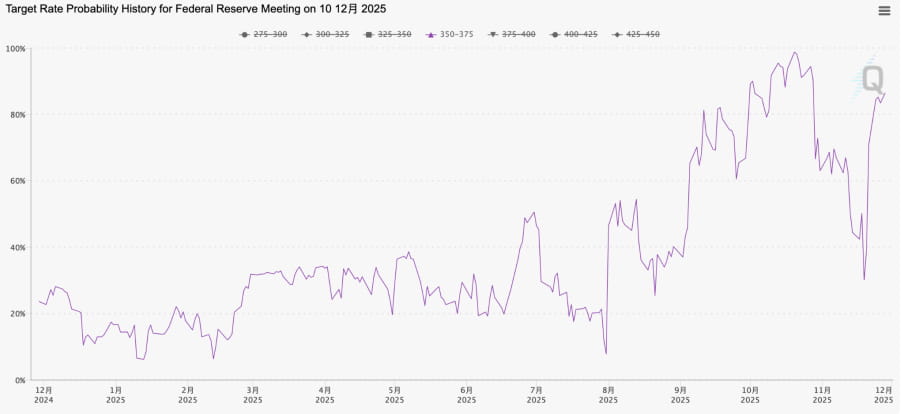
FedWatch Federal Reserve December 25 basis points cut probability
Subsequently, on November 26, the Federal Reserve's Beige Book was released, indicating that economic and employment conditions were indeed deteriorating. This information further alleviated market concerns about the lack of sufficient economic and employment data before the December interest rate cut meeting, which might lead the Federal Reserve to adopt a conservative stance and refrain from cutting rates. FedWatch's December interest rate cut probability gradually rose above 80%, reversing from Powell's statement on October 30 that it was 'by no means a certainty' to being 'a certainty' a month later.
The adjustment in the US stock market in November also included concerns over the overvaluation of AI concept stocks, leading to a 20% adjustment in leading stock Nvidia, with weak rebounds. However, overall, it was more so a dual adjustment of risk appetite and valuation caused by short-term liquidity pressures and medium-term liquidity unpredictability. Therefore, with the appearance of a short-term liquidity turning point and the probability of a December interest rate cut returning to high levels, the Nasdaq recorded gains on all four trading days in the last week of November, attempting to recover the historical high set on October 29.
Although US stocks rebounded strongly, it seems that the short-term market risks have been alleviated. However, liquidity risks have not been fully resolved, and short-term liquidity has not noticeably improved. In terms of medium-term liquidity, although a December interest rate cut is approaching 'a certainty', whether the market can continue to cut rates in the first quarter of next year still depends on the upcoming economic and employment data.
Internal Structure: Repricing and Major Turnover
As the liquidity crisis turning point appears, the Nasdaq may soon recover its previous historical highs, but the corresponding rebound in BTC shows a significant difference, still having over 38% space from the historical high of October 6. We believe that the weak price performance is partly due to BTC's inherent elasticity being greater than that of the Nasdaq, and partly due to the severe internal structural damage compounded by 'cyclical law' sell-offs.
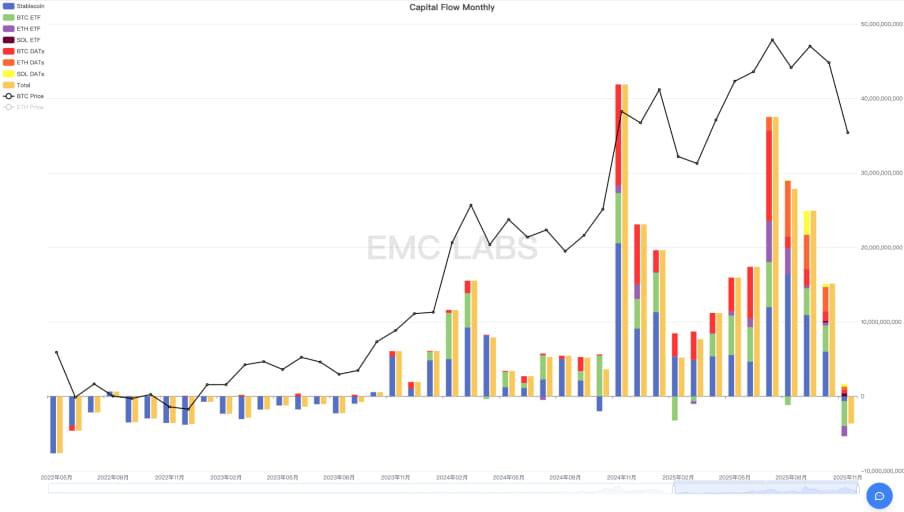
First, through the eMerge Engine's statistics on the inflow and outflow of funds in the cryptocurrency market, we can see that in November, the cryptocurrency market recorded over $3.6 billion in outflows, with BTC ETF channels accounting for $3.382 billion, ETH ETF channels for $1.352 billion, stablecoins for $615 million, and SOL ETF recording $412 million in net inflows. Overall, BTC/ETH/SOL Treasury companies recorded positive inflows totaling approximately $1.298 billion.
 Comprehensive inflow and outflow statistics of the cryptocurrency market (Monthly)
In November, the cryptocurrency market recorded the largest single-month outflow in this cycle, which occurred after three consecutive months of inflow reduction. This was the fundamental reason for BTC's largest decline in this cycle. Among them, outflows from the BTC ETF channel accounted for 93.94% of the overall outflows, so we attribute this round of adjustment mainly to the liquidity crisis's downward repricing of high-β assets like BTC.
Secondly, the periodic reduction by the long position group driven by cyclical laws is also an important reason. Since this cycle, the long BTC position group has conducted three rounds of large-scale sell-offs, the first round from January to March 2024, the second round from October 2024 to January 2025, and the third round being the recent deep adjustment of BTC prices from July to November 2027.
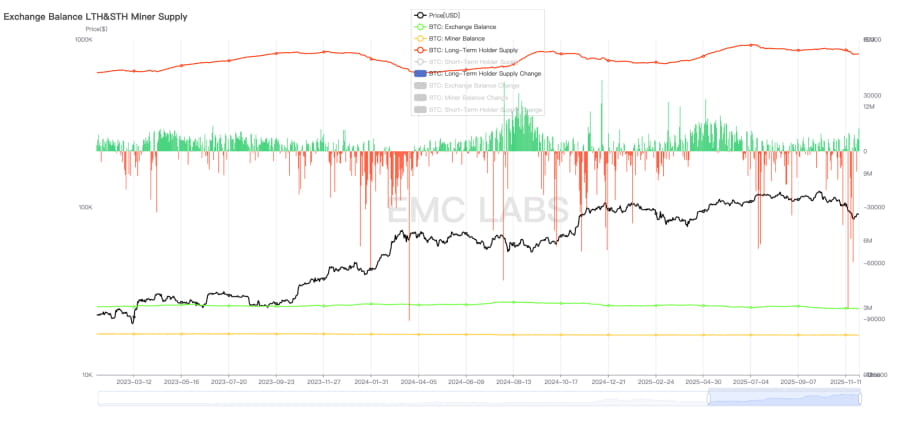
BTC Long Position Holdings and Changes Statistics (Daily)
Unlike previous instances where reductions occurred during BTC price increases, this round of reductions mainly took place between July and November when prices stabilized or even during rapid price declines. The behavior of the long position group is not unusual and remains consistent with their actions following the 'bull to bear' transition. Considering the significant influence of the 'ideological steel stamp' of the halving bull market formed over more than a decade, and the 'coincidence' of reaching past cycle bull market peaks around October, we believe there is indeed a sufficiently large long position group still adhering to the 'cyclical law' and engaging in sell-offs following the 'bull to bear' transition. This sell-off is a key reason for amplifying BTC's decline.
Ultimately, BTC's recent decline is not only constrained by the two factors mentioned above but also by other negative factors such as futures arbitrage traders and cryptocurrency market makers suffering severe setbacks due to the 'Binance USDe decoupling incident'.
A brutal decline has already occurred, with some individuals selling off aggressively, while others take the opportunity to increase their positions. Ultimately, large-scale BTC turnover occurred, and after the macro liquidity expectation turning point, the market finally welcomed a moment of respite.
Through the analysis of BTC on-chain data, we found that at around $84,000, over 430,000 BTC were re-priced, rewriting a significant chapter in BTC's redistribution history.
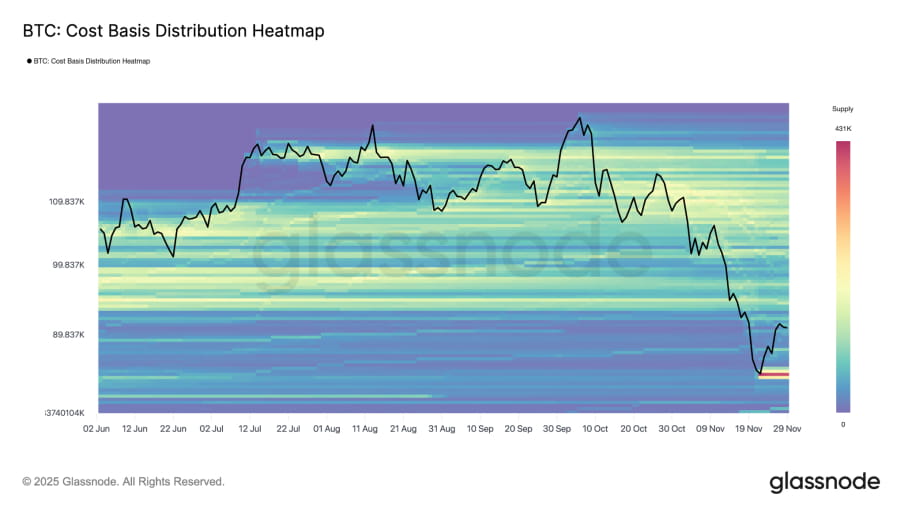
BTC On-chain Cost Distribution Heatmap
Long BTC holders continued to buy and accumulate chips during the decline, while gradually selling to new short sellers during the market rise. This fundamental movement, along with BTC halving, has constituted the past transition between BTC bull and bear cycles. Today, as consensus around BTC spreads on Wall Street, the holding structure is undergoing fundamental changes, with BTC ETF holders and treasury companies becoming new long-term investors. We have previously discussed in monthly reports whether the old cycle will change due to the new market structure and whether the new cycle will shape a new form.
Today, we still have no answers. However, if this round of long BTC holders' sell-off ultimately extinguishes market enthusiasm, reversing the market trend back into a bear market, then we can say that the new cycle has still not been successfully shaped.
Conclusion
In November, short-term macro liquidity exhaustion and shifts in medium-term macro liquidity expectations towards pessimism drove the devaluation and downward repricing of assets, including Nasdaq AI concept stocks and cryptocurrencies. Subsequently, as expectations changed, both markets began to rebound.
The internal movements and structural vulnerabilities of the cryptocurrency market have intensified the severity of this adjustment.
In this round of adjustments, both the scale of outflows and the magnitude of BTC's retracement were the largest in this cycle on a monthly basis.
Based on this logic, we judge that the short-term price turning point has appeared on November 21. Subsequently, with the anticipated December interest rate cut and the conclusion of the Federal Reserve's quantitative tightening (QT), US macro liquidity is expected to improve, and funds may flow back into the cryptocurrency market, further driving price rebounds. If this coincides with the continuation of the US stock bull market in 2026, achieving new highs, BTC will have exited the old cycle and entered a new cycle dominated by Wall Street institutions. If funds do not flow back, it can be determined that the new cycle formation has failed, the old cycle still dominates the market, and the BTC bull market since November 2022 will transition into a bear market, seeking another bottom.
EMC Labs was established in April 2023 by cryptocurrency asset investors and data scientists. It focuses on blockchain industry research and investment in the secondary crypto market, with industry foresight, insights, and data mining as core competencies, aiming to participate in the thriving blockchain industry through research and investment, promoting blockchain and cryptocurrency assets for the benefit of humanity.
For more information, please visit: https://www.emc.fund


