The 30% drop in Bitcoin market depth signals challenges in absorbing large transactions amidst thinning liquidity.
Bitcoin’s inability to reclaim $90,000 👉Bitcoin is trading in a structurally constrained range as heavy overhead supply between $93K and $120K and late-December options expiries cap upside momentum, according to Glassnode. The sharp Dec. 17 whipsaw—where BTC surged above $90K before rapidly reversing—was driven by thin liquidity and options positioning, not excessive leverage, with futures open interest declining and funding rates staying near neutral. Dense loss-bearing supply from recent buyers continues to sell into rallies, keeping price below key levels like the $95K–$101.5K cost-basis zone, while patient demand has so far defended support near the True Market Mean around $81K. Spot demand and corporate buying remain selective and episodic, reinforcing range-bound conditions. Until overhead sellers are absorbed or options-related gamma effects fade after late-December expiries, Bitcoin is likely to remain pinned between roughly $81K and $93K.👈 is looking less like a debate about narratives and more like a test of market plumbing.
For the better part of 2025, the surface story was institutional momentum. The US moved toward a workable regulatory perimeter, capped by President Donald Trump signing the GENIUS Act to federalize payment stablecoins.
At the same time, spot Bitcoin ETFs normalized exposure within brokerage channels, and the broader crypto economy traded as if it had finally graduated into the asset-class mainstream.
This resulted in a rally that drove Bitcoin to a new all-time high 👉Bitcoin set a new cycle high on Oct. 3, breaking above its Aug. 14 peak of $123,731 as a steady October advance accelerated with supportive macro and flow conditions. Improving risk appetite saw BTC reclaim $120,000 on Oct. 2, aided by a U.S. government shutdown that disrupted key economic data and increased expectations for further Fed easing later in the month. This backdrop has favored risk assets and hard-asset hedges, while spot Bitcoin ETF demand surged with $1.3 billion in net inflows between Oct. 1–2, helping absorb supply and reinforce dip-buying. Additional support came from the Fed’s September rate cut and expectations of another cut, alongside options dynamics where a major quarterly expiry reset positioning and heavy call interest between $115,000 and $125,000 helped open room for further upside into Q4.👈 of $126,223 in early October.
However, by Oct. 10, the microstructure deteriorated as a violent unwind erased roughly $20 billion in leveraged positions across crypto venues. This forced BTC's price down by 30% from its 2025 highs, and the asset registered its first red October in several years.
Since then, the Bitcoin market has ground lower 👉Fidelity’s Jurrien Timmer argues Bitcoin may have завершed another four-year halving cycle in both price and time, with October’s peak near $125K–$126K aligning with historical topping windows and signaling the end of the “green zone” bull phase. While remaining a long-term bull, Timmer expects a cyclical “winter” that could last about a year and test support in the $65,000–$75,000 range, a zone that also fits broader historical drawdown models implying a 35%–55% decline over 12–18 months. Since the peak, BTC has struggled to regain resistance amid macro headwinds, futures deleveraging, tighter dollar liquidity, weaker ETF flows, and rising demand for downside protection, all consistent with prior late-cycle cooling phases. Analysts remain divided, with some viewing recent weakness as a liquidity-driven reset rather than a confirmed bear market, but sustained ETF inflows and a decisive reclaim of the cycle highs are seen as critical to invalidating the post-peak thesis heading into 2026.👈 thanks to thinned liquidity, lower trading volumes, and larger holders selling into rebounds.
These dynamics go a long way toward explaining why Bitcoin is currently struggling below $90,000, rather than treating that level as a staging point for new highs.
These dynamics go a long way toward explaining why Bitcoin is currently struggling below $90,000, rather than treating that level as a staging point for new highs.
👉The Oct. 10 hangover:
The liquidation event mattered because it fundamentally altered the risk appetite of the marginal liquidity provider.
In a deep market, volatility is painful but tradable. Market makers quote size near the mid-price, arbitrage desks keep venues aligned, and large flows clear without forcing price gaps.
After Oct. 10, the incentives flipped. Dealers tightened risk limits, and the market began to trade with significantly reduced shock absorption.
That brittleness is evident in the behavior of larger holders. CryptoSlate previously reported how BTC whales have continued offloading the top crypto👉Long-term Bitcoin holders are realizing profits at levels not seen since the 2016–2017 bull market, according to Glassnode, with roughly 2.37 million BTC in realized gains during the 2024–2025 cycle—worth about $260.7 billion at current prices. This surge in profit-taking signals rising sell-side pressure as investors capitalize on Bitcoin’s extended rally and gradually reduce exposure. Bitcoin peaked at $124,167 on Aug. 14 and has since pulled back to around $110,761, down nearly 11%, reflecting a familiar cycle pattern in which strong upward moves are followed by calmer phases driven by widespread profit-taking.👈, thereby dampening market momentum even after the leverage purge.
Moreover, the market shift is also evident in data on Bitcoin's volumes and depth.
According to the firm, the combined spot and derivatives volumes across centralized exchanges dropped 24.7% month over month to $7.74 trillion, the sharpest monthly decline since April 2024.
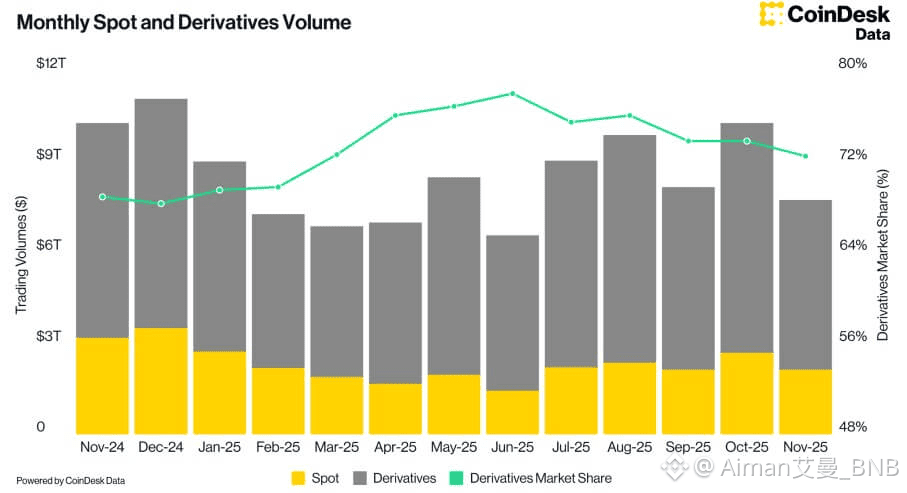
Spot volumes slid 21.1% to $2.13 trillion, while derivatives volumes fell 26.0% to $5.61 trillion. Notably, the derivatives market share slipped to 72.5%, the lowest since February 2025.
A market can print high prices on low turnover, but the dynamic changes immediately when participants need to move size.
👉Depth is down:
The clearest warning signal for Bitcoin is its current market depth, which measures the visible buy and sell interest near the mid-price.
This is where the “trillion-dollar illusion” becomes tangible. Market capitalization is merely a mark-to-market calculation; liquidity is the ability to convert intent into execution without paying a hidden tax in slippage.
When order books are thick and spreads are predictable, institutional strategies, rebalancing on schedule, hedging without slippage shocks, are feasible. Liquidity compounds: dense flow invites tighter quoting from market makers, lowering costs and pulling in more participation.
The reverse, however, is self-fulfilling. Thin liquidity drives up trading costs, forces participants to step back, and ensures the next shock leaves a deeper scar.
Bitcoin’s aggregated 2% market depth has fallen roughly 30% from its 2025 high. In practical terms, this is the difference between a market that can absorb a fund rebalancing without drama and one that gaps through levels when that same flow hits.
A snapshot from Binance, the largest crypto exchange by trading volume, illustrates the point.
Both 0.1% and 1% market depth on BTC pairs have risen significantly over the past few years, eclipsing pre-2022 crash highs.

As of Bitcoin’s last record high in October 2025, 1% market depth on Binance exceeded $600 million.
Since then, that depth has dropped to under $400 million as of press time.
Binance is not a blanket proxy for global liquidity, but it serves as a useful bellwether for the health of the visible order book.
However, when the world’s leading venue shows thinner books near the mid-price, it explains why rallies stall the moment momentum traders encounter real selling.
👉ETF flows and the migration of liquidity off-exchange:
The second structural shift involves where liquidity now lives, particularly as the ETF complex has matured.
Data from SosoValue shows that investors have pulled more than $5 billion from U.S.-listed spot Bitcoin ETFs since Oct. 10.
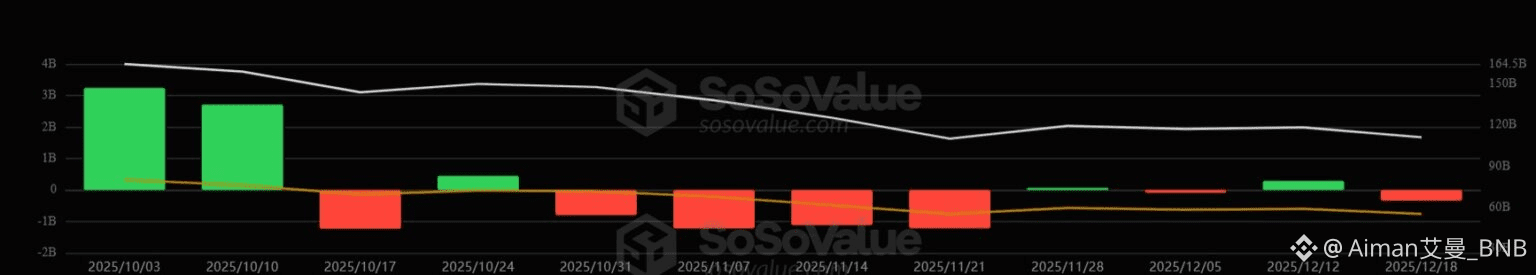
In a deeper tape, a demand shock of that magnitude is absorbed gradually. In a thinner market, it creates a “push-pull” dynamic in which price stalls at round numbers because every rally runs into a wall of redemptions, profit-taking, and whale distribution.
Meanwhile, regulatory plumbing changes have further altered how flows enter and exit the system. In July, the SEC voted to permit in-kind creations and redemptions for crypto ETP shares, a move designed to align these products with commodity ETPs.
Operationally, in-kind flexibility gives authorized participants (APs) more options for sourcing and delivering Bitcoin, including via internal inventory, OTC counterparties, and prime-broker channels.
While this reduces friction under normal conditions, it reinforces a broader trend: liquidity is increasingly being internalized away from visible exchange order books.
This migration explains the current paradox: Bitcoin remains a massive, institutionally held asset, yet it feels mechanically fragile.
Private liquidity is not obligated to display itself during a panic. When stress hits, spreads widen, sizes shrink, and activity ricochets back onto public venues precisely when public depth is at its weakest.
