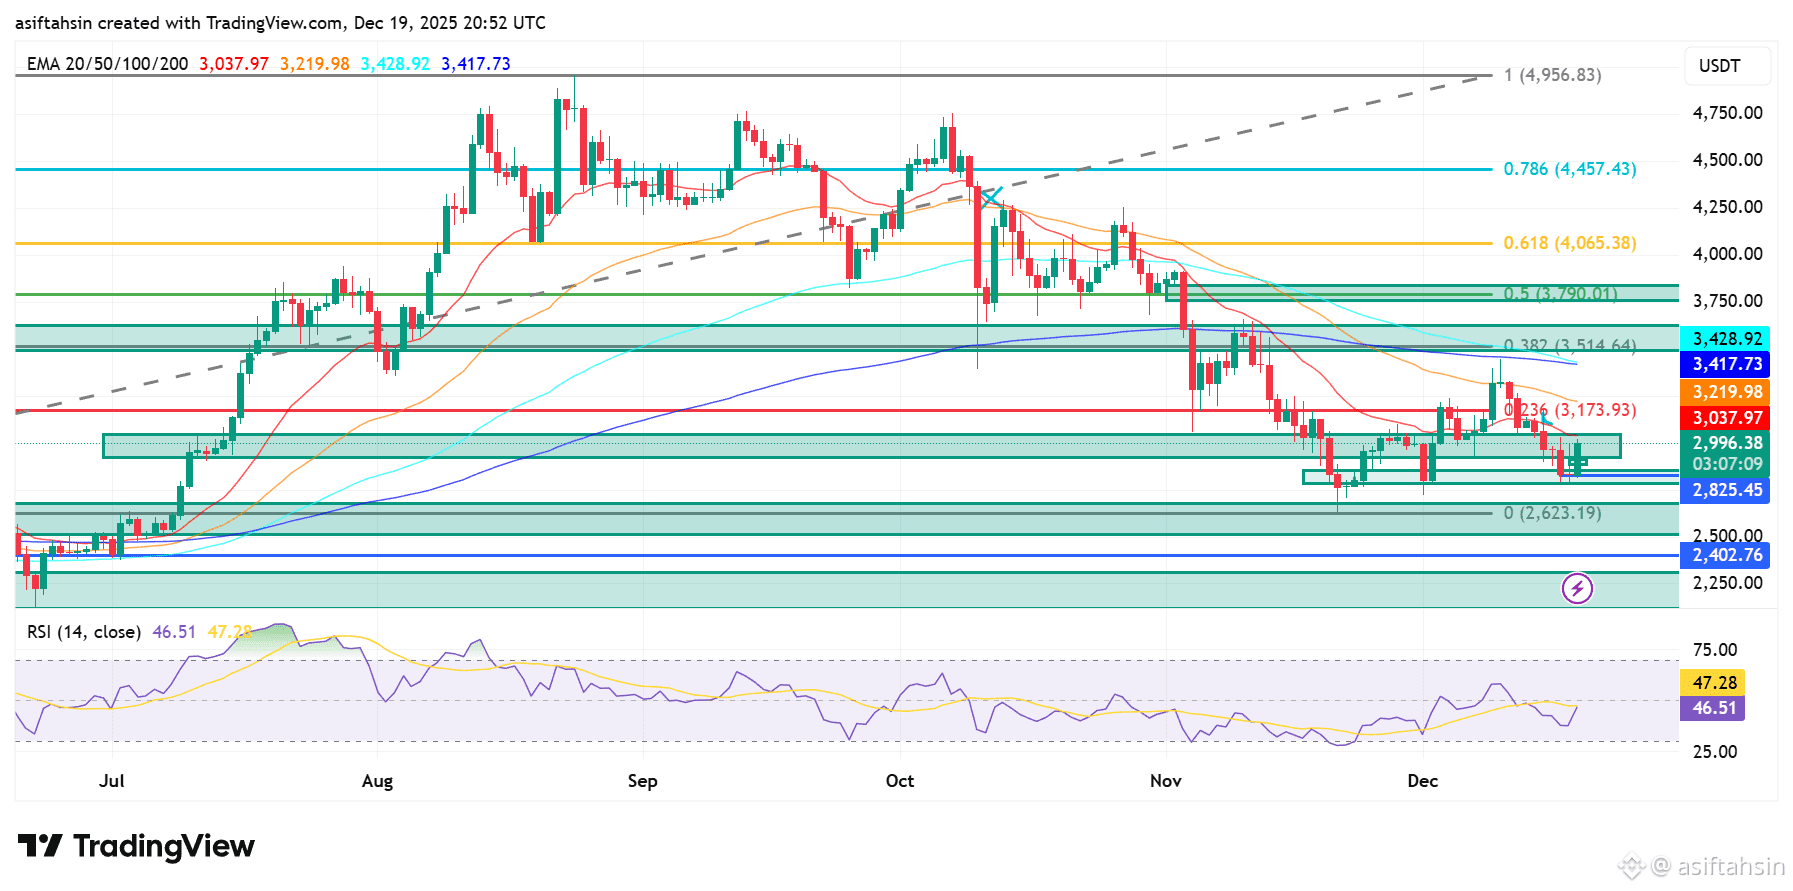
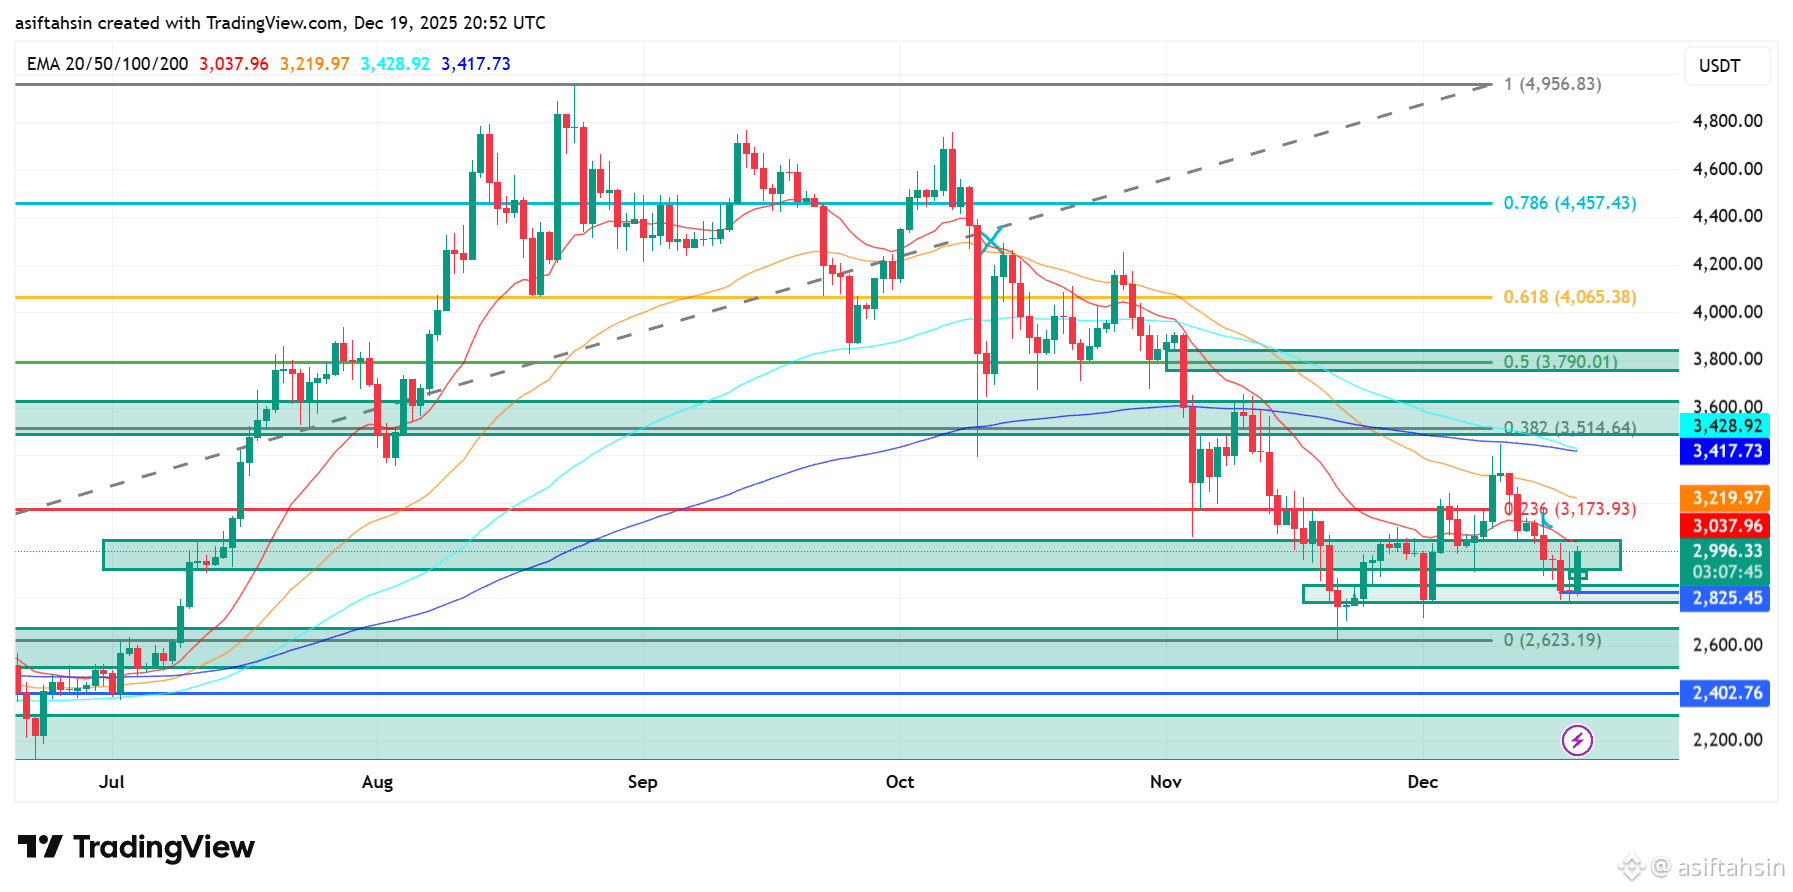
thereum remains in a broader corrective phase after a strong rejection from higher Fibonacci resistance levels. While bearish structure is still intact, price action is now showing stabilization above a key demand zone, suggesting selling pressure is gradually weakening.
The major sell-off began after ETH was rejected from the $4,065 (0.618 Fib) and $4,457 (0.786 Fib) resistance zone — a region that repeatedly capped upside momentum. This rejection triggered a decisive breakdown below all major moving averages, shifting market control firmly to sellers.
EMA Structure (Bearish Stack)
20 EMA — $3,038
50 EMA — $3,220
100 EMA — $3,429
200 EMA — $3,418
All EMAs remain stacked above the current price, forming a strong resistance cluster, confirming that ETH is still trading within a bearish technical environment.
Current Price Action & Support Analysis
ETH is currently consolidating above the $2,850–$3,000 demand zone, an area that has repeatedly attracted buyers. This zone sits just above the Fib 0 level at $2,623, reinforcing its importance as a key downside support.
So far, buyers have successfully defended this region, preventing a deeper breakdown. As long as ETH holds above $2,850, a short-term relief bounce remains possible.
Bullish Recovery Levels
For any bullish continuation or momentum shift, ETH must reclaim key Fibonacci levels:
$3,174 (0.236 Fib) — first sign of stabilization
$3,514 (0.382 Fib) — trend recovery attempt
$3,790 (0.5 Fib) — major supply zone
A true trend reversal will only be confirmed if ETH breaks and holds above $4,065 (0.618 Fib), where sellers previously regained full control.
Downside Risk Scenario
If ETH loses the current demand zone, the next key downside targets are:
$2,623 (Fib 0 support)
$2,402 (major historical support)
A breakdown below these levels could open the door to an extended corrective move.
Momentum Indicator
RSI (14): 46.51
RSI is recovering from oversold territory, indicating bearish momentum is fading, but bullish strength has not yet been confirmed.
📊 Key Levels Summary
Resistance
$3,174 (0.236 Fib)
$3,514 (0.382 Fib)
$3,790 (0.5 Fib)
$4,065 (0.618 Fib)
$4,457 (0.786 Fib)
Support
$2,850–$3,000 (major demand zone)
$2,623 (Fib 0)
$2,402 (macro support)
📌 Summary
Ethereum is currently holding a critical demand zone after a sharp bearish move. While a relief bounce is possible in the short term, the broader structure remains bearish as long as price stays below the EMA cluster and $3,500–$3,800 resistance zone. Bulls must reclaim $3,174 to shift momentum, while failure to hold support could push ETH back toward $2,623.
