Hello, $LUNC and $USDT traders! Let's take a quick look at the Terra Classic (LUNC) chart, which is showing interesting signs of life.
📊 Key Data (at the time of capture):
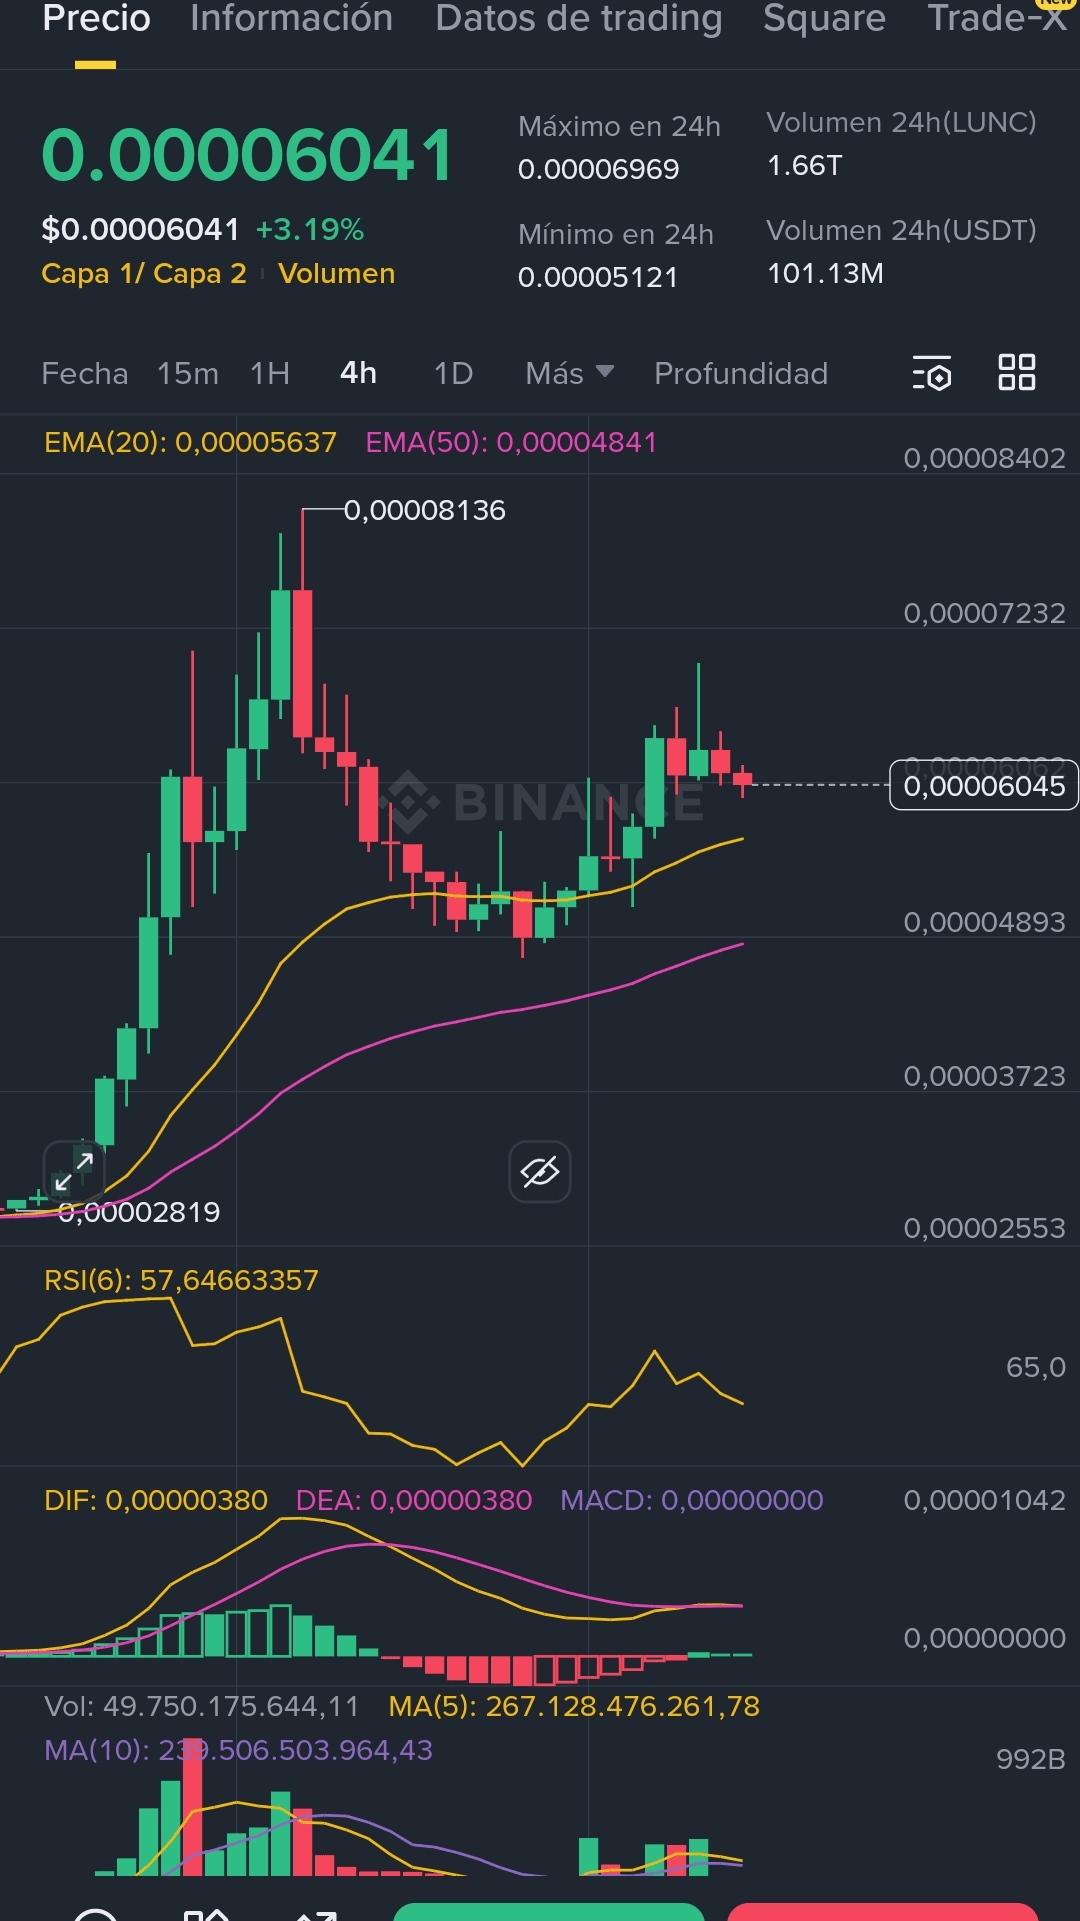
Current Price: $0.00006041
24h Change: +3.19%
24h High: $0.00006969
24h Low: $0.00005121
24h Volume (LUNC): 1.66T
🔍 Key Technical Indicators:
Exponential Moving Averages (EMA):
The current price ($0.00006041) remains above the EMA(20) ($0.00005637) and the EMA(50) ($0.00004841).
Interpretation: This is a typically bullish setup, indicating that the short-term trend remains positive. The EMA(20) is acting as a strong dynamic support.
RSI(6):
Value: 57.64
Interpretation: The RSI is in healthy territory, above 50, confirming the momentum without yet being in the extreme overbought zone (usually +70). There is room to keep rising.
MACD:
The MACD (DIF) and the signal line (DEA) are both at $0.0000380, and the histogram (MACD) is at $0.00000000.
Interpretation: While it seems there was a recent correction (green histogram low or near zero), the key is that the lines are above zero, maintaining the long-term positive trend.
💡 Conclusion and Next Levels:
$LUNC seems to be consolidating after the momentum, with all major technical indicators pointing to a continuation of the bullish trend.
Resistance to watch: The 24h high at $0.00006969. Exceeding this point could open the way towards $0.00008136.
Critical Support: Staying above the EMA(20) at $0.00005637 is vital.

