
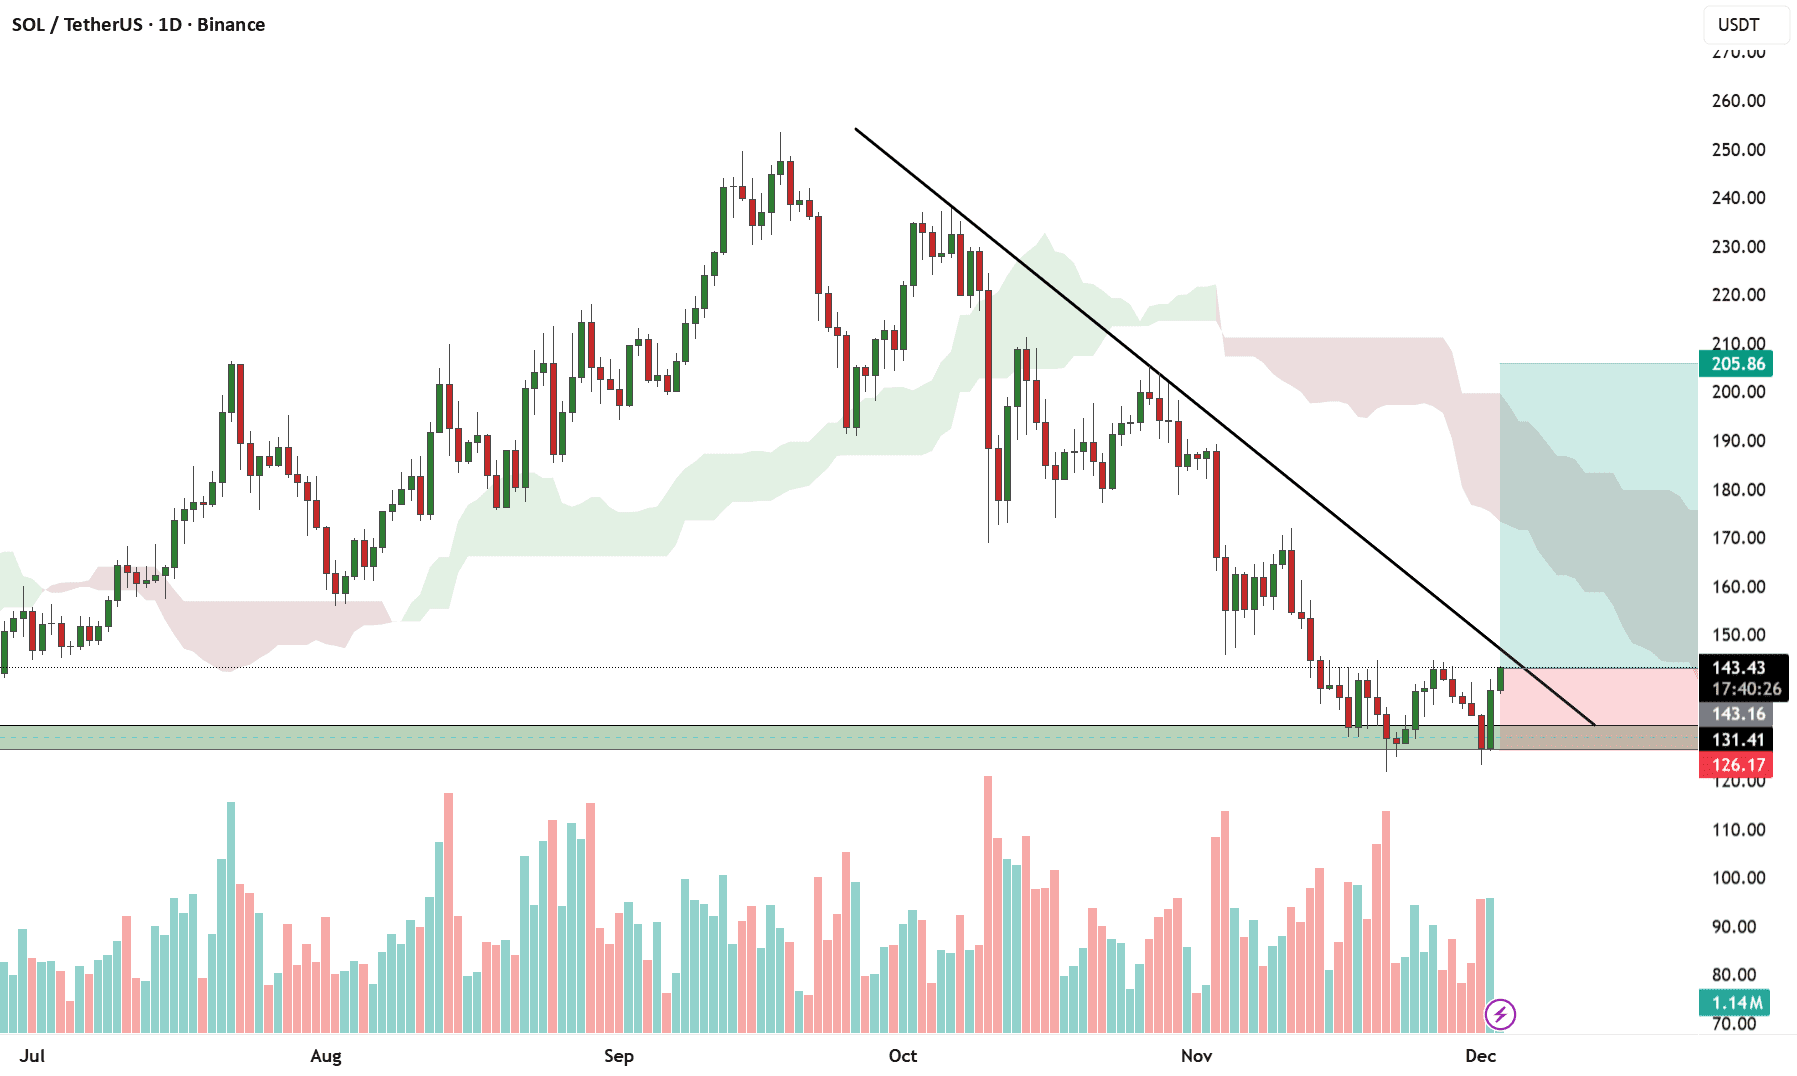
 In a one-day chart, SOLUSDT is currently recovering strongly from a well-defined horizontal support area around $131 - $137, which has acted as a major demand zone several times in the past. Buyers are entering again from this area with an increase in volume, indicating interest in accumulation after an extended downtrend. The price has now pushed back above the short-term daily lows and is testing the downward trend line drawn from November highs, suggesting that the market is attempting to change momentum.
The candles form higher lows while rejecting deeper declines, indicating short-term strength. However, the overall structure is still below the broader downtrend line and beneath the daily Ichimoku cloud, so this stage of recovery will only confirm a reversal if SOL can close daily above $150 - $155, breaking the trend line resistance and opening up towards $170 and $190. If the price fails to close above the trend line and faces rejection near $145 - $150, it may retest the support area of $135 - $131 again.
In summary, SOL is currently in a corrective upward bounce within a larger downward trend, holding key support and attempting to break the structure. A sustainable breakout and close above $150 will indicate a potential shift towards medium-term bullish momentum, while failure to do so keeps it in a consolidation range between $131 and $150.
✅ Trade here on $SOL
