In the frenzy of cryptocurrencies, SOL is quietly becoming the market focus. Are you ready to embrace the next wave of explosive growth? Opportunities always favor those who are prepared, but the real turning point may be hidden in today's data!
News Analysis
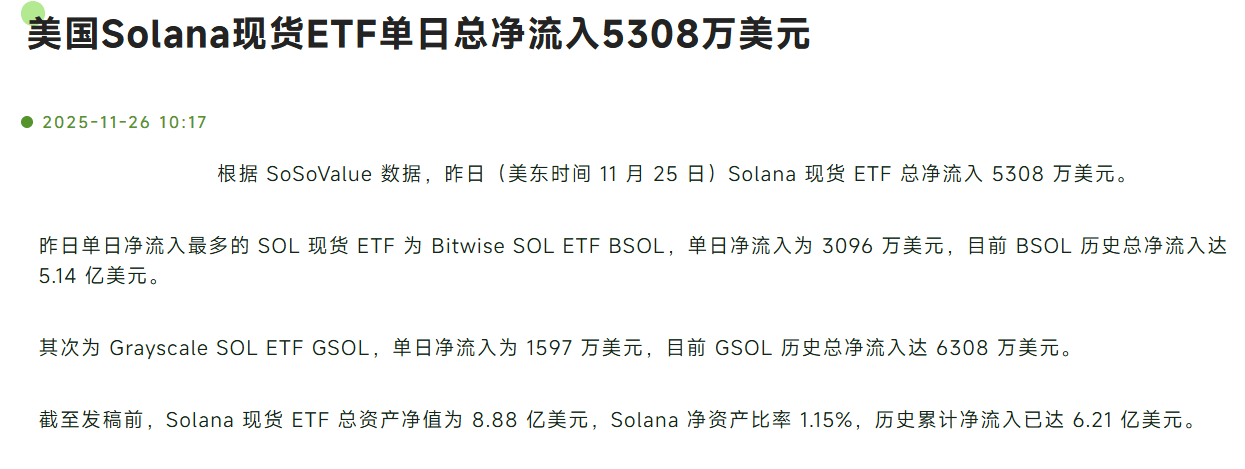
According to SoSoValue data, yesterday the total net inflow of the American Solana spot ETF reached as high as $53.08 million, with Bitwise SOL ETF and Grayscale SOL ETF contributing $50.96 million and $15.97 million respectively. The historical cumulative net inflow has exceeded $621 million.
The continuous influx of institutional funds not only highlights the market's long-term confidence in SOL but may also become a key catalyst for price explosion. The total net asset value of ETFs has reached $888 million, with a net asset ratio of 1.15%, reflecting Solana's steadily rising position among mainstream crypto assets.
However, the sustainability of capital inflow still needs to be observed. If the subsequent momentum weakens, the market may face short-term adjustment pressure.
Technical Analysis
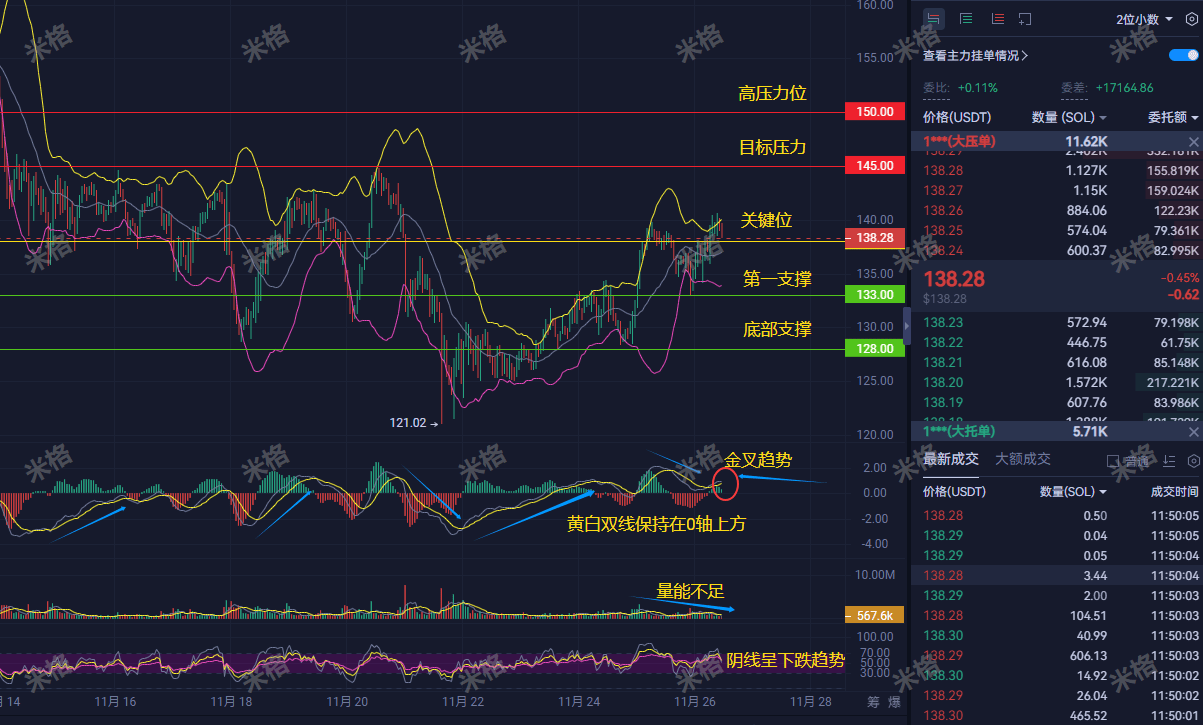
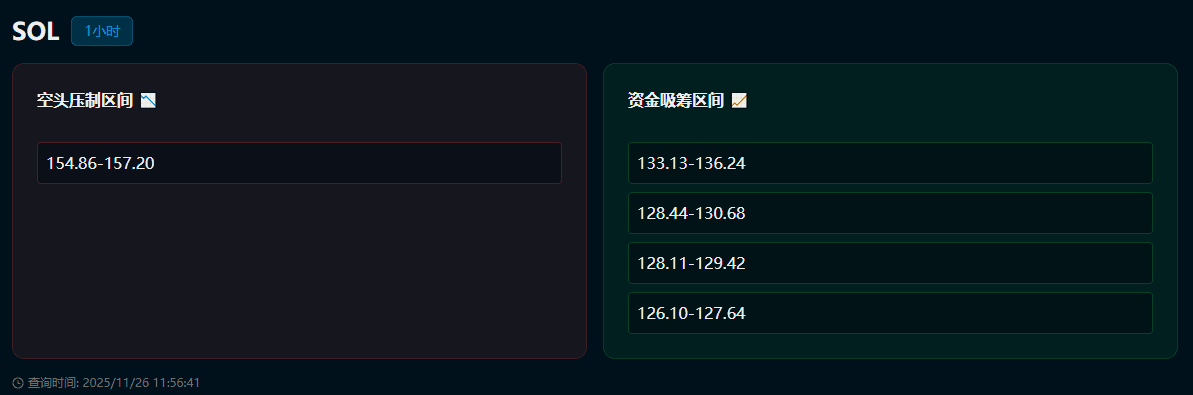
From the technical chart perspective, SOL is currently in a clear upward trend, with key support near $138, and resistance levels at $145 and $150. The MACD indicator shows that the yellow and white lines remain above the 0 axis, forming a golden cross signal, indicating strong buying momentum.
However, the trading volume seems slightly insufficient, and the recent bearish candlesticks show a downward trend, suggesting that there may be a risk of a short-term correction. If the price can hold key support and break through the resistance level, it will open up new upward space; on the contrary, if it loses important defenses, it may test the lower region.
Investors need to closely monitor the dynamic changes at these price levels to capture the best trading opportunities.
Mig's personal opinion
I believe that under the dual benefits of news and technical aspects, the bullish logic for SOL remains unchanged in the medium to long term. The continuous injection of ETF funds provides a solid foundation for prices, while the golden cross signal from the technical aspect strengthens the upward momentum.
In the short term, prices may fluctuate between $138 and $150, and once the key resistance is broken, the market targets may exceed expectations.
However, there is always uncertainty in the market, and investors need to remain flexible and avoid excessive leverage.
Market analysis is 'planning', but the market is 'real combat'. If you always feel a step behind the slow market, always 'buying and then dropping, selling and then rising', then let me tell you, you are not lacking analysis, you are lacking a professional guide who can remind you in real-time when 'opportunities arise' and 'run fast'!
Want to know how my Mig managed to evade spikes and set precise ambushes with the brothers in the village? Follow Mig and participate in every attack of the Mig villagers! Mig will announce specific entry times and real-time news every day in the village!
