
Chart Analysis
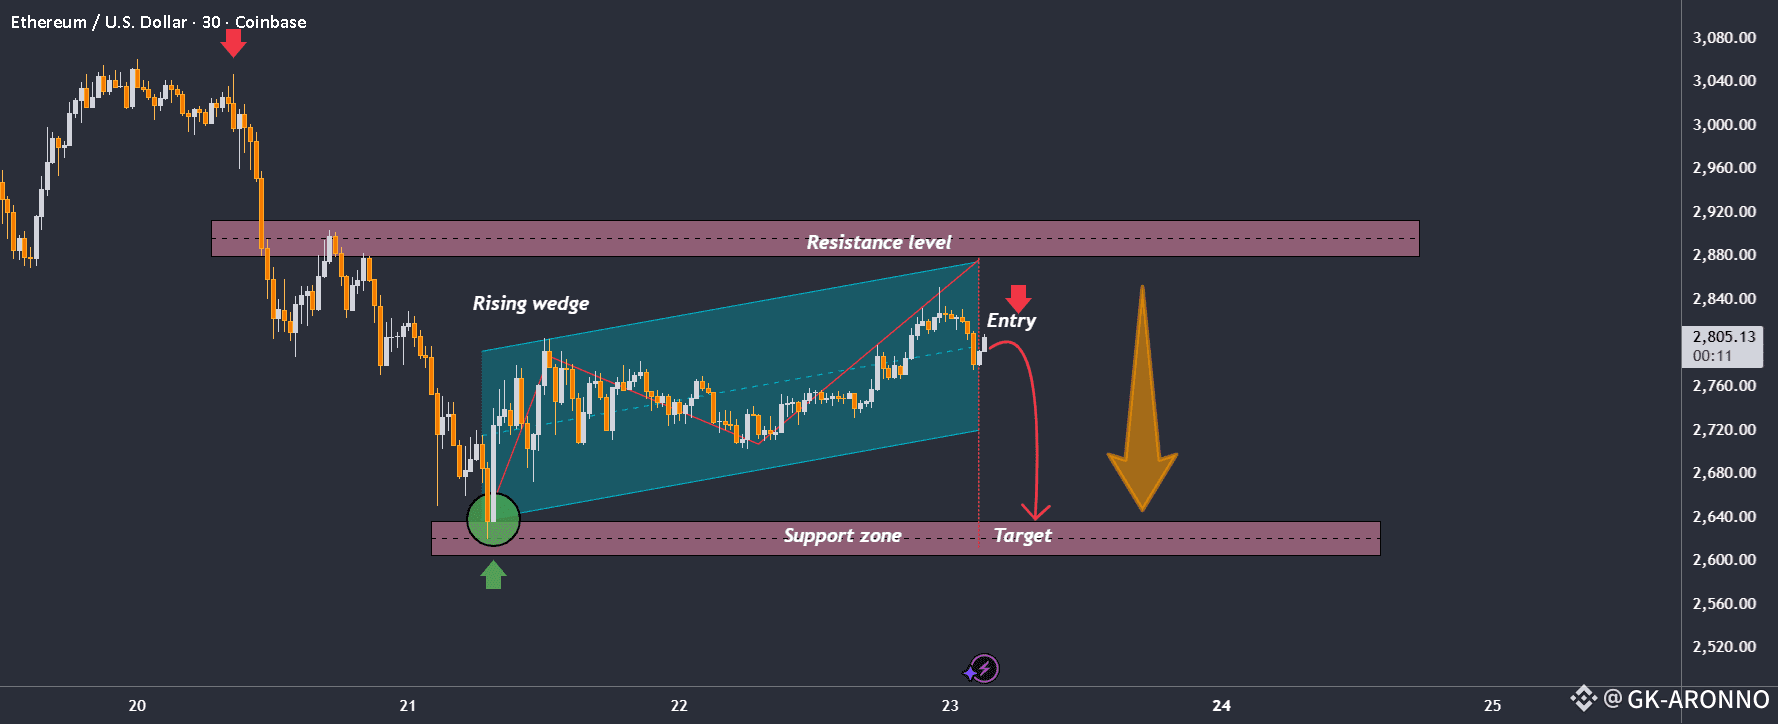
Your chart illustrates a bearish setup forming on the ETH/USD 30-minute timeframe:
1. Rising Wedge Pattern (Bearish Structure)
ETH has been moving inside a rising wedge, a pattern that often signals weakening bullish momentum.
Price makes higher highs and higher lows, but the slope is narrowing—indicating a potential reversal.
Toward the right side of the wedge, candles show slowing upward momentum.
2. Key Resistance Zone
A major resistance area lies around $2,880 – $2,920.
Price reaches the upper boundary of the wedge right at this resistance, making it a high-probability rejection point.
3. Entry Trigger
The chart indicates an entry after price breaks down from the wedge structure.
A bearish arrow highlights the expected move downward.
4. Bearish Target
The target zone aligns with the support zone around $2,630 – $2,650.
This level has previously acted as a strong demand zone (highlighted with a green arrow and circle).
5. Market Psychology
Buyers attempted to push ETH higher but were unable to break above resistance.
Sellers stepped in near resistance, causing a breakdown from the wedge.
The structure supports a trend continuation to the downside.
6. Summary
The chart signals a bearish reversal from a rising wedge at resistance, with a likely move back into the support zone. This aligns with classic technical analysis principles: wedges break downward and often return to the base of the formation.
✅ Trade here on $ETH

🚨🚨
👉Keep an eye on the charts and your portfolio, and remember: DYOR -Crypto is always changing, so stay informed before jumping in! 🚀💸
