The beginning of the cryptocurrency market is effort and method, the mid-term is wisdom and mindset, and the advanced level is character and cultivation. One must clear distractions, maintain a calm mind like a mirror to overcome all human flaws in order to grasp the chips of profit.
I sincerely suggest that whether you are a novice entering the circle or an experienced veteran, you must read this article I wrote today, as it will undoubtedly provide you with great assistance. I went from bankruptcy to financial freedom, achieving an 1800 square meter villa and a Rolls Royce along with a nanny car in Shenzhen!

Without further ado, let's get straight to the point!!!
These troublesome technical indicators and candlestick patterns, how exactly should they be used [with practical case studies]?
1. Indicator SAR
The simple, "foolproof" SAR indicator can help you identify market shifts between bullish and bearish trends, preventing you from getting trapped in a losing position. It's primarily used as a stop-loss point, making it a defensive indicator. Once the SAR is broken, sell immediately to lock in profits and prevent them from being given back or even turning a win into a loss.
1. When the price is above the SAR curve, it indicates a bull market. When the price is below the SAR curve, it indicates a bear market. A sell signal is generated when the price breaks below the SAR from above. A buy signal is generated when the price breaks above the SAR from below.
2. When the price breaks below the SAR curve and continues to move downwards while the SAR curve also moves downwards, it indicates that a strong downtrend has formed. The SAR curve exerts significant pressure on the price, and investors should resolutely hold cash and reduce positions on rallies. Based on my observation, this indicator is more suitable for 12-hour trading.
Compared to the MACD indicator, it is clearer and avoids the situation where the MACD lines are stuck together and it is difficult to distinguish between death crosses and golden crosses.
The SAR index has the following advantages:
1. It is easy to operate and the buy and sell points are clear. You can start to operate as soon as a buy or sell signal appears. It is especially suitable for small and medium investors who have not been in the market for long, have little investment experience, and lack trading skills.
2. Suitable for a "bull market" with continuous upward movement, it will not be easily shaken out or washed out by the main force.
3. Suitable for a continuous downward trend in a "bear market," it will not be fooled by rebounds during the decline.
4. Suitable for short- to medium-term swing trading.
5. While long-term use of the SAR indicator may not allow you to buy at the lowest price or sell at the highest price, it can help avoid the risk of being trapped in a losing position for a long time, and at the same time, it can help you avoid missing out on bull market opportunities.
The SAR indicator has the disadvantage of being prone to failure in volatile markets.
Things to note:
1. When the SAR curve moves downward at an angle greater than 45 degrees, it indicates that the selling pressure is strong, the decline is rapid, and the price will continue to fall. At this time, investors should resolutely hold cash and wait and see, and should not try to catch a rebound.
2. When the SAR curve is rising at an angle greater than 45 degrees, and the SAR curve has just started to rise, it indicates that the buying power is beginning to accumulate and will continue to climb. At this time, investors should firmly hold cash and wait for the price to rise.
3. When the SAR curve rises at an angle greater than 45 degrees, and has been rising for a considerable period with a significant short-term increase, it indicates that the buying power has been exhausted, and the price may reverse downwards at any time. In this situation, investors should closely monitor the SAR curve's movement, and should decisively liquidate their positions and exit the market once the SAR indicator issues a clear sell signal.
4. When the SAR curve moves downward at an angle of less than 45 degrees, and the SAR curve has been moving downward for a long time (at least 3 months), once the stock price breaks through the SAR curve upward, it indicates that the medium- to long-term downward trend of the stock price may be over, and it is time to start buying on dips.
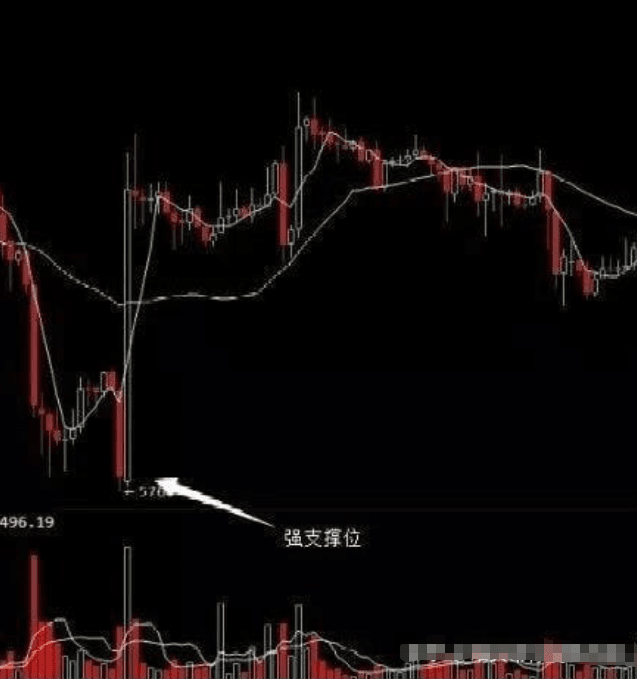
Switching and applying pressure and support
Support and resistance lines are crucial for determining entry and exit points, and these points ultimately determine profits.
Conversion between support and resistance levels:
Once a support level is broken with high volume, it will become a resistance level. Similarly, once a resistance level is broken, it will become a support level.
The reliability of this transformation should be judged based on the following two aspects:
The number of times the market has tested this support or resistance level in the past;
The size of the transaction volume during the initial testing phase.
A resistance level, also known as a resistance level, becomes a resistance level because a large amount of capital is trapped in that area. Once the price reaches that level again, it will encounter a large amount of trapped capital selling off, making it impossible to break through the resistance level. If there is no large amount of selling, or if the buying volume exceeds the selling volume, the level will be broken, and market confidence will look towards higher levels.
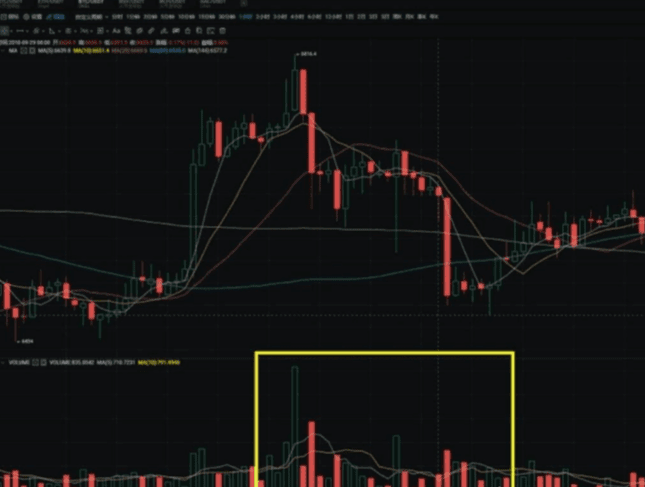
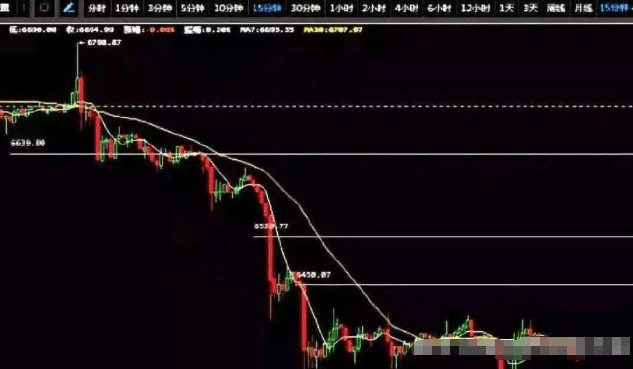
 As shown in the chart above, the price repeatedly failed to break through the 6800 level, followed by a significant drop with high volume. Therefore, 6800 will become a crucial resistance level, putting pressure on any subsequent upward movement. If this resistance level can be broken, further bullish prospects are possible. However, if the price repeatedly encounters resistance and retraces, caution is advised, as multiple failed attempts to break through could lead to a decline.
The principles of support and resistance levels may seem simple, but don't underestimate their importance just because they are simple. They significantly improve the accuracy of trend predictions. Furthermore, support and resistance levels can serve as important entry points for buying or selling.
 As shown in the chart above, if a significant rebound with trading volume occurs in the near future, exceeding 6334, then there's no need to hesitate; you can immediately buy in. A break above this key resistance level will likely lead to a move towards the next high resistance level of 6800.
Take any daily or hourly chart; the conversion between support and resistance levels is valid. Even in a stable and volatile market, the most important reference for short-term trading is whether the resistance level can be broken or whether the support level will be broken.
2. Bollinger Bands (BOLL)
Bollinger Bands (BOLL) are a very useful technical indicator. While indicators like KDJ, RSI, and MACD often signal buy signals with golden crosses, they become less effective when the market is consolidating sideways. During periods of sideways movement, we often want to know when a trend will emerge, and this is where Bollinger Bands come in handy.
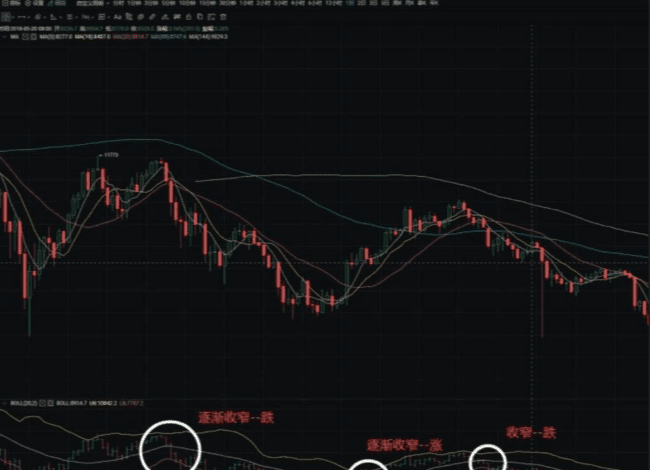
1. Narrowing Bollinger Bands indicate an impending market reversal (as shown in the chart above).
As we can see in the chart above, Bitcoin's Bollinger Bands have become very narrow at this point, and it has been consolidating for many days. This indicates that the forces of both buyers and sellers are converging, with neither side having the upper hand. When the Bollinger Bands narrow like this, Bitcoin may break out in any direction at any time; the narrower the bands, the stronger the breakout will be. However, whether it will break upwards or downwards is unknown. The current state of the Bollinger Bands only confirms that a trend reversal is imminent and could happen at any moment; a major market move is brewing. Extreme caution is advised; avoid using leverage lightly, and refrain from short-term trading, as you might not even recoup your transaction fees.
2. Signals from widening Bollinger Bands: When the price reaches a certain high level, has risen for a period of time, and the Bollinger Bands have widened to a very large extent, a sudden contraction is a sell signal, usually accompanied by a sharp drop. When the price reaches a certain low level, moves along the white line in the middle of the Bollinger Bands, and after the Bollinger Bands narrow, they suddenly widen, it is a buy signal.
3. The Bollinger Bands (BOLL) channel is calculated by adding or subtracting the average volatility of historical prices. If the price fluctuates significantly on a given day, the channel will be deformed accordingly. Therefore, Bollinger Bands have a lag effect and are less valuable for judging market reversals compared to other technical indicators. However, they are indispensable for judging the end of consolidation phases.
Volume and Price (Volume-Price Rule)
Increased volume is a turning point and a key signal; rises and falls without volume are false breakouts; shrinking volume indicates sideways movement, and the shrinking the volume, the closer to a trend reversal; if the price rises after increased volume, but subsequent buying volume doesn't follow, it will still fall; if the price remains unchanged despite increased volume, it indicates accumulation at low prices and distribution at high prices.
1. Buy when there's no volume at a high price, even if you buy the wrong thing.
2. If there's high volume at a high price level, you should sell; even if you sell at the wrong price, you should still sell.
3. If there's no volume at a low price, you have to wait, even if you're wrong.
4. If there's a surge in volume at a low price level, you should follow the trend, even if it's wrong.
5. Increased volume, stable price, turning negative.
6. Increased volume and rising price indicate a buying opportunity.
7. Volume remains stable while price rises; add to position.
8. If volume remains flat but prices fall, exit the market.
9. Decreasing volume but increasing price, hold
10. Increased volume, decreased price; hold cash.
Just be aware of these 10 points. Remember that increased volume is an important signal, but for specific price movements, it's best to analyze the overall market trend. Don't rely solely on the above formulas.
High trading volume warrants caution, as it may signal the start of a new market trend.
Increased volume refers to a sudden surge in trading volume, with the price bars (or candlesticks) becoming significantly higher. This typically occurs at price turning points and is an important signal. It indicates that while some investors are strongly bearish, others are strongly bullish, leading to increased trading volume. Increased volume during a downtrend often signifies capital outflow, increasing the likelihood of further declines. However, if the price has already fallen significantly, it may represent the final wave of downward pressure, with the bears exhausting their strength, and the market likely to consolidate or rise. Conversely, increased volume during a price rise may indicate continued upward movement. Similarly, if the price is at a high point in an uptrend, it may represent the final wave of buying pressure, followed by a decline.
A surge in trading volume has different implications at different stages. At high levels, rising prices and increased buying volume may indicate that buying power is running out, marking the final frenzy of a bull market. At low levels, it signifies capital inflow. At low levels, falling prices and a surge in selling volume may indicate the end of a bear market, the exhaustion of selling pressure, and a turning point. At high levels, it signifies distribution. This aspect has some reference value.
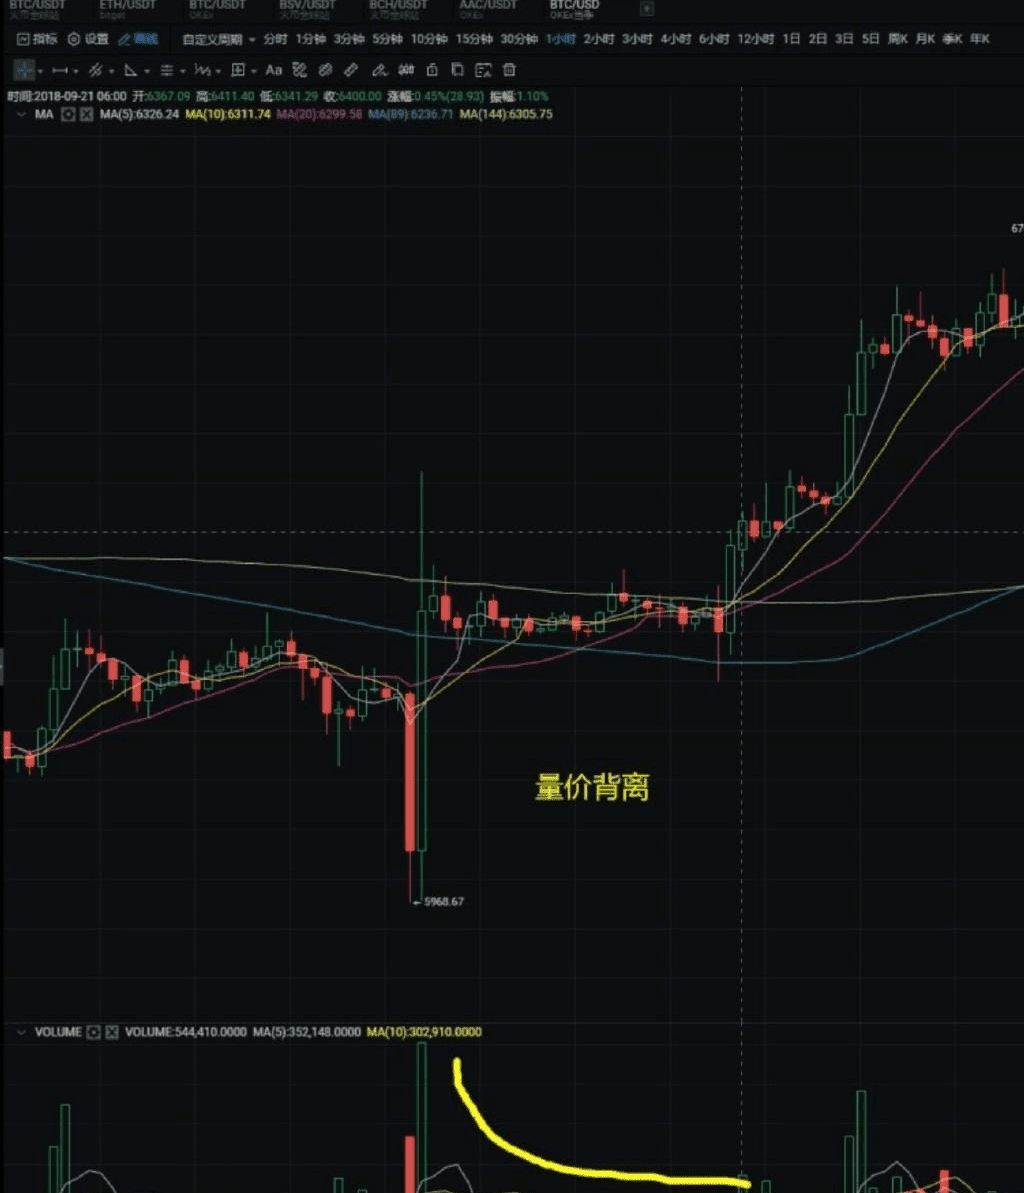
In the stock market, the relationship between volume and price has many forms and uses, such as "volume increases, price increases." This means that volume is continuously increasing while the price is steadily rising. This doesn't apply to the cryptocurrency market because the amount of capital is limited, making it difficult to achieve sustained volume and price increases. If you look at historical charts, charts showing a steady increase in both volume and price are practically nonexistent. The cryptocurrency market favors sideways movement, sharp rises, and sharp falls. However, there's one point to be aware of: volume-price divergence. Simply put, if after a sudden price surge, fewer people are buying, and the market isn't as active as before, be careful; the good times might be coming to an end. For example, Bitcoin surged on July 18, 2018, followed by increased trading volume. It surged again on the 24th, followed by another surge, and then surged again on the 27th. However, the volume clearly shrank, indicating that buying power was no longer supporting the price, which easily led to a price decline.
Quantity-price relationship:
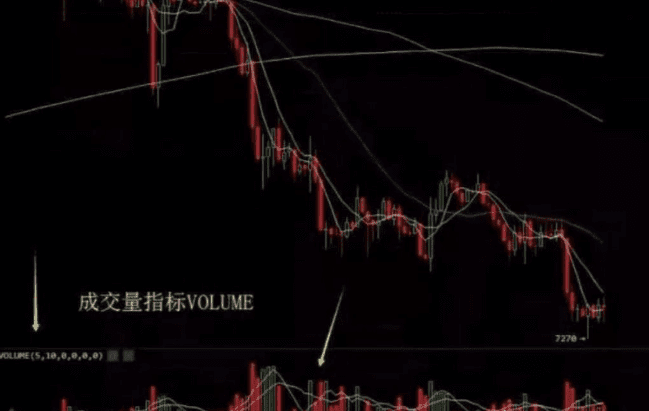
Trading volume indicator (VOL)
The red and green bars in the image above represent trading volume. The red and green colors indicate the current price movement, not the buying and selling volume. Some analysts might tell you, "Look at those big red bars, so much stock has been sold, funds are fleeing," or "Look at the green bars, it means strong buying pressure and a large volume of purchases." These interpretations are very one-sided. Trading volume is meaningful only in its size. Large volume indicates that both buyers and sellers agree on the price, resulting in a transaction; large disagreements result in small volume. A large red bar indicating a price drop suggests both buying and selling pressure, albeit slightly more selling, and doesn't necessarily mean the price will continue to fall. Therefore, you cannot solely rely on trading volume to determine whether funds are involved in buying or selling to guide your decisions; doing so will lead to errors.
Identifying worthless cryptocurrencies by transaction volume
Buy amount + Sell amount = Trading volume: Cryptocurrencies with a trading volume of less than $1 million USD can be easily checked using the Feixiaohao website (as shown in the image below) and its app. Cryptocurrencies with a 24-hour trading volume of less than $1 million USD are not worth buying.
Cryptocurrencies with trading volume plummeting to rock bottom (see chart below): If the trading volume is extremely low based on the candlestick chart, be very cautious about buying in. Investing 50,000 yuan is generally enough to drive the price up.
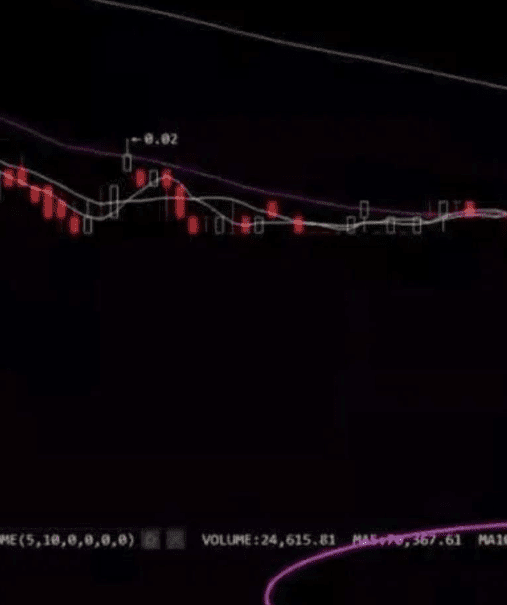
Stagnant coins: As shown in the image below, the minute chart often shows zero trading volume, and the candlestick pattern lacks any candlestick formation.
Coins with inflated trading volume: As shown in the image below, the trading volume is evenly distributed like a comb.
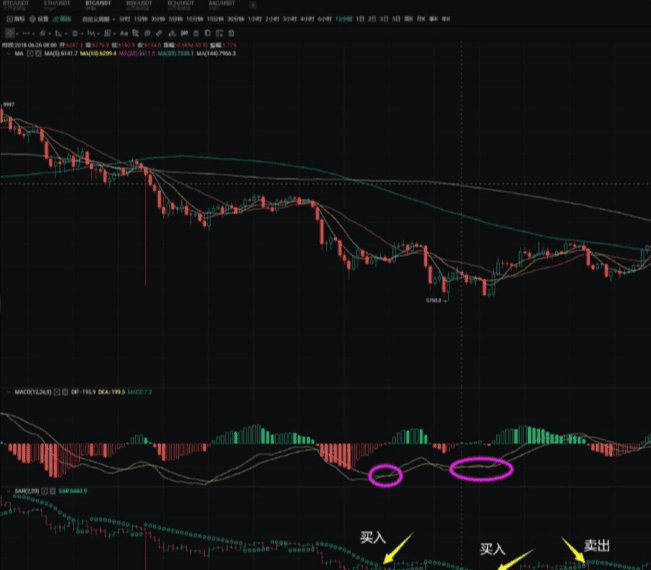
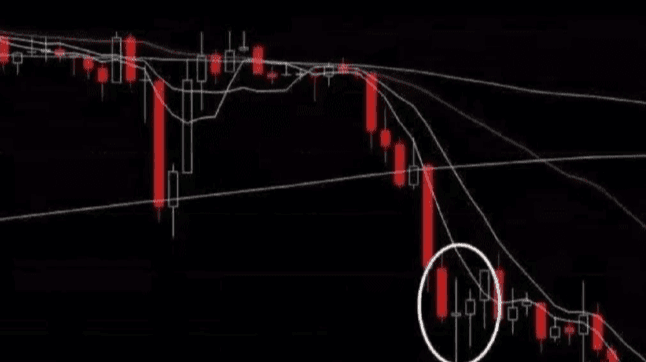
Simple bottom-fishing signals:
You must see a bottoming signal before entering the market; bottoming signals at support levels are very reliable, while those at other support levels are much less reliable.
A bottoming signal can be summarized as follows: a large bullish candlestick or a doji candlestick, accompanied by high trading volume, forming a MACD divergence at a key support level. Several key points are involved: a large bullish candlestick or a doji candlestick appears on the chart. These two are most common in the cryptocurrency market: trading volume forming a MACD divergence at a key support level.
Please remember these four points. They are not absolute, and there's no guarantee you'll always buy at the absolute bottom, but they are enough to significantly reduce the risk of bottom-fishing. Prioritize risk reduction before considering maximizing profits.
 In terms of time frame, because cryptocurrency trading is continuous and global, it changes rapidly. If you look at a 15-minute candlestick chart, the effective time of the signal is 15 * 4 hours; if you look at a 1-hour candlestick chart, the effective time is 1 * 4 = 4 hours, and so on.
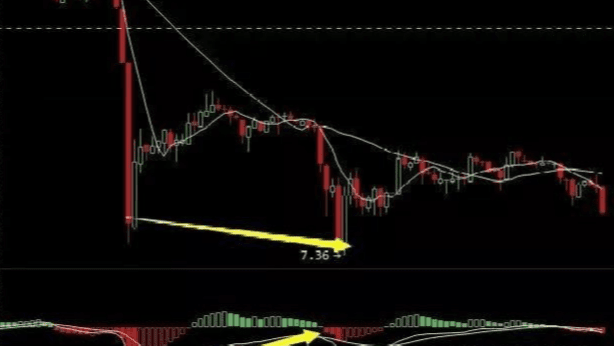
Using the above chart as an example: a large bullish candlestick with significant trading volume (in some market conditions, red indicates an upward trend; adjust according to your own market conditions. I'm using Huobi's chart, where green indicates an upward trend and red indicates a downward trend). If such a candlestick is found at a support level, it may be a signal that the price has bottomed out.
A bullish candlestick with some trading volume appeared on the 2-hour chart, and a MACD divergence was observed. This suggests a relatively stable outlook, with no significant drop expected within the next 8 hours. However, the trading volume was insufficient, resulting in a weak rebound that is unlikely to escape a decline unless there is a sudden surge in volume that changes the overall pattern.
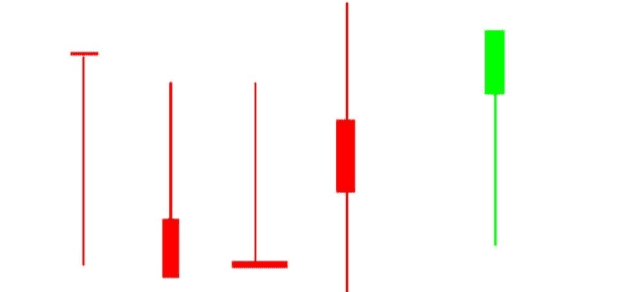
Long-legged cross star: as shown in the picture above
If this long-legged doji candlestick pattern for Bitcoin is green (indicated by a bearish candlestick), then it's even more reliable, and there's less chance of a further drop in the following days. If it's green, it's likely to see a sharp upward move. This doji candlestick pattern is also accompanied by MACD divergence and is a significant support level.
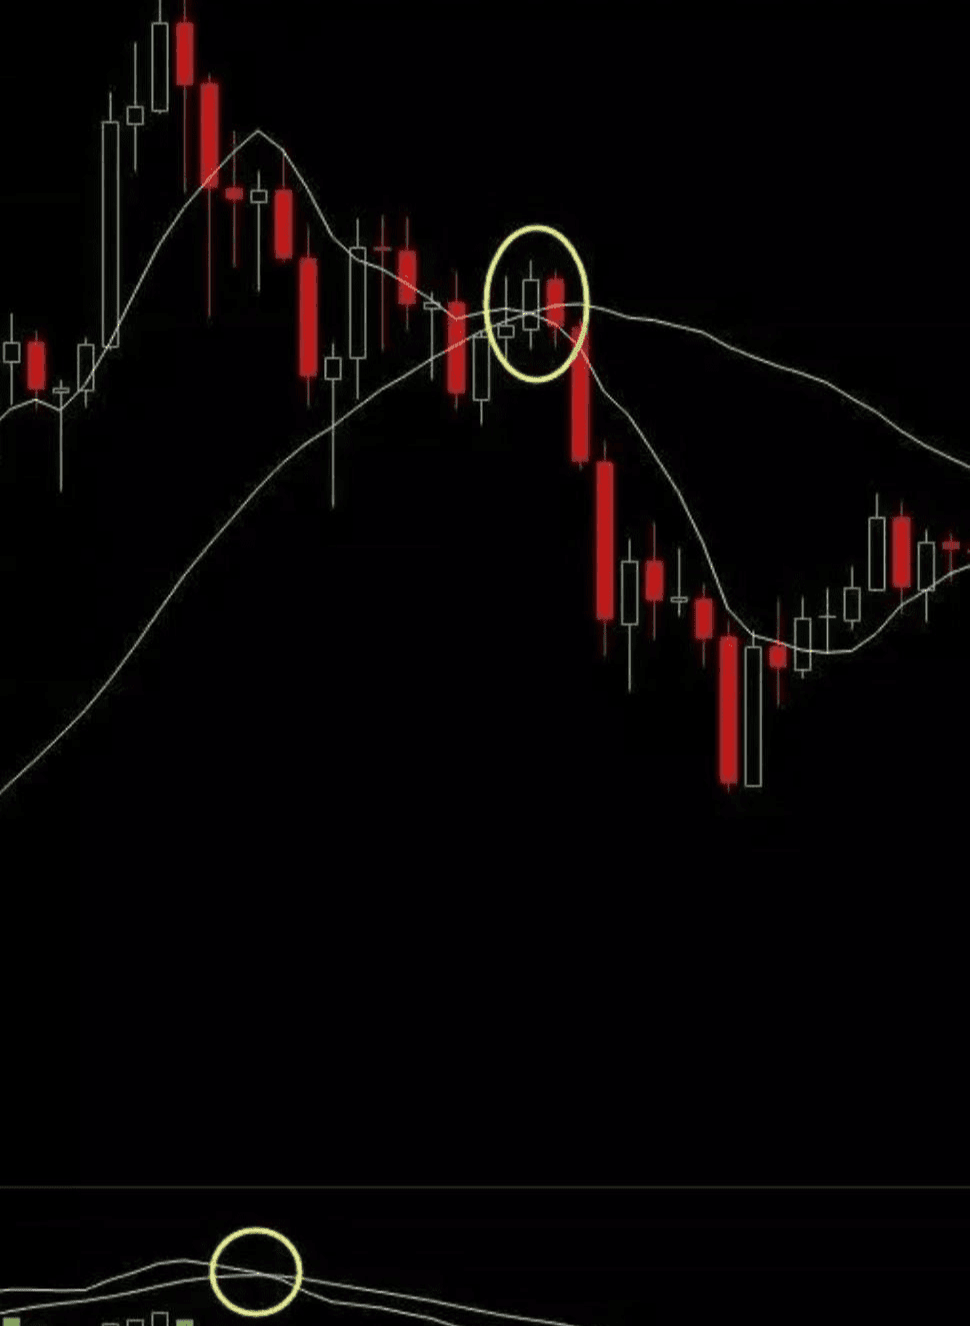
 It must be accompanied by trading volume; otherwise, it indicates weakness, and any rebound will likely be followed by another drop. As shown in the chart above, the support level was broken twice, but the trading volume was insufficient. This situation is very dangerous. The support level has been broken, but there's no strong rebound with increased volume, indicating a lack of confidence in bottom-fishing in the market.
Common pin diagrams: different positions represent different meanings
Generally speaking: Top exit signal, bottom buy signal, mid-term consolidation signal.
Basic knowledge of MACD classification:
MACD is an essential indicator for all-in bettors and leveraged traders. Everyone gets excited when they hear "all-in," and novice investors love to go all-in, throwing their entire fortune in the gamble, ignoring position management and such. I just can't do that, and I don't like it. I feel like I've expressed the sentiments of most novice investors. But! Should we go all-in based on gut feeling? NO! We need to go all-in rationally! Guarantee our odds of winning!
MACD – a crucial analytical indicator, and a primary reference for low-frequency, all-in, and leveraged traders. Everyone knows that moving averages have death crosses and golden crosses, but moving averages are usually quite lagging, and relying solely on them for buying and selling can result in very small profit margins. After improvements, MACD was developed, providing signals much earlier than moving averages.
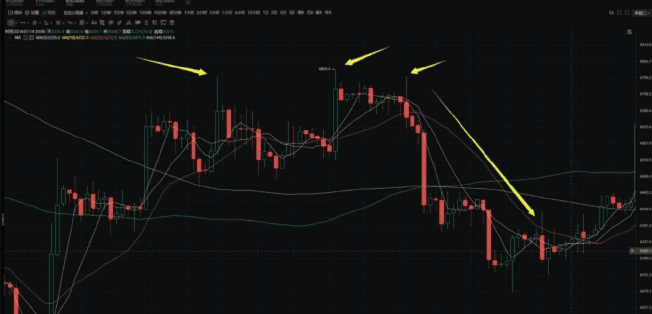
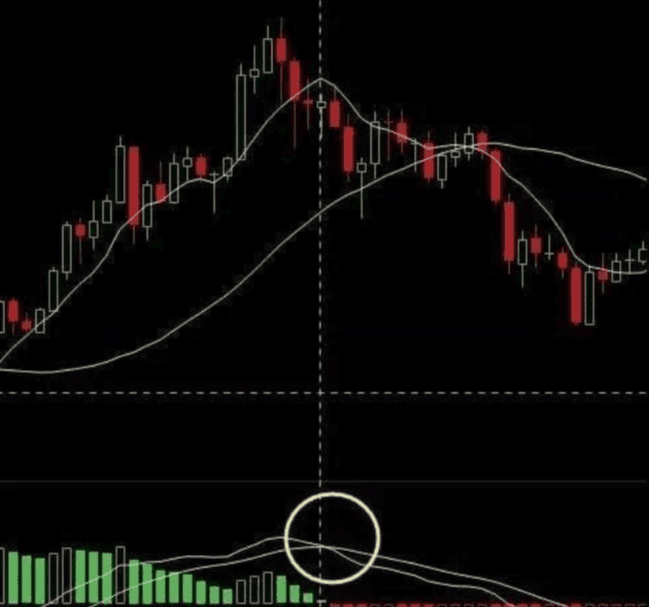
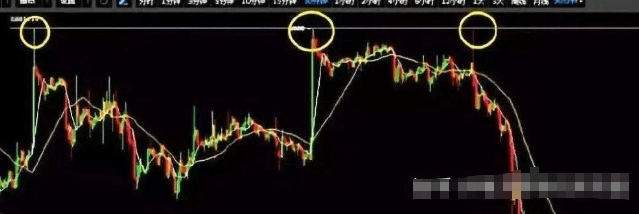
For example, in the chart below, the golden cross on the daily chart lags behind the MACD by about half a month.
The same applies to death crosses. By the time you see a death cross forming on the daily chart and prepare to sell, your profits have already been significantly reduced. (See chart below)
MACD stands for Moving Average Convergence Divergence, which is a bit of a mouthful, so just remember the English name. It consists of two lines: a fast line and a slow line. The trend is determined by the constant crossing and diverging of these two lines. The parameter settings are generally 12/26/9 (see image below).
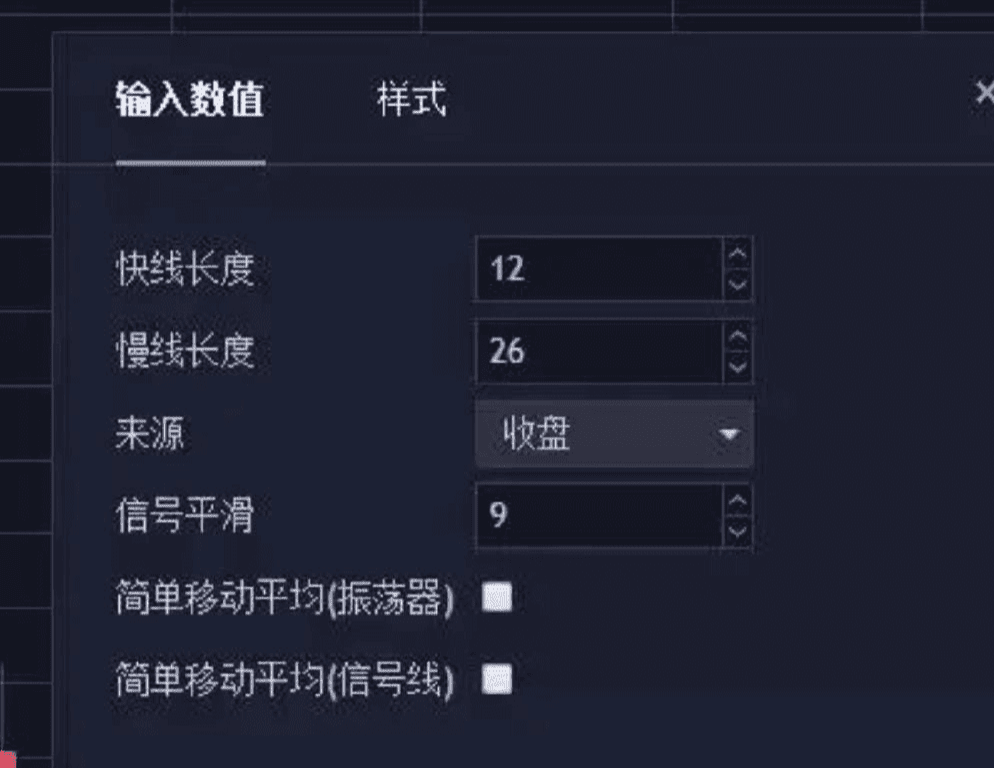
The MACD has four components: the fast line DIFF (white), the slow line DEA (yellow), the zero line, and the horizontal line between the red and green bars. DIFF, the white bar, is the primary indicator, while the yellow bar is secondary. (See image below)
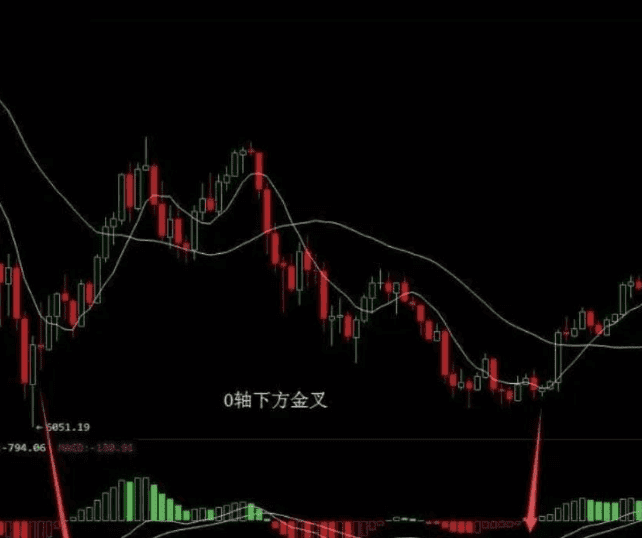
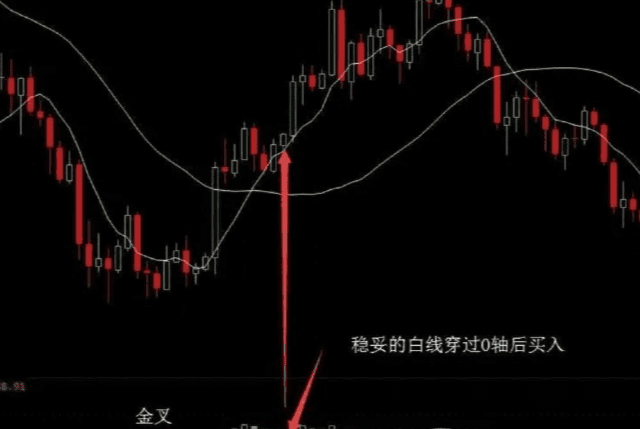
However, a golden cross below the zero axis is not 100% reliable; it only indicates that the decline may be about to stop. To be on the safe side, you can wait for the white line to cross the zero axis upwards and go all in. You can see in the following figure that after breaking through the zero axis, there will be an accelerated rise.
A golden cross above the zero line is generally considered a good sign in the crypto market, often indicating a willingness to go all in and chase the price up. However, this isn't always the case in the crypto world. Bitcoin has yet to form a reliable golden cross above the zero line; it almost always appears below it.
MACD Usage: Part Two - Death Cross
The fast line crosses the slow line from above, meaning the white line crosses the yellow line from below. Similarly, above the zero line, this is a sell signal for short selling and a pullback signal.
Below the zero line is a signal of accelerated decline. Don't hesitate, liquidate your positions immediately! You can bravely sell at this point without any problem! Don't hesitate until you've already suffered significant losses before selling; that's not just cutting your losses, it's ripping your bones! If two death crosses form, it's an enhanced escape signal!
MACD Usage: Usage Three—Energy Columns
What are energy bars? Energy bars are simple: they are red and green bars above and below the zero line. Below the zero line, the bears have the upper hand; above the zero line, the bulls have the upper hand. Once you learn to read this, you won't need to ask others whether the bears or the bulls are in control.
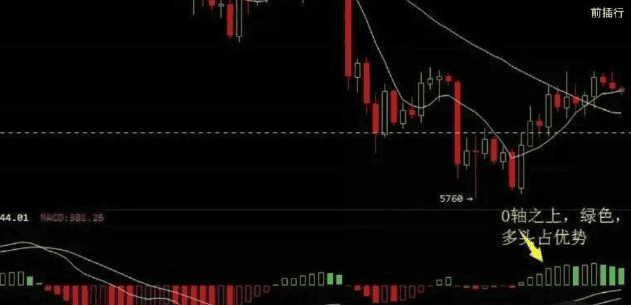
Changes in energy pillars can be used to determine changes in power.
MACD Usage: Usage Four - Divergence
You must learn to identify deviations from this, because this concept is used in various indicators you learn. RSI and OBV both exhibit this behavior.
Top divergence: Top divergence occurs when the price reaches a new high, but the indicator does not. In this case, the price usually falls back, which is also known as indicator consolidation.
Bottom divergence occurs when the price hits a new low, but the indicator does not. This is a bottom divergence signal. Aggressive traders can buy at this point, while conservative traders can wait for the price to stabilize before entering the market. Risk and reward go hand in hand.
For example, the EOS chart below shows a divergence in 5 minutes, which could be a good time to buy at a new low. However, the divergence in 5 minutes is very short-lived, so you need to enter and exit quickly and exit with a profit within 30 minutes. Therefore, it is not recommended for beginners.
This indicator is extremely important. Even if you can't understand other indicators, you must understand this one.
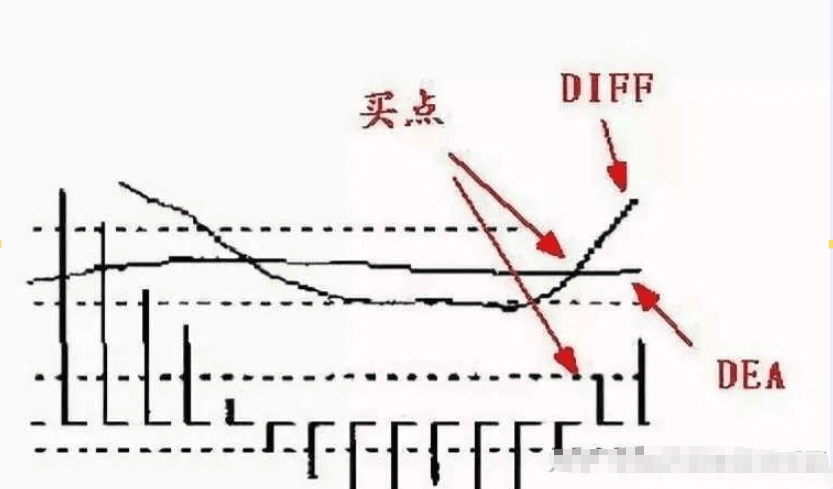
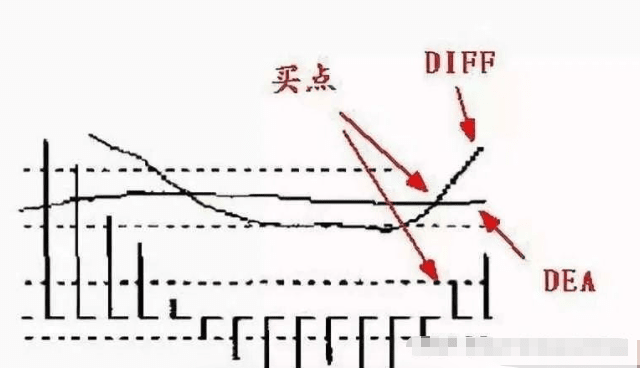
MACD buy signal
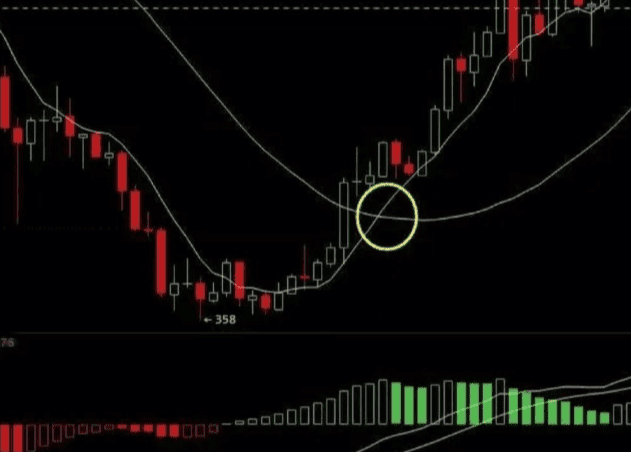
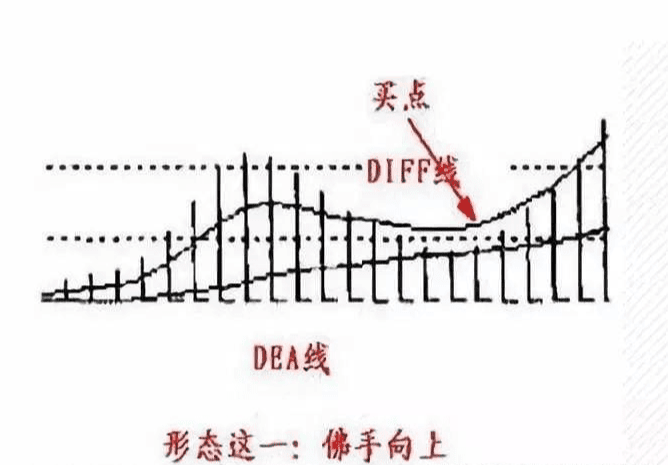
As shown in the chart below, after the DIF and DEA lines form a golden cross, they move upwards along with the price. Then, they move downwards along with the price pullback. When the main players are shaking out weak hands, the price pulls back, and when the DIF line pulls back to near the MACD line, the DIF line reverses upwards, thus forming the "Buddha's Hand Upward" pattern.
"Duckling Emerging from Water": After the DIF crosses the DEA line below the 0 axis, it does not cross the 0 axis or only crosses it slightly before returning below the 0 axis, and then crosses the DEA line downwards. A few days later, it crosses the DEA line again (as shown in the figure). This pattern is a bottoming pattern that appears when the selling pressure is exhausted after the price has fallen and bottomed out. It should be interpreted as a bottoming and rebound signal, and you can choose an opportunity to enter the market.
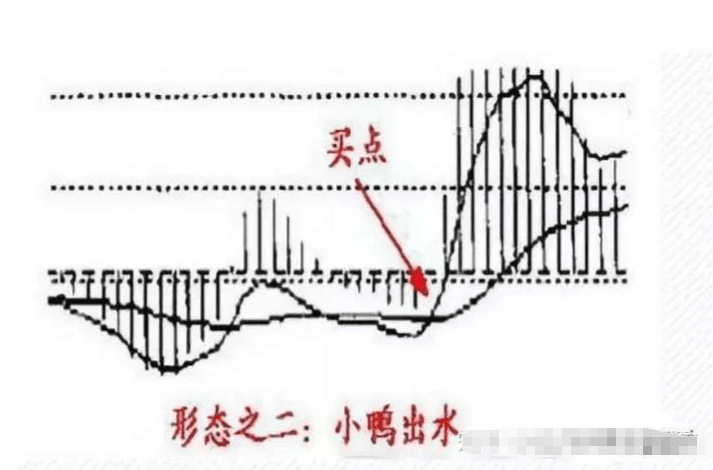
For example, the Bitcoin buy point on April 8, 2018, followed the "duckling emerging from the water" pattern, which marked the start of a bull market.
"Walking on Clouds" refers to the DIF line crossing below the DEA line above the zero axis, then crossing back below the zero axis, and finally crossing above the DEA line again at or above the zero axis. This pattern forms when the price is consolidating during a bottoming-out and rebound process, or it can be a bottoming pattern indicating an upward trend. It should be interpreted as a positive entry signal, and one should decisively enter the market.
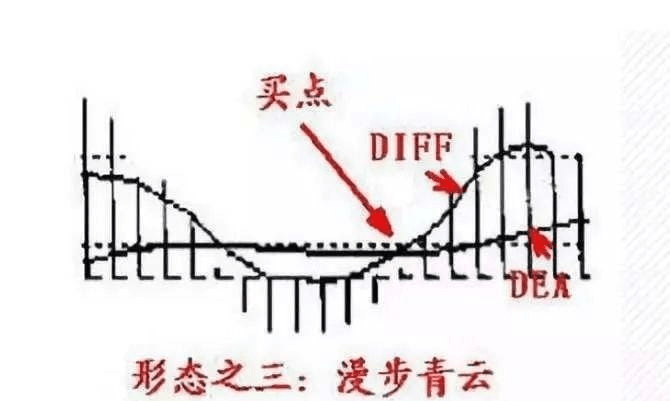
This pattern has never formed on the daily chart for Bitcoin, but it has appeared on the hourly chart.
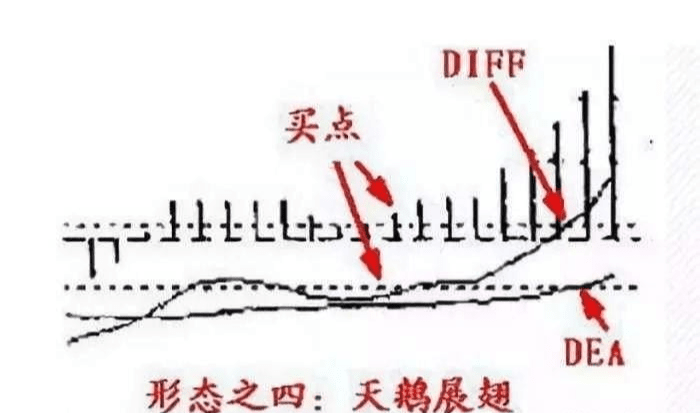
The "Swan Spreads Its Wings" pattern refers to a situation where the DIFF line crosses the DEA line below the zero axis, then retraces before crossing the zero axis again, moving closer to the DEA line. The MACD histogram shortens, but before crossing the DEA line again, it reverses upwards again. Simultaneously, the MACD histogram lengthens, forming the "Swan Spreads Its Wings" pattern. This pattern often forms at the bottom, appearing after the price has fallen and bottomed out, when selling pressure has been exhausted. It should be interpreted as a buying opportunity for major players.
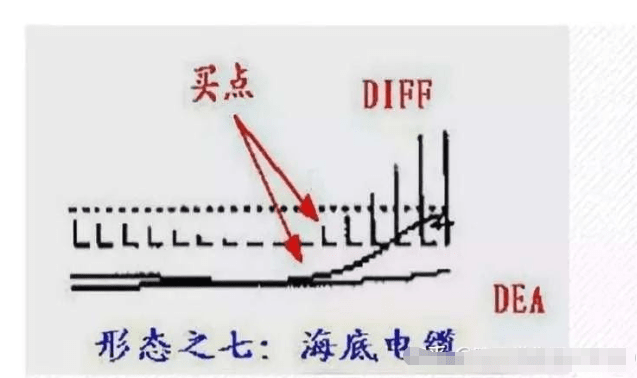
The "Aerial Cable" pattern refers to a scenario where the DIFF line in the MACD indicator previously crossed above the DEA line below the zero line, then ran above the zero line for a period. Following a price pullback, the DIFF line also began to decline. When the DIFF line reached the DEA line, the two lines converged into one. When they separated again and began to diverge in a bullish manner, a buying opportunity arose, signaling the start of a new upward trend. This pattern often appears during upward consolidation and is used by major players to shake out weak hands. After a brief consolidation during an uptrend, the price exhibits a strong upward momentum, which should be interpreted as a positive entry signal, prompting a decisive buy.
The "Aerial Cable Car" pattern primarily refers to the DIFF line crossing below the DEA line above the zero axis, but not crossing below the zero axis itself. A few days later, it crosses above the DEA line again above the zero axis. This pattern often appears during upper-level consolidation, a move by major players to shake out weak hands. After a brief price adjustment, it exhibits strong upward momentum, which can be interpreted as a positive buy signal. A decisive buy is warranted, and if there is continuous volume increase, a strong bullish outlook is warranted.
The "Submarine Cable" pattern refers to a situation where the MACD indicator has been running below the zero line for a long time (generally more than 20 days). After the DIFF line crosses the DEA line (a golden cross below the zero line), the two lines do not rise strongly, but rather converge with the DEA line into a straight line with almost equal values. Once the two lines begin to diverge in a bullish direction, it's a buy signal. The formation of the Submarine Cable pattern below the zero line often occurs after the price has fallen and bottomed out, when selling pressure has been exhausted. This is when major players intervene and accumulate shares at the top of their positions, which should be interpreted as an opportune entry point into the market.
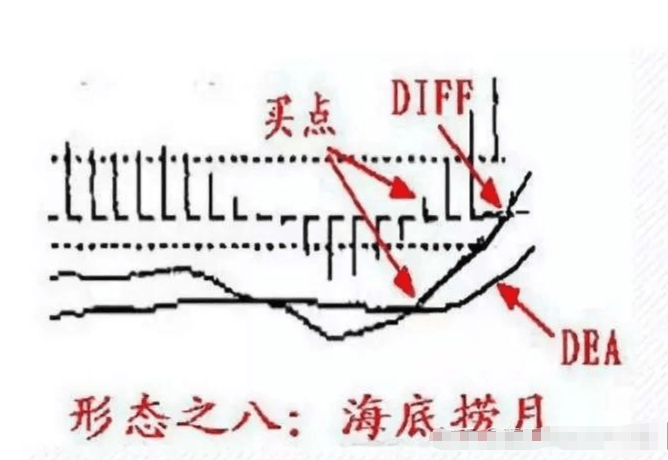
"Fishing for the Moon at the Bottom of the Sea" refers to a second golden cross of the DIFF line below the zero axis, indicating that the currency has bottomed out and is beginning to emerge from the bottom, making it a good time to enter the market.
OBV indicator
When the price of a coin rises while the OBV line falls, it indicates weak buying pressure, and the price may fall back.
When the price of a coin falls while the OBV line rises, it indicates strong buying pressure. Buying on dips may cause the price to stop falling and rebound.
A slow rise in the OBV line indicates that buying pressure is gradually strengthening, which is a buy signal.
When the OBV line rises rapidly, it indicates that the momentum is about to be exhausted, which is a sell signal.
How to draw support and resistance lines
The most basic and common method for identifying support and resistance levels is by drawing horizontal lines. Resistance levels refer to price levels where a coin needs significant volume to break through; a breakout usually indicates a higher probability of further upward movement, and a breakout at this level can be a buying opportunity. Support levels are price levels that are less likely to be breached; if a breakout occurs, it's advisable to sell immediately to cut losses.
principle:
The distribution of chips indicates that many positions are trapped at this level.
The psychological effect: some people buy the dip or sell the stock after it hits the support level.
Once the major players see the price break below the support level, they won't defend it, causing the decline to accelerate. Conversely, once the support level is broken, they will likely push the price up further.
Drawing method:
Many people struggle with this drawing method, leading to misjudgments primarily due to incorrect point selection.
There are several key reasons for choosing a location:
The closer the points are, and the more recent highs or lows they form, the stronger their influence.
Points that are not significantly different can be considered the same.
If many high and low points are formed during operation, they can be sorted according to their importance and drawn as a horizontal line.
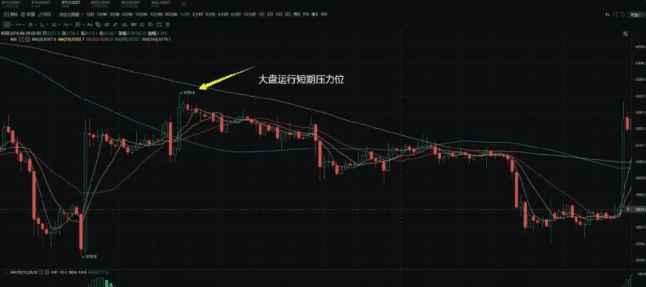
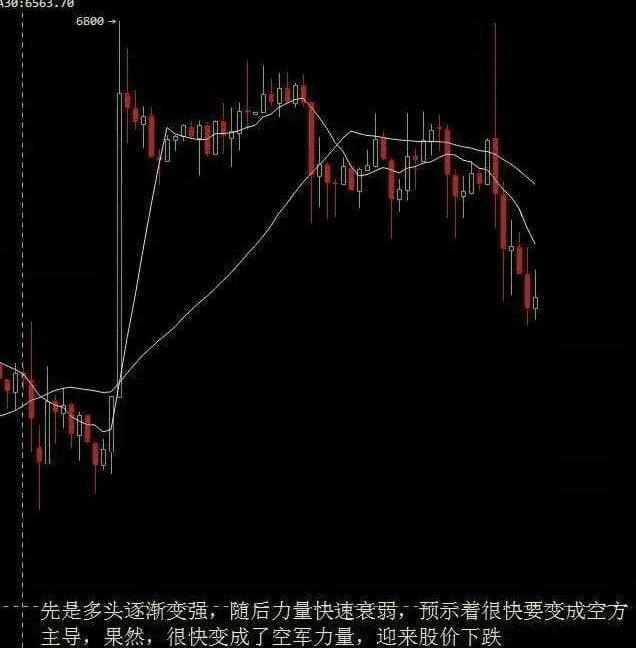
As shown in the image above, the resistance and support levels for BTC can be drawn as follows: based on previous high-volume trading points, touch points, and breakout points, four short-term upward resistance lines for BTC are drawn.
The price of the coin has encountered resistance or support multiple times, and the more times it encounters resistance, the stronger the support.
The trading volume at this location is very high.
Is this position an integer?
Is this position the highest or lowest point?
As shown in the chart above, BTC has attempted to break through the 6800 level three times, and each time it has immediately fallen back, indicating that this level represents very strong resistance. To further illustrate just how strong this resistance is, we can zoom out on the candlestick chart to examine further down the chart.
Since the price broke below 6800 in June 2018 with high trading volume, this level has become a resistance level. The market has made several attempts to break through this level, but each attempt failed. Over time, this level has become increasingly difficult to overcome. Due to psychological factors, many people will reduce their positions when the price reaches 6800. Once the price breaks through this level, market confidence will increase significantly, and a new rebound will begin.
Notice:
If a strong support line is broken, then that support line will become a strong resistance line.
Once a strong resistance line is broken, it will become a strong support line.
If you encounter a resistance line and fail to break through it, and then experience a significant drop in volume, you should sell.
If the price encounters a support line and does not break through it, and then rebounds strongly, you can add to your position.
If the price falls back quickly after breaking through resistance, it can be considered a false breakout.
It's actually that simple. Once you grasp this principle, you can effectively use the support and resistance levels we provide to trade between bullish and bearish markets. Even without our actual trading signals, you can still buy and sell based on the provided price levels, and set stop-loss and take-profit orders.
A support level requires two or more lows that have been repeatedly tested by the market and are difficult to break. A resistance level, on the other hand, requires two or more highs.
How do you determine the strength of support or resistance lines? It depends on the following factors:
Has the low position successfully withstood multiple market tests without being breached?
The size of the trading volume during the initial test; if the trading volume is too small, the support or resistance level is weak.
The length of time the straight line remains effective
Having traded for so many years, I've experienced both profits and losses. Let me first summarize the main reasons for my losses, some of which I've made myself.
Leverage is a double-edged sword. If used well, it can make you run faster than others; conversely, if used poorly, it can also make you die faster than others.
After trading contracts for a long time, you'll find that trading spot becomes very simple. Many beginners hope to make a fortune in a single trade, turning 10,000 into 1 million, a 100-fold increase. But if they lose 50% of their 1 million to 500,000, they'll want to double their 1 million back to their original value. If they want to go back to zero, they'll only have doubled their initial investment.
Therefore, beginners are most prone to overconfidence. After making a few profits in the crypto market, they think they have extraordinary talent and impulsively go all-in, only to end up back at zero. Traders who truly survive in the crypto market never put themselves in a desperate situation. From the moment you go all-in or heavily leveraged, you're destined to lose. I hope all crypto enthusiasts will be sufficiently vigilant in leveraged trading!
Experienced traders choose to remain completely out of the market and observe when the trend is uncertain, avoiding hasty actions. They only enter the market quickly when the trend becomes clear, and they do so with small positions. In contrast, many ordinary retail investors trade frequently, often with heavy positions when the market is unclear. This leads to continuous losses, and if they encounter aggressive market manipulators, the losses will be even greater.
Going against the medium- to long-term trend and holding onto losing positions will lead to ruin.
Many people believe they lose money in futures trading because they've been trading for too long, thinking that short-term trading is safe. However, when losses reach a point where they clearly move against the market and need to stop-loss, they always face a psychological struggle: should they stop-loss or not? Sometimes, they cling to the hope that the price will recover, leading to prolonged losses by holding onto losing positions. Even worse, novice traders who don't understand market trends hope to average down their cost basis by adding to their positions. Later, as the market moves further and further away from their positions, their already heavy positions only hasten their demise. They've embarked on the first path to ruin.
It means not to over-leverage, not to hold onto losing positions, and not to trade frequently, chasing highs and selling lows.
After several rounds of trading, the amount of money left to sell dwindles until there's nothing left to sell, leading to ruin. Most losses and account blowouts can be attributed to the three reasons mentioned above; excessive greed often stems from over-leveraging. See the following ten common pitfalls in futures trading for details.
Full margin trading – full margin trading guarantees losses.
Frequent trading – lack of technical guidance.
Going against the trend – low probability, high risk.
Locked-in trading – does not accept losses.
Dragging down or raising the average holding price—making one mistake after another.
Trying to predict market tops and bottoms without setting stop-loss orders is simply making excuses for mistakes.
When you have too much, you have too little; when you have too little, you have too much—too much pursuit of perfection is a sign of having no goals.
Blindly following rumors and trends—this reflects a lack of understanding of the market.
A lack of self-reflection and a tendency to doubt the market lead to fear of market trends.
Develop a long-term trading plan – the future is unpredictable.
In many ways, trading in the cryptocurrency market is like driving on the road.
First, go to a driving school to learn how to drive. If you don't follow traffic regulations, you'll inevitably have an accident sooner or later. Even if you follow traffic regulations, you might not hit anyone, but someone might hit you. There are pitfalls everywhere, so if you want to drive safely, you also need to learn how to avoid them.
What are the rules and regulations governing cryptocurrency trading?
See below for eight pros and cons of cryptocurrency trading:
Trading with the trend is the right approach; going against the trend is the wrong one. (Once a trend is established, it is difficult to change in the short term.)
Taking a small position is the right approach, while taking a large position is the wrong approach—position size influences attitude, and attitude influences decision-making.
Contentment is right, greed is wrong—greed is the enemy, contentment is the key.
Stopping losses and protecting profits is the right approach, while letting things drift is the wrong approach—preserving capital comes first, making money comes second.
Objective operation is correct, subjective analysis is wrong; operate objectively and abide by the rules.
Be patient and wait, and avoid being impulsive and rash. Cultivate patience and act only when the time is right.
Adding to a position when you're profitable is the right thing to do, while adding to a position when you're losing money is the wrong thing to do. Profitability is the right direction, while being losing money is the wrong direction.
Being calm and composed is the right approach, while being preoccupied with gains and losses is the wrong one. The essence of trading is a clash between human nature and mindset.
Secrets to Success in the Crypto World: You'll Regret Not Reading This!
Profitability means persisting with trend-following trades that others abandon, seizing opportunities others miss, and doing what others dare not do. In investing, there are only those who give up due to a lack of persistence, not utter failures. The same applies to trading. You might initially be bullish on a direction, but as the market fluctuates, you change your mind. You might be bearish, but exit and go long because the market has risen slightly, ultimately missing out on the downtrend and incurring losses by trading against the trend. Such examples are countless in trading; any success requires persistence.
So what are the four mindsets and five skills that a successful cryptocurrency trader should have to survive in the market in the long run?
1. Do not be arrogant or complacent when making a profit.
A proud person often destroys themselves through their pride. In the process of investing and managing finances, if someone becomes arrogant and complacent after making profits, they will inevitably lose money one day. The reason is that an arrogant and complacent person will become deaf to the opinions and suggestions of others because of even the slightest success. Even if the market changes, they will stubbornly believe in themselves, thinking that their decisions are always correct, while neglecting to guard against risks, and ultimately likely suffering losses.
2. Don't rush to recover losses.
Profits and losses are normal in cryptocurrency trading. Now that we've discussed profits, let's talk about losses. Profits can make some people complacent, while losses can ignite a strong desire to recoup losses. However, timing is crucial for recouping losses. Being too eager can lead to irrational decisions. For example, some people, desperate to recover their losses, might bet all their trading funds on a single coin that seems to have a promising future. However, the market is unpredictable and beyond human control. If that coin falls, they might not only fail to recover their losses but also incur even greater losses.
3. Don't be greedy or try to speed things up.
Accumulating wealth through cryptocurrency trading is a long process. If you're greedy and looking for quick profits during this process, you'll likely fail to achieve wealth growth. Both of these mindsets lead to a relentless pursuit of profit, causing you to lose your rationality when faced with high returns. However, high returns mean high risks, and blind investment can only lead to failure. Only by pursuing stable wealth growth can you balance risk and profit.
4. Don't be preoccupied with gains and losses.
Yingying believes that investors who are overly concerned with gains and losses often agonize over their investments for a long time beforehand, fearing losses. This anxiety intensifies once they finally decide to invest. They become anxious and irritable whenever they see their account balance decrease. If the decrease is significant, they either withdraw their funds or seek out rumors, hoping to quickly recoup their losses, ultimately ending up with losses. Furthermore, hearing news of platforms collapsing or experiencing withdrawal difficulties also fuels their fears about the safety of their investments. Even if their own platform is perfectly safe, they may choose to stop investing altogether, making it difficult to continue their investment journey.
If you can't maintain a stable mindset, you'll find it difficult to see the bigger picture and maintain a stable investment mindset. Let's talk about some cryptocurrency trading tips you might want to know:
1. Use technical indicators, but don't get bogged down in them.
There are countless technical indicators in candlestick charts. Sometimes, learning too many can disrupt one's objective analysis. The ultimate goal of learning these indicators is to use them to obtain the information one needs. If one obtains the information needed from a certain indicator, then there is no need to dwell on other indicators. Many indicators in candlestick charts have similarities.
2. Go with the flow.
Those who follow the trend prosper, those who go against it perish. In investing, one should follow the trend. Grasping the major trend is like boarding a spaceship; it will quickly take you to great heights, making it difficult not to profit. Conversely, if you trade against the trend, especially during major market movements, you will fall into a bottomless pit that can never be filled, trapping you deeply and causing huge losses. Therefore, grasping the trend is paramount.
3. History may not repeat itself, but there are lessons to be learned.
From a technical analysis perspective, clues can indeed be gleaned from historical data at times. The cyclical nature of markets remains constant; other markets follow the same pattern, progressing from adjustment to growth, growth to maturity, and then from maturity to decline, in a continuous cycle. Therefore, historical data should be considered holistically in technical analysis.
4. In-depth analysis of the news.
The currency market is filled with a large amount of information every day, so it is very important to analyze this information in depth. As a qualified investor, the most basic thing is to learn to distinguish between true and false information. In particular, some half-true and half-false information is very misleading, and sometimes a single piece of news can directly affect the directional judgment of the market.
5. Summarize your experiences and find a method that suits you.
Watching fish swim in a pond is less valuable than weaving a net; nothing ventured, nothing gained. We always envy how much money others make investing in the currency market. We watch others trade with great enthusiasm, but we dare not enter the market ourselves, fearing that we will lose everything. Here, I suggest that if you have sufficient knowledge and skills, you won't have many chances in life to take a gamble.
The two dominant factors in the market—technology and news—are a topic of endless debate among investors. Whether technology or news drives the market is actually neither; it's human psychology that drives it. Without profit-driven motives and greed, there would be no traps or fierce battles. To navigate the market successfully, one must deeply understand the art of entry and exit, offense and defense, to remain steadfast in favorable circumstances and to turn danger into safety when in a precarious situation. As the saying goes, your trust will be repaid with profits!
If you're already in this market and not doing well, come to me. I'll help you avoid making the same mistakes again. If you've been struggling in this market and are battered and bruised, come to Qingtian; I'm confident I can help you regain your confidence. In the cryptocurrency market, the beginning is hard work and methods, the middle is strategy and mindset, and the advanced is character and self-cultivation. You need to clear your mind of distractions, maintain a calm and focused mind, and overcome all human flaws to secure profits.
Wenjing is focusing on spot trading of Ethereum futures contracts; there are still spots available in the team, so hurry and join! #ETH走势分析 $BTC