
1. Key Zones Identified
🔵 Resistance Level (Upper Blue Zone)
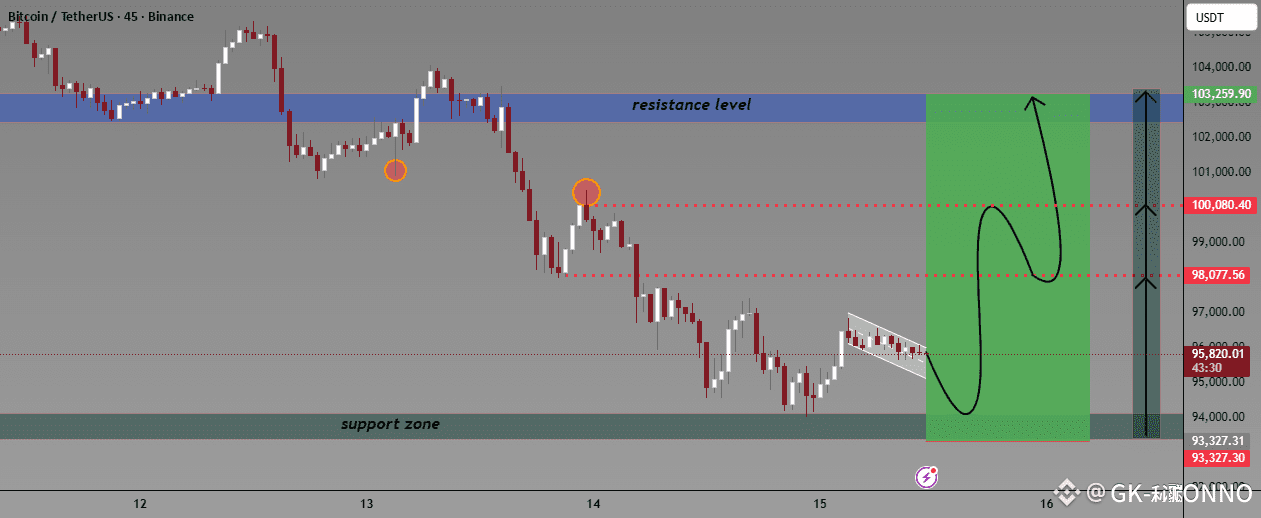
• Located around 102,500 – 103,300 USDT.
• Price has previously rejected this zone multiple times (as shown by your orange circles).
• It is the major upside target in your projected bullish scenario.
🟢 Support Zone (Lower Green Zone)
• Located around 93,300 – 93,800 USDT.
• This zone has acted as a strong demand area where price may bounce upward.
⸻
2. Current Market Structure
• The price recently made a sharp drop from resistance and is now consolidating.
• A small descending wedge or bullish flag is visible on the right side.
• These patterns usually indicate a potential breakout to the upside.
⸻
3. Expected Price Movement (Based on Chart’s Path Drawing)
Your chart suggests a bullish scenario:
1. Price might first dip slightly toward the support zone.
2. After touching support, a reversal bounce is expected.
3. Major targets on the way up:
• 98,077 USDT (first red dotted line – minor resistance)
• 100,080 USDT (second red dotted line – stronger resistance)
4. If these levels break, price is expected to move toward the 103,250 USDT resistance zone.
⸻
4. Summary of Technical Outlook
Bias: Bullish (after minor dip)
• Pattern: Falling wedge (bullish)
• Support: 93.3k–93.8k (strong zone)
• Near targets: 98k → 100k
• Main target: 103k (major resistance)
⸻
5. Overall Conclusion
The chart is forecasting a bullish recovery scenario, with a potential push up toward the 103k resistance after retesting support. The structure aligns with a typical reversal pattern following a downtrend.
✅ Trade here on $BTC
