The technical structure for Solana ($SOL ) on the 1-Hour chart is overwhelmingly bearish, confirming a strong continuation of the downtrend from its current price near 140 USDT. Buyers are showing little strength, and the path of least resistance is significantly lower.

1. ⬇️ High-Probability Prediction: Testing the Lows (80-90% Likely)
Based on the clear bearish continuation pattern, a further decline is the most probable next move. The primary target is to re-test the recent swing low, acting as a "price magnet."
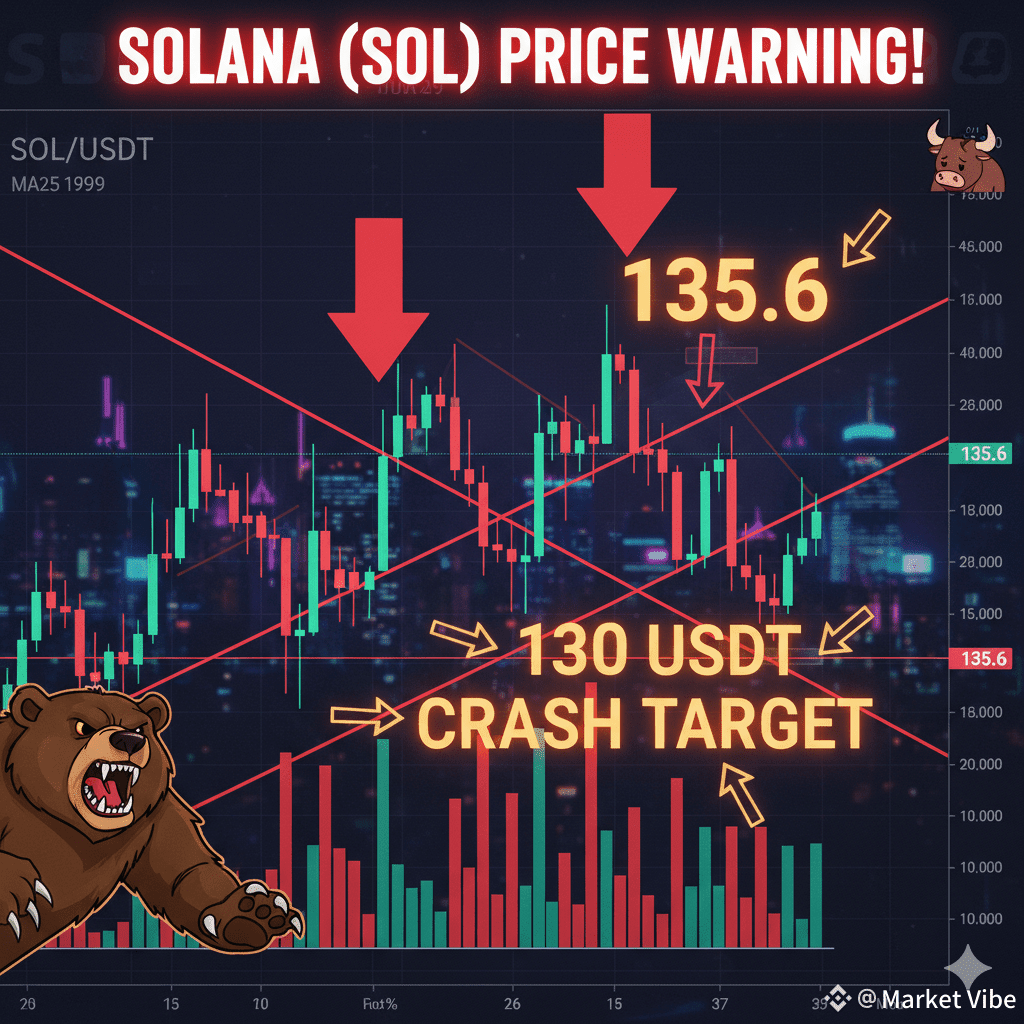
* Immediate Targets: \text{138} \rightarrow \text{136} \rightarrow \text{135.6 USDT} (The critical previous low).
* Major Downside Risk: If \text{135} breaks, the next major support target is \text{130 USDT}.
Why This Move is Highly Likely:
* Bearish Trend Confirmed: SOL is consistently forming lower-highs and lower-lows.
* Moving Averages (MAs): Price is trading below both the MA25 and MA99, and both MAs are sloping downward.
* Selling Pressure: Selling volume spikes are visibly larger than buying volume.
* Pattern: The price is contained within a textbook falling channel formation.
2. 🚀 The Unlikely Bullish Scenario (Only 20% Chance)
A significant upward move or trend reversal requires a clear break of established resistance levels to overcome the dominant selling pressure.
* Short-Term Bounce Confirmation: SOL must close and hold above the 150–152 USDT resistance zone. If this happens, a bounce toward \text{158} - \text{165} is possible.
* True Trend Reversal: The bearish trend is only truly broken if SOL breaks and holds above 170 USDT. Until then, any bounce is likely a "dead-cat bounce" (a temporary, weak rally in a bear market).
3. 🔑 Key Support & Resistance Zones
Understanding these levels is crucial for managing risk and setting targets.
| Zone | Level (USDT) | Strength/Role |
|---|---|---|
| Support | 140 | Weak |
| | 138 | Medium |
| | 135.6 | STRONG (Previous Major Low) |
| | 130 | MAJOR support target |
| | 125 | Extreme Support |
| Resistance | 145 | Weak |
| | 150–152 | Important Rejection Zone |
| | 160 | Mid Resistance |
| | 170 | Trend Reversal Zone |
4. 🧠 Deep Technical Insights
The current chart exhibits classic bearish continuation signals:
* Price Below MAs: Trading beneath both the MA25 and MA99 confirms the overall strong downtrend.
* Dominant Selling Volume: Large, frequent red volume bars indicate strong selling by "whales" or institutional traders, overwhelming retail buying attempts.
* Bearish Structure: The pattern of lower-highs and lower-lows is the definitive characteristic of a strong downtrend.
* Falling Channel: Price movement within this downward parallel channel suggests controlled selling is dominating the market action. The trend remains bearish until the channel is broken to the upside.
🎯 Final Summary: What to Expect Next
The evidence points overwhelmingly to a continuation of the bearish move:
* Most Likely: SOL targets 135.6 USDT.
* If 135 Breaks: Direct drop toward 130 USDT is expected.
* Caution: Any upward movement remains suspicious until a confirmed close above \text{150}-\text{152}.
* Safety: The long-term trend reversal is only confirmed above 170 USDT.
#MarketPullback #StablecoinLaw #GENIUSAct #PowellWatch