Core viewpoint
Current price: $3,152.74 (November 15, 9:44 AM)
Short-term outlook: cautiously bullish. Although the technicals show a bearish structure, the daily RSI is in the oversold area (34.13), combined with ongoing outflows from exchanges indicating whale accumulation. A rebound to the resistance level of $3,230 is expected in the short term.
Key support: $3,100 (major liquidation cluster location), $3,055 (4-hour Bollinger Bands lower band)
Key resistance: $3,194 (1-hour EMA26), $3,230 (short-term target), $3,333 (medium-term resistance)
Technical analysis
Multi-timeframe signals
1 hour: RSI 45.33 (neutral), MACD histogram turned positive (+4.48), showing early signs of momentum shift. Price is close to the middle band of the Bollinger Bands ($3,171.53), but still below key moving averages.
4-hour: RSI 37.41 (close to oversold), MACD bearish (Histogram -21.81). Price is compressing near the lower Bollinger Band ($3,055), indicating low volatility.
Daily: RSI 34.13 (oversold), MACD deeply bearish. Historically, ETH usually sees a 5-10% rebound when RSI is below 35.
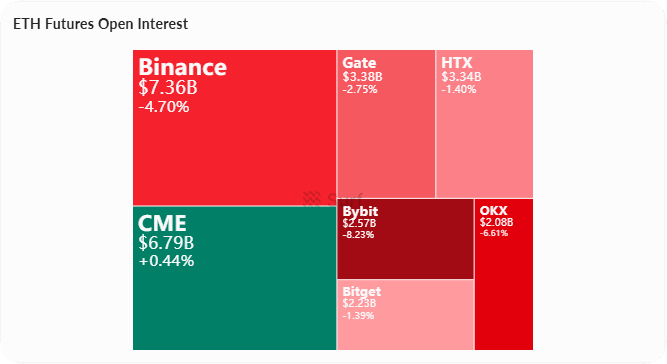
Derivatives Market Conditions
Total open interest is $36.39B, down 3.35% in 24 hours, indicating reduced leverage and weak trends. The funding rate is positive (0.005-0.01%), with longs paying shorts, showing overcrowding in longs.
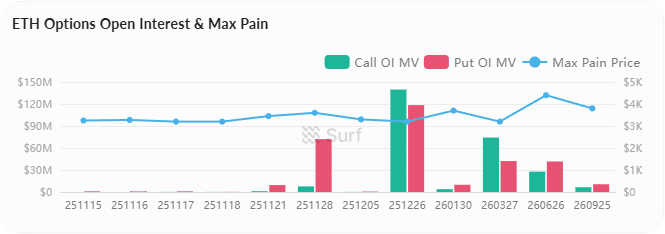
Total Options Open Interest $11.44B, down 3.82% in 24 hours. Recently, the largest pain point is at $3,200-3,250, creating a magnetic effect on price.
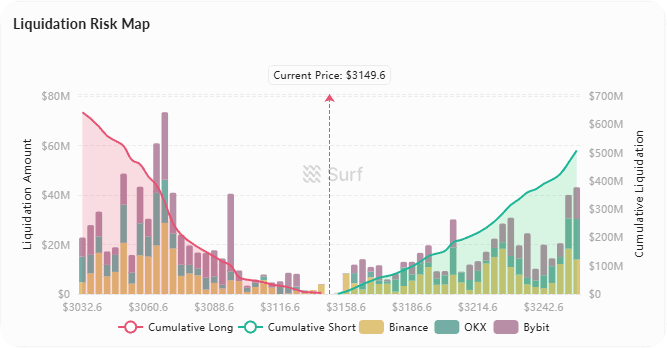
Liquidation Risk Analysis
Total liquidations in 24 hours are $204M, with long losses more severe ($145M vs $59M shorts). Important liquidation cluster:
Downside Risk: $3,100 near cumulative $643M long liquidations
Upside Resistance: $3,155 starts cumulative $508M short liquidations
Market Dynamics
Capital Flow
There has been a continuous net outflow of about 240k ETH over the past 7 days, with 83k ETH flowing out on November 14. Exchange reserves have dropped to 15.51M ETH (down 2.5% from October peak), indicating whales accumulating during price declines. coindesk
ETF Performance
The US spot ETH ETF has seen net outflows for the third consecutive day, with $259.72M flowing out on November 13. sosovalue cumulative outflows have reached $1.4B, with Grayscale and BlackRock leading the decline.
Important Events
On November 14, $730M ETH options expire, with the largest pain point at $3,475, increasing downside pressure. cryptopotato Implied volatility surged to 70-100%, the highest since October.
Social Sentiment
Overall sentiment leans towards cautiously optimistic, with bullish themes exceeding bearish views. The community views the recent decline as a buying opportunity, emphasizing 'buying the dip has been confirmed' and 'support levels are performing strongly'. x.com Influencers highlight technical setups like ETH/BTC 'Golden Cross' and bullish monthly closes after large-scale liquidations.
The Fear and Greed Index is 20 (Extreme Fear), indicating a possible approach to capitulation. x.com But whale activity has become a hot topic, with several large purchases (such as the $1.3 billion Satoshi era holders buying) interpreted as internal confidence.
Trading Strategy

Today's Key Observations
Breakthrough Confirmation: Closing above $3,194 (1-hour EMA) confirms the rebound
Support Test: Will the $3,100 liquidation cluster trigger a waterfall?
Funding Rate: Will it turn negative (bullish signal)?
Exchange Outflow: Will there continue to be >50k ETH outflow today?
Conclusion
ETH shows a bearish structure but oversold signals and on-chain accumulation point to a short-term intraday rebound to the $3,230 resistance level. If support fails, downside risk points to $3,055. Pay attention to the waterfall risk of the $3,100 liquidation cluster.


