📊 Core signal interpretation
K-line language
1 hour long upper shadow directly inserted 106670, clearly blocked after a rise
Although there are two consecutive daily bullish candles, the body is getting smaller and the bulls are losing strength
104265 is the key support, breaking it will test 103300
Indicators hide secrets
MACD: 1 hour shows a top divergence, short-term pullback pressure increases
RSI: 1 hour falls back from overbought area 70, daily 45 is still weak
Moving averages: although the 1-hour shows a bullish arrangement, the price is too far from the moving averages
The truth of trading volume
When pushing to 106670, the volume was 2711, funds are fleeing
Now the trading volume is shrinking, and the follow-up buying is insufficient
Daily trading volume plummeted by 67%, upward momentum exhausted
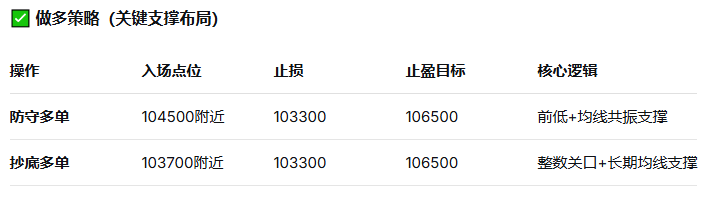
💰 Specific operational strategy
⚠️ Reminder from the experienced
Current rhythm
Retracement in an uptrend on the 1-hour level
Consolidation in the range of 107000-103700
Need to confirm support with a pullback before choosing a direction
Key position
Upper pressure: 106500 > 107000
Lower support: 104500 > 103700
Break line: 103300 (falling below turns bearish)
Position discipline
Single position ≤ 8%
Leverage ≤ 3 times, don't get carried away
If profit exceeds 3%, first reduce half of the position
Remember the mantra:
Be cautious of sharp rises and falls; key support should be re-evaluated
Divergence signals are not a joke; stop-losses must be set properly
(The market has risks; this article is only market analysis and does not constitute investment advice)#BTC走势分析 #BTC #ETH #ETH走势分析 #COTI
