Yello, Paradisers! Are we about to witness a major #XRPUSDT breakout, or is this just another fakeout? Let’s dive deep into the real setup on the #XRPUSD chart:
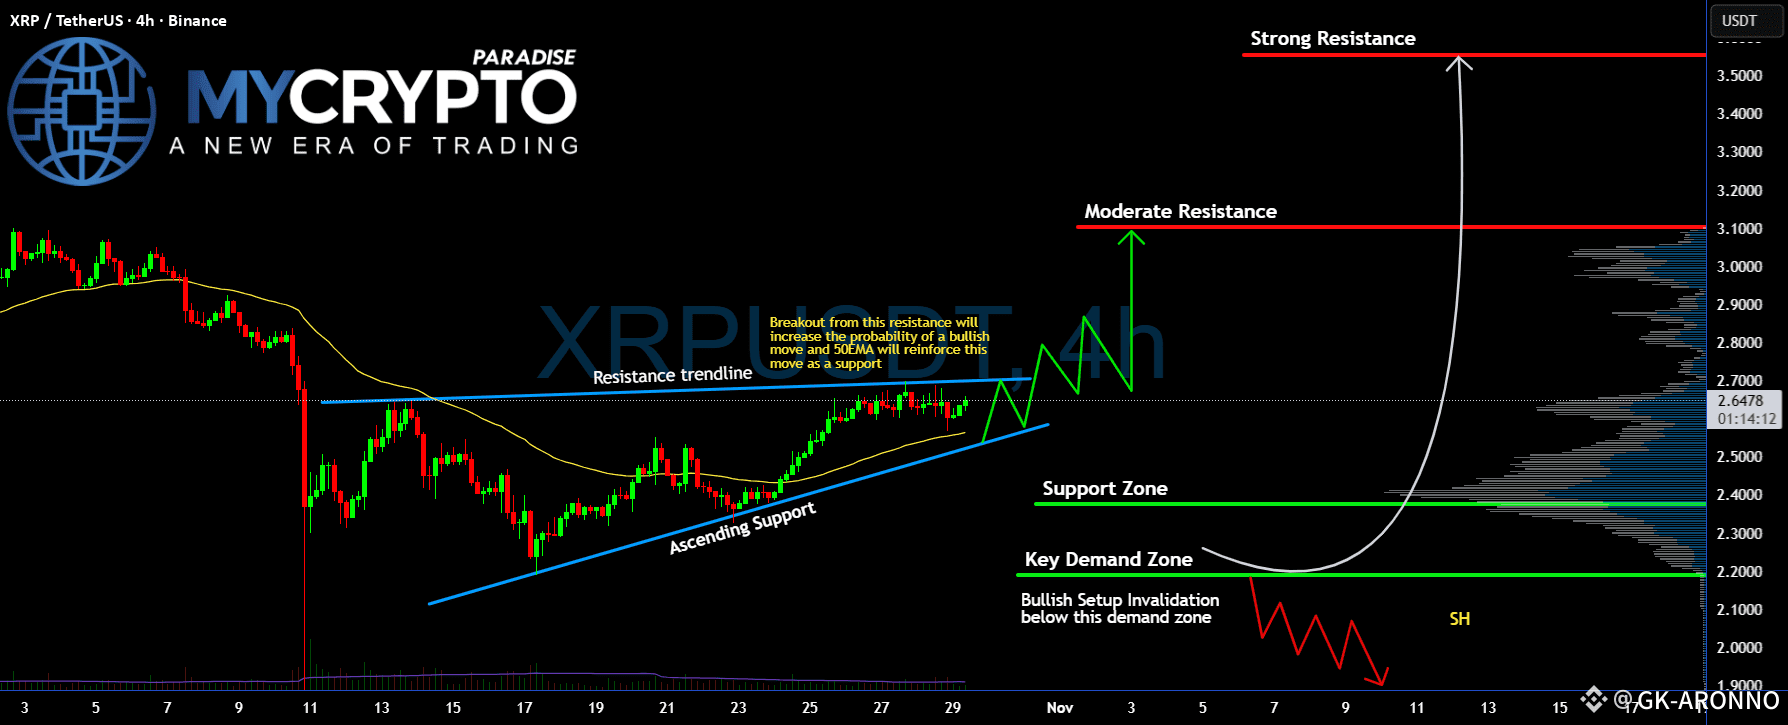
💎#XRP is currently trading around $2.65, consolidating right below a critical resistance trendline. What’s building here is a textbook ascending triangle, and the squeeze is tightening fast and moving toward an inevitable breakout.
💎A clean breakout above the resistance trendline, especially if backed by increased volume and 50EMA continuing to act as dynamic support, will significantly raise the odds of a sharp move up. The first bullish target lies at $3.10 (moderate resistance). If bulls dominate, a fast continuation toward the $3.55 strong resistance is very much on the table.
💎However, and this is key, any rejection near the resistance without solid momentum could trap breakout traders. If #Ripple drops below the ascending trendline and loses the Support Zone near $2.37, the move will likely extend into the Key Demand Zone at $2.19.
💎Below $2.19? That’s where the bullish setup gets invalidated. We would then expect a potential full breakdown, creating a cascade of stop-loss triggers and panic selling. That’s not a dip you want to buy blindly. Bulls still hold short-term momentum, but the next few candles will decide everything.
Strive for consistency, wait for clear confirmations, and remember that discipline always beats chasing quick profits.