What really changed my destiny was one day four years ago! From then on, I got back everything I had lost!
I compiled all my trading records and carefully reviewed them many times. I had mixed feelings and was deeply impressed. There were over 1,000 trading records in total, of which nearly 700 were losses and only over 300 were profits. Overall, the losses were large and the gains were small. Over 200 of them were major losses, so those years were generally losses. In fact, a big problem was obvious from looking at this trading record. My first reaction was greed. When I saw the big losses, I would recall the operations at that time. I was reluctant to sell when I had gains, and I was unwilling to stop losses when I lost. This was basically the reason for the big losses in the end.
Some small losses are mostly caused by unclear thinking, lack of confidence, operating on luck, insufficient research, and blindly entering the market. Over time, the losses add up. Ultimately, the entry point is not clear or firm enough. After reviewing, I found that the truly good entry point is the starting point of the stock price rise. Some unclear entry points are entered during period of range fluctuations. When the situation is unclear, the number of small losses increases, which makes it like boiling a frog in warm water. By the time I finally remember, it is too late to recover.
Afterwards, I summarized, reflected, listed the problems, and thought a lot. I really put all my thoughts into it. Later, I studied the techniques and practical knowledge carefully and summarized them into my own methods. Now I can use them easily!
I’m sharing this with my fans today, and I hope it will be helpful to you. If you find it useful, remember to like and save it!
Because I have been caught in the rain, I want to hold an umbrella for everyone.
I once lost 80% of my money and doubted my life, but I didn't give up. I kept getting back up after each setback, constantly learning from my experiences, and now I'm able to support my family through cryptocurrency trading. Today, I'm sharing five golden rules and three market tips. While brief, they're packed with valuable insights, so be sure to save them.
Rule 1:
Invest small amounts and avoid going all-in. The local dog market differs from mainstream markets in its high volatility, necessitating an "all-in" strategy. Unlike traditional investments, the risk of a project going bankrupt is extremely high, making small investments a rational choice. A key benefit of investing small amounts is that even if problems arise, losses can be contained. In the local dog market, maintaining sufficient reserves is crucial not only to protect principal but also to demonstrate awareness and respect for market risk.
Rule 2:
Act promptly and make decisive decisions. Opportunities in the local dog market are often fleeting, and excessive hesitation can lead to missed opportunities with high returns. Decisive action isn't about blindly following others; it's based on careful project evaluation and a keen understanding of market dynamics. You must be responsible for your own judgment in every decision, but you must also act quickly after making a choice to seize opportunities in an uncertain market.
Rule 3:
Double your profits and withdraw your principal, gradually cashing out the remaining balance in the local dog market. It's crucial to set a clear exit strategy and profit target. My consistent operating principle is to immediately withdraw your principal when a project doubles its value. This way, even if the market fluctuates later, the profit is locked in, preventing principal loss. Furthermore, if the project continues to rise, you can gradually sell off your shares and liquidate them in batches. This method not only guarantees a certain level of profit but also adapts to market uncertainty. I use the DEXX "double your principal" principle because the local dog market is prone to dramatic price fluctuations. If a project experiences a pullback, both the investor's principal and profits could be lost. Therefore, promptly withdrawing your principal after reaching a certain profit target is a key risk management measure. It's important to note that not all projects require long-term holding. Unless otherwise indicated, it's recommended to exit at the target profit level to ensure that profits are securely captured.
Rule 4:
Diversification reduces overall risk. In the risky BTC market, diversification is an effective strategy for avoiding concentrated risk. For example, if you plan to invest 500 USDT/10 SOL/1 ETH, consider spreading it across 10 projects, investing $50 in each. This way, even if one project fails, the overall impact on your funds will be minimal, allowing you to easily absorb the loss. Many projects in the BTC market carry the risk of going to zero, so diversification is a key measure to manage overall risk. Selecting projects across different industries and diversifying across different cryptocurrencies can further reduce the risk of a single project failing. Regardless of market conditions, diversification is always a wise way to navigate market fluctuations.
Rule 5:
Maintaining patience and taking your time is crucial in the local dog market. While opportunities abound in the cryptocurrency market, suitable opportunities don't always present themselves. Learning to wait and screen, and making prepared choices, is far more reliable than blindly following others. Many investors, driven by an unstable mindset, seek quick profits, only to ultimately lose everything due to impatience. Opportunities in the local dog market are indeed difficult to capture, but with patience, you can always find the right project. This approach allows you to maintain a clear investment perspective and avoid the "greed trap." Constantly remind yourself: the cryptocurrency market is full of "myths" of dramatic ups and downs, but these are often illusions driven by hype. Maintaining patience and composure is essential for success.
In addition to the above five rules, here are some experience suggestions for your reference. After long-term market observation and summary, I found the following points to be particularly important to avoid misunderstandings when operating.
1. Don’t buy at the bottom:
The nature of local dog market projects dictates that we shouldn't buy at the bottom easily, especially those that have experienced significant gains, as they often plummet to zero once they fall. Maintain a keen eye for trends and avoid buying at the bottom simply because prices are low, as this can introduce additional risks.
2. Familiar with the operation process:
Before engaging in market operations, it is recommended that every investor familiarize themselves with the process and avoid blindly following trends. Internal market operations, in particular, require greater caution due to their particularity.
3. Pay close attention to market trends:
Always monitor market trends and withdraw your principal at the appropriate time. You can take advantage of the "double your principal withdrawal" feature on some trading platforms to ensure the safety of your principal. Stories circulating in the market about people getting rich by using "diamond hands" are often manipulation by market makers and should not be taken in. In reality, market makers often adjust their strategies based on retail investor behavior. Therefore, investors must remain vigilant and avoid being easily fooled by stories of "making 1 million yuan by buying 100 yuan."
Every investor has their own unique approach, but if you choose to join our team, please adhere to my recommended approach. These five rules, a summary of market-tested experience, will help you navigate the local dog market more steadily. Ultimately, market operations require strict discipline and adherence to rules, not emotion. Correct operational thinking and unwavering execution are the keys to success.
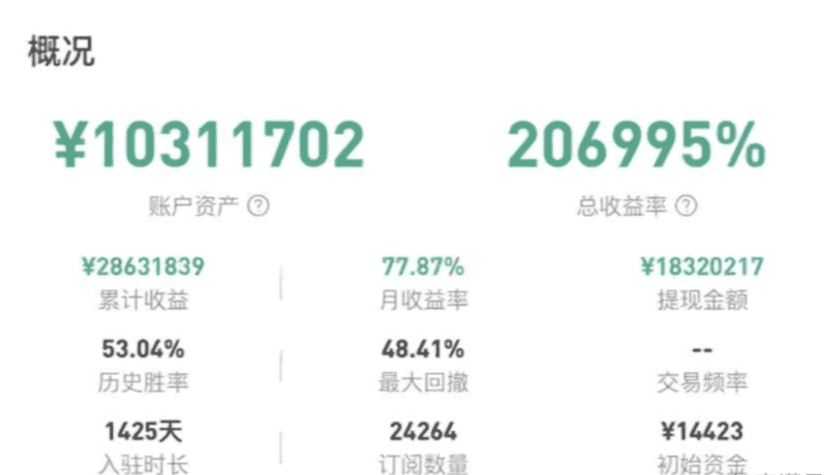
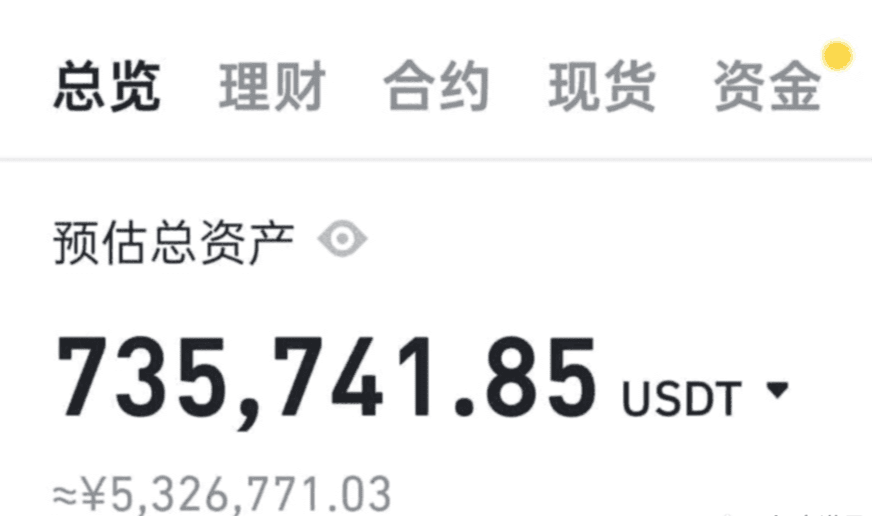
Methods I have personally tested: My method of cryptocurrency trading is very simple and practical. It took me only one year to make eight figures. I only trade in one pattern and enter the market when I see the right opportunity. I don’t trade without a pattern. I have maintained a winning rate of over 90% for five years!
Several commonly used technical indicators
1. Overview
This article is based on a new series of studies that show some of the key trends based on the RSI.
Trading techniques. Trading techniques are a way of using indicators. This study is based on the MQL5 coding language.
2. Introduction to RSI
RSI stands for Relative Strength Index, a technical analysis indicator used to measure the strength and momentum of a security such as a stock, currency, or commodity. The RSI is calculated using a mathematical formula and plotted on a chart to visually represent the strength or weakness of a security over a given period.
The RSI is based on the principle that as prices rise, securities become overbought, while as prices fall, they become oversold. The RSI helps traders identify potential trend reversals or price corrections.
The RSI calculation involves comparing a security's average gain over a given period with its average loss over the same period. The default version of the RSI is plotted on a scale of 0 to 100, with readings above 70 considered overbought and readings below 30 considered oversold. The RSI is a popular indicator among traders because it can provide early warning signs of potential market trends. For example, if a security's RSI consistently rises and reaches levels above 70, this may indicate that the security is overbought and should be adjusted. On the other hand, if the RSI consistently falls and reaches levels below 30, this may indicate that the security is oversold and is due for a rebound.
It's important to note that the RSI shouldn't be used alone as the sole basis for making trading decisions. Traders often use the RSI in conjunction with other technical analysis tools and market indicators to gain a more comprehensive understanding of market conditions and make informed trading decisions. Generally, the RSI is calculated using a 14-period period.
3. What is RSI (more in-depth description).
3.1 Overview
The Relative Strength Index (RSI) is a technical indicator used in financial market analysis. It charts the current and historical strength of a stock or market based on the closing prices of the most recent trading period. The indicator should not be confused with relative strength.
The RSI is classified as a momentum oscillator.
, which measures the speed and magnitude of price fluctuations. Momentum refers to the speed at which prices rise or fall. Relative strength (RS) is expressed as the ratio of higher closing prices to lower closing prices. Specifically, it averages the two absolute values of the changes in closing prices, or the sum of the two candlestick sizes in a candlestick chart. The RSI calculates momentum as the ratio of higher closing prices to the total closing price: stocks with more or stronger positive price changes have higher RSIs than stocks with more or stronger negative price changes.
The RSI is most commonly used over a 14-day timeframe, with a scale ranging from 0 to 100, with high and low levels marked at 70 and 30, respectively. Shorter or longer timeframes correspond to shorter or longer outlooks. High and low levels—80 and 20, or 90 and 10—occur less frequently but indicate stronger momentum.
The Relative Strength Index was developed by J. Welles Wilder and published in his 1978 book, New Concepts in Technical Trading Systems, and in the June 1978 issue of Commodities magazine (now Modern Trader). It has become one of the most popular oscillator indicators.
The RSI provides signals that tell investors to buy when a security or currency is oversold and to sell when it is overbought.
Marek and Šedivá (2017) tested the RSI with recommended parameters and its daily optimization and compared it with other strategies. The test was randomized across time and companies (e.g., Apple, ExxonMobil, IBM, Microsoft), showing that the RSI can still produce good results; however, over longer time frames, it is often outperformed by a simple buy and hold strategy.
3.2 Explanation
3.2.1 Basic Configuration
The RSI is displayed on a chart above or below the price chart. The indicator has an upper line typically at 70, a lower line at 30, and a dotted center line at 50. Wilder recommends a smoothing period of 14 (see exponential smoothing, i.e., α = 1/14 or N = 14).
3.2.2. Principles
Wilder believes that when prices rise rapidly, they are considered overbought at some point. Similarly, when prices fall rapidly, they are considered oversold at some point. In either case, Wilder believes a reaction or reversal is imminent.
The level of the RSI is a measure of a stock's recent trading strength. The slope of the RSI is proportional to the speed of the trend change. The distance the RSI travels is proportional to the magnitude of the move.
Wilder believes that tops and bottoms are indicated when the RSI is above 70 or drops below 30. Traditionally, RSI readings above 70 are considered to be in overbought territory, while RSI readings below 30 are considered to be in oversold territory. Levels between 30 and 70 are considered neutral, while levels above 50 indicate no trend.
Divergence
Wilder further believes that divergence between the RSI and price action is a very strong sign that a market turning point is approaching. A bearish divergence occurs when price makes a new high, but the RSI makes a lower high, thus failing to confirm it. A bullish divergence occurs when price makes a new low, but the RSI makes a higher low.
3.2.4. Overbought and Oversold Conditions
Wilder believes that "failure swings" in the RSI above and below 50 are strong signs of market reversals. For example, suppose the RSI reaches 76, falls back to 72, and then rises to 77. If it falls below 72, Wilder would consider this a "failure swing" above 70.
Finally, Wilder writes that chart formations and support and resistance areas are sometimes easier to see on an RSI chart than on a price chart. The centerline of the relative strength index is 50, which is often considered the indicator's support and resistance lines.
If the RSI is below 50, it generally means that the stock has seen more losses than gains. When the RSI is above 50, it generally means that gains have outweighed losses.
3.2.5. Uptrend and Downtrend
Apart from
In addition to Wilder's original theory on RSI interpretation, Andrew Cardwell also made some new interpretations of RSI to help identify and confirm trends. First, Cardwell noticed that uptrends are usually
RSI trades between 40 and 80, while downtrends typically trade between 60 and 20. Cardwell observed that when a security changes from an uptrend to a downtrend, or vice versa, the RSI will experience a "range transition."
Next, Cardwell noted that the bearish divergence
: 1) only occurs in an uptrend, 2) mostly results in a short correction rather than a trend reversal. Therefore, a bearish divergence is a signal that confirms an uptrend. Similarly, a bullish divergence
It is a signal confirming a downtrend.
3.2.6. Reversal
Finally, Cardwell discovered that there are both positive and negative reversals in the RSI. Reversals are the opposite of divergences. For example, a positive reversal occurs when an uptrend price correction results in lower lows compared to the previous price correction, but the RSI makes lower lows compared to the previous correction. A negative reversal occurs when a downtrend rally results in lower highs compared to the previous downtrend rally, but the RSI makes higher highs compared to the previous rally.
In other words, despite the RSI's higher highs or lower lows indicating stronger momentum, the price is unable to make higher highs or lower lows. This is evidence that the primary trend is about to resume. Cardwell points out that positive reversals only occur in uptrends, while negative reversals only appear in downtrends, so their presence confirms the trend.
4. RSI three steps deep
The three-step deep technique has an interesting premise, which states that usually whenever the RSI enters an oversold or overbought level and forms three consecutive deeper moves, and the fourth move is a confirmation (which must also be deeper), then a signal can be given. The trading conditions are as follows:
A bullish signal is detected whenever the RSI is below the previous RSI, which was also below its predecessor, which was also below its predecessor. Since it is often used with an 8-period RSI, the RSI must have been below 20 three periods ago and above 20 four periods ago (to avoid repeating signals).
A bearish signal is detected whenever the RSI is above the previous RSI, which in turn is above its previous RSI, which in turn is above its previous RSI. Since it is often used with an 8-period RSI, the RSI must have been above 80 three periods ago and below 80 four periods ago (to avoid repeating signals).
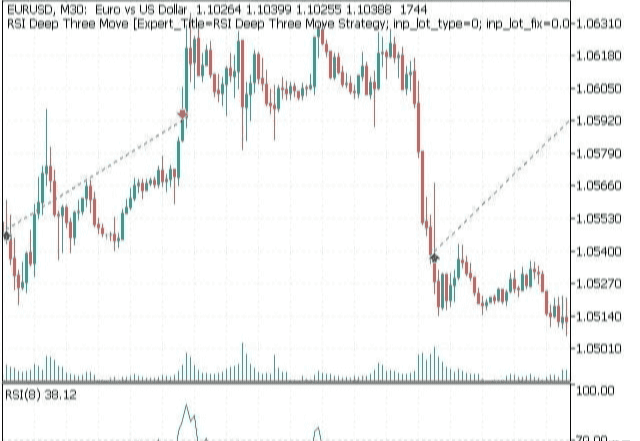
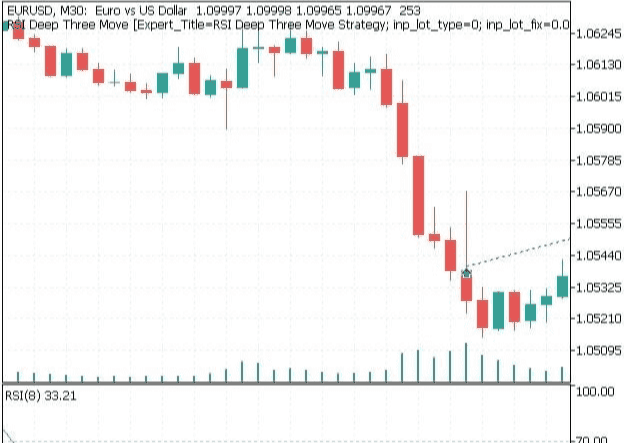
A picture is worth a thousand words, and the chart below shows a bullish signal based on this technique:
This code copies values from an indicator buffer into an array. The function takes five parameters: the indicator handle, the indicator buffer, the starting position in the buffer, the number of values to copy, and the array in which the values are stored. It then checks whether the array is dynamic. If so, it resets the error code and copies the values from the buffer into the array. If the copy fails, it prints an error message and returns false. Otherwise, it returns true.
This code is used to calculate the lot size for a trade. The first function, get_lot, takes the trade price as a parameter and checks the lot calculation type (fixed or risk-based).
If the lot type is fixed, call the normalize_lot function to normalize the lot size.
If the lot type is risk-based, the OrderCalcMargin function is used to calculate the margin required for the trade, and the AccountInfoDouble function is used to get the account balance.
The lot size is then calculated by dividing the account balance by the margin and multiplying by the risk percentage. The normalize_lot function is then called to normalize the lot size.
The normalize_lot function takes the lot size as an argument, calculates the step size and the minimum lot size for the symbol, then rounds the lot size to the nearest step size and applies the minimum lot size if necessary.
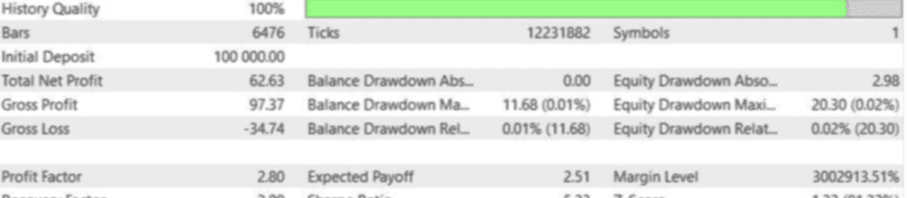
6. Results
From January 1, 2023 to the end of June, EURUSD 30-minute period with a sl of 900 pips (remember that the RSI uses 8 periods).
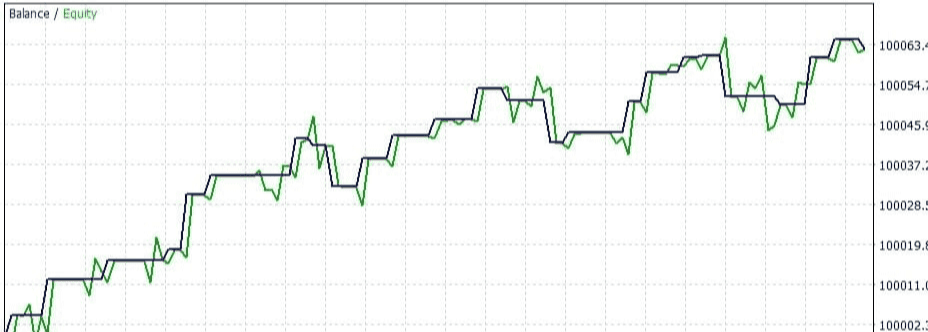
7. Conclusion
Of course, not all techniques are perfect. You are bound to encounter some false signals, especially during trends. As you may have noticed, during strong trends, this technique did not work as expected.
The strategy must be optimized before it can be applied to the markets, but the idea is to propose a mean-reversion way of thinking about market analysis.
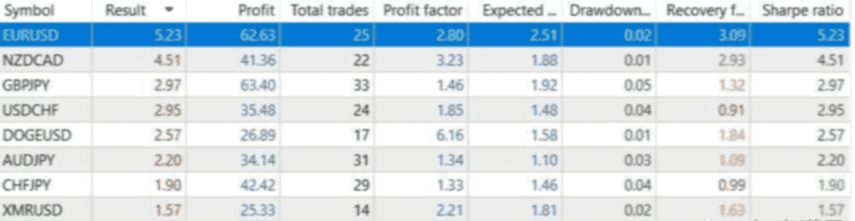
These are the profit results for all symbols on a cent account with my broker from 2023 to the end of June, with a timeframe of 30 minutes.
Summarize
I hope these 5 golden rules and 3 market suggestions can help you on your investment journey. Although the local dog market is full of opportunities, its high risks cannot be ignored.
Only by remaining cautious, controlling risks, and strictly observing discipline can we move forward steadily in this highly volatile market and seize the right opportunities.
Let us work together to find our own opportunities in the cryptocurrency market, avoid risks, and reap abundant profits together.
Lao Wang only does real trading, the team also has positions on the speed

A single tree cannot make a boat, and a single sail cannot sail far! In Erquan, if you don’t have a good circle and first-hand information about the cryptocurrency circle, then I suggest you follow Lao Wang, who will help you get ashore for free. Welcome to join the team!!!