📊 1. Price Forecast
Short term (1–3 days):
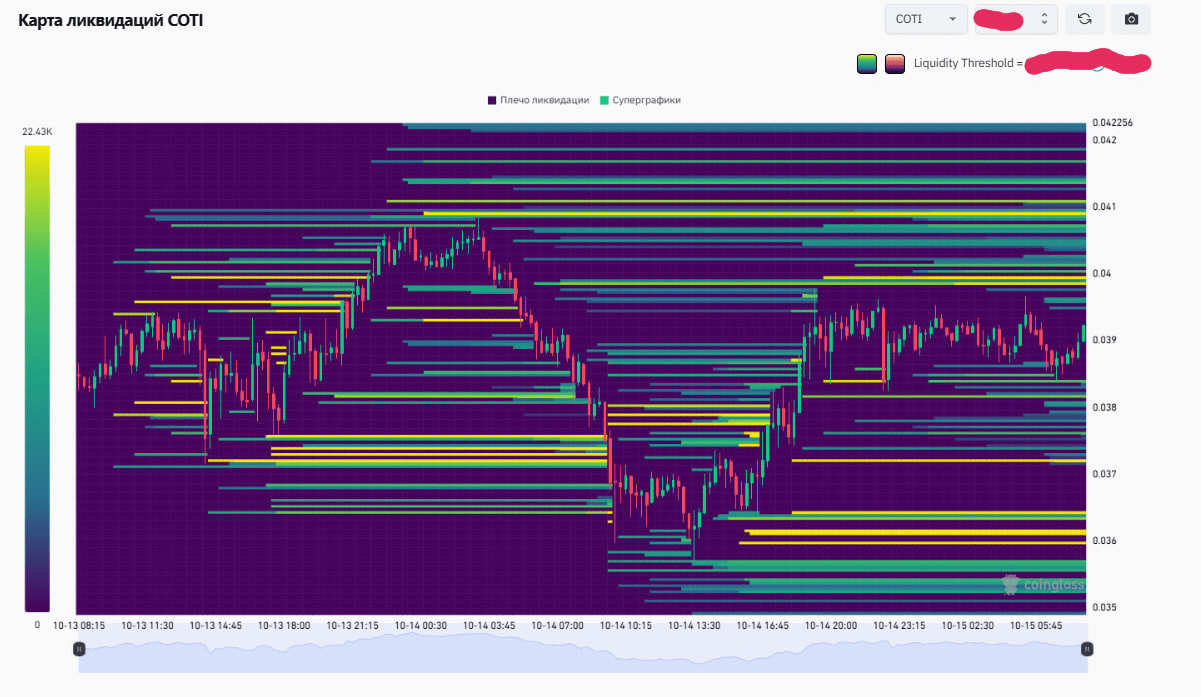
The liquidation map shows dense liquidity in the range 0.038–0.037, which is likely to be tested soon (local downward correction). Next — a rebound with targets of 0.0405–0.0418.
RSI (1h ~52.6, 4h ~46.8) indicates a neutral-weak bullish range — there is no oversold condition, but there is potential for growth.
➡️ Forecast: short-term correction to 0.0385 followed by recovery in the range of 0.041–0.042.
Medium term (5–10 days):
If volume is maintained and 0.037 is not broken down, a gradual rise to 0.043–0.045 is expected, where a large layer of liquidations is located (areas of interest for market makers).
⚙️ 2. Support and resistance levels
Level Type Comment
0.0367–0.0372 Support Strong liquidity zone, bounce likely
0.0385 Support Current holding zone for buyers
0.0408–0.0412 Resistance Clusters of long liquidations
0.0425–0.0435 Resistance Key level for medium-term breakout
📈 3. LONG position
Entry: 0.0387–0.0375 (on correction to support zone)
Take-Profit:
0.0405
0.042
0.0438
Stop-Loss: 0.0363 (below the lower liquidity boundary)
Leverage: x3–x5 (moderate, as the volatility range is limited)
🟢 Comment: entry from 0.0387 is optimal for a bounce within a short-term movement, probability of realization ~65%.
📉 4. SHORT position
Entry: 0.0415–0.0428 (near the upper liquid zone)
Take-Profit:
0.0398
0.0385
0.037
Stop-Loss: 0.0437
Leverage: x3
🔴 Comment: short is logical only with confirmation of a bounce from 0.0425; probability of realization around 40%.
📊 5. Scenarios with probabilities
Scenario Description Probability
🟢 LONG Correction to 0.038 → bounce to 0.041–0.042 65%
🔴 SHORT Test 0.042–0.043 → pullback to 0.038 35%
⚪️ Sideways Consolidation 0.038–0.041 without breakout 20% (included in overall percentages)
🧭 Summary
🔹 Optimal strategy: wait for a drop in the range of 0.0385–0.0375 and open a long with moderate leverage x3–x5, targets — 0.0418–0.0435.
🔹 Risk: breaking 0.036 will lead to a test of 0.0345, which will nullify the bullish scenario. 👉The trading strategy was created using ChatGPT (analysis of liquidation map + RSI)
➡️@INVESTIDEAUA : Intraday trading , LONG/SHORT strategies, SPOT, TRAINING (how to use ChatGPT to create trading strategies)
✨#ОбучениеТрейдингу #cryptotrading #CryptoStrategy #CryptoNews $COTI