Every morning I first send my child to school, then I come back and make breakfast for myself, and after eating it's about 9:00. I open the computer and summarize yesterday's transaction records into my trading system, looking for opportunities, like an ant moving its home, small amount T. I usually operate on more than ten cryptocurrency orders at the same time. I am generally busiest from 9:30 to 10:50 in the morning, and the afternoon is usually quieter with fewer trading opportunities. I can solve things on my phone, and if the trading is light, I won't stare at the computer, just take a break for my eyes.
In the afternoon, when I have nothing to do, I usually go to the park or the woods to run, then pick up my child after school, go home, and sometimes I cook dinner myself, sometimes I order takeout.
In the evening, I usually just make a few trades, with more time spent sharing and answering questions, as well as writing reviews! If trading is slow or there is a one-sided decline with few trading opportunities, I drive to the wild hills to fish. As long as there is a mobile signal, I can simultaneously trade on Binance while fishing, which is quite relaxing. In short, it’s all about freedom and comfort.

In cryptocurrency investments, maintaining the liquidity of your account, i.e., 'having coins in the market, money in the account, and cash in your pocket', is an important guarantee against market uncertainties. Never go all in, allocate funds reasonably, and master the principles of risk control. This not only enhances the stability of your investment mindset but also effectively controls risks. Investing with spare money instead of borrowed capital is the foundation of investing. Master basic operational skills and thinking, develop the habit of recording and summarizing, and treat the high and low point data of each operation as valuable experience, gradually cultivating the ability to filter information and make decisions.
In addition to solid techniques, I also adhere strictly to the following six iron rules: grasp the elements of successful investing!
As long as retail investors follow these six points, turning 100,000 into 5 million is not difficult. These six points may seem simple, but very few can truly achieve them. Here are the 'six iron rules' that guarantee success in the cryptocurrency space, helping you to navigate the market with ease!
1. Understand stop-loss and take-profit Trading cryptocurrencies is about making profits, not holding indefinitely. When a position moves against you, decisively sell to avoid unnecessary losses. In the cryptocurrency space, do not be greedy when making money and do not hesitate when facing losses.
2. Do not pursue absolute highs and lows The market always has lower lows and higher highs, which are difficult for ordinary people to precisely grasp. We only need to buy in the bottom areas and sell in the top areas, capturing the major trends.
3. Volume and price must perfectly match Low volume during an upward move or a new high with low volume often signals selling by the main force or exhaustion of the upward trend. Better to miss out than to chase after volume, to avoid becoming the one who picks up the tab.
4. React quickly When the market presents positive news, swiftly find related sectors and projects. If you miss the first tier, timely position yourself in the second tier, and you can still achieve good returns.
5. Learn to rest The main upward wave of cryptocurrency prices is short-lived, while the remaining time is mostly volatile or retracing. Seize the main upward wave and learn to rest during other times to avoid losses from frequent trading.
6. A sharp drop is the biggest benefit Market crashes often bear greater opportunities. When others are greedy, be fearful; when others are fearful, be greedy. When the market crashes, do not panic. Choose quality assets to build positions in time and wait for a rebound.
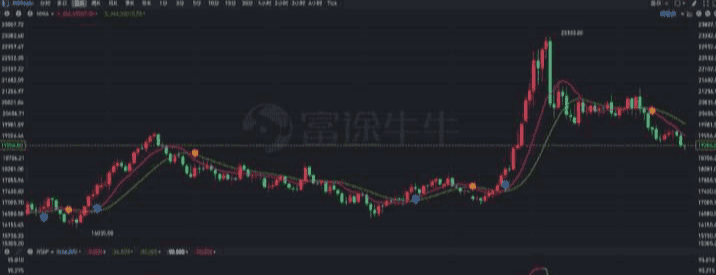
The large coin is skyrocketing, bringing several previous trading strategies to life. The simplest and most intuitive might be this so-called MACD trading strategy from semi-god, claiming to yield four hundred times in a year.
In fact, it is quite simple, it just involves looking for opportunities where MACD shows continuous divergence.
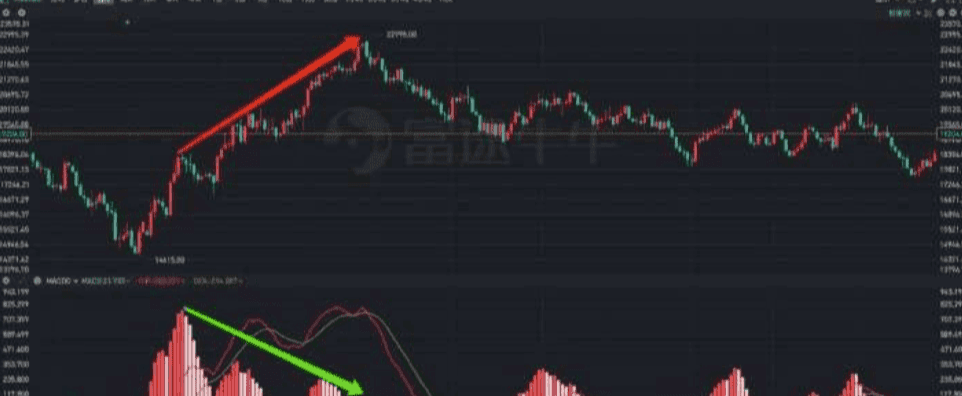
The above image is a good example, fully illustrating the two core points of this trading strategy: continuity and divergence.
What counts as continuous?
MACD is above the zero line, and after a peak appears, it does not drop below the zero line before rising again to show another peak, or it drops below the zero line and quickly crosses again to show a peak; this is what is known as continuity.
What counts as divergence?
The peaks of MACD are gradually decreasing, but the stock price is gradually rising, which means that the trends of MACD and stock prices are inconsistent; this is what is known as divergence.
Of course, inconsistent trends can be divided into two situations: when indicators drop while stock prices rise, it is a top divergence; when indicators rise while stock prices fall, it is a bottom divergence.
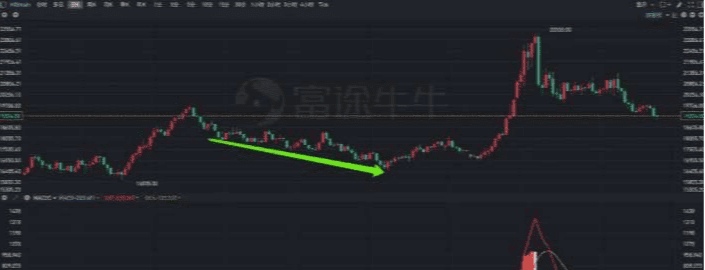
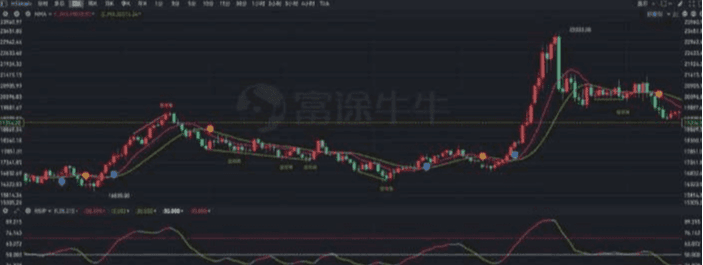
The above figure is an example of a top divergence. Similarly, in the Hang Seng Index, a bottom divergence had already appeared before the market started at 924.
The semi-god trading strategy aims to find opportunities for continuous divergences in the MACD indicator.
First, modify the first two default parameters of the MACD from 12 and 26 to 13 and 34, and then look for consecutive divergences with significant differences between peaks and troughs. Short when there is a top divergence, go long on a bottom divergence, and then use the ATR with a parameter of 13 for stop-loss.
Causes of divergence
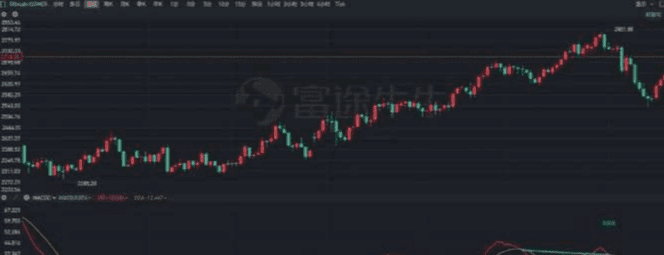
From the above two screenshots, it is evident that going short on a top divergence and going long on a bottom divergence are indeed excellent opportunities. Everyone can test this strategy on the assets they are interested in to see if it can capture some significant opportunities.
In this process, two issues may arise: first, the MACD indicator built into the platform only has fast and slow lines and bar charts, and does not include divergence recognition, making it very inconvenient to verify the validity of divergence signals when backtesting historical data; second, after backtesting, it is likely to find that divergence signals are very effective, but bottom divergences are generally more effective than top divergences.
How to solve the problem of identifying divergence signals, we will discuss later. Now, let’s analyze the causes of divergence and why bottom divergence signals tend to be more effective. #Elon Musk plans to establish the American Party
First, we need to take a look at the code for the MACD indicator and analyze the logic behind its construction.
DIF: EMA(C, 12) - EMA(C, 26), COLORRED;
That's right, the original MACD indicator is that simple; achieving the so-called 'king of technical indicators' MACD only requires three lines of code.
In the first line, the difference between two moving averages of different time periods calculated based on closing prices is displayed as a curve;
In the second line, calculate the average of the difference between the two moving averages from the previous step and display it as a curve;
In the third line, the difference between the two is magnified and displayed as a bar chart.
Thus, even if we have not studied the design principles of the MACD indicator, we can analyze the causes of divergence based on its code.
If a top divergence occurs, meaning that the peaks of MACD are decreasing while the stock price is rising and hitting new highs, this indicates that the value of MACD is decreasing.
The value of MACD is derived from the difference between DIF and DEA, indicating that the gap between DIF and DEA is narrowing.
DEA is the average of DIF, indicating that DIF is gradually decreasing or the growth rate is slowing down. Meanwhile, due to the smoothing effect of DEA, when DIF's growth rate narrows, DEA may still be rising, which causes the difference between the two to narrow or even reverse.
DIF is the difference between two moving averages of different periods. A gradual narrowing of DIF or a slowing growth rate indicates that the difference between the two moving averages is also narrowing. The short-term moving average is sensitive, and the long-term moving average is smooth, so when the difference narrows, it can be seen as the slope of the short-term moving average starting to approach the slope of the long-term moving average.
The slopes of short-term and long-term moving averages are starting to converge, which could be for two reasons: either the stock price has dropped or the growth rate has slowed. The condition for a top divergence is that the stock price is still rising and hitting new highs, so the narrowing difference actually indicates that the growth rate is decreasing, meaning stagnation has occurred.
The same derivation process can conclude that the cause of the bottom divergence is a stagnation in the decline, where it stops falling.
After a long period of stagnation, once a trend occurs, it is difficult to reverse. After a top divergence, some profit-taking funds may cash out, but those who initially did not believe it are now gradually entering the market. Although momentum has weakened, the trend remains, and there can be top divergences after top divergences, leading to potentially higher peaks.
Similarly, after a bottom divergence appears, there may also be lower lows. However, compared to upward movements, downward movements are often short-lived and large in magnitude, especially after several rounds of panic selling, people become numb to negative news, and at this point, the remaining participants are mostly steadfast holders. Coupled with the psychological advantage of buying at low levels, this often triggers a strong rebound, making the bottom divergence signal easier to realize.
Identify divergence
If the stock price hits a new high while the indicator does not, it is a top divergence, indicating that the strength of the bullish trend is weakening and the market may experience a top reversal; if the stock price hits a new low while the indicator does not, it is a bottom divergence, indicating that the strength of the bearish trend is weakening and the market may experience a bottom reversal.
Since this indicates a 'possible reversal', it shows that this is a left-side trade. If the trading involves contracts, it is understandable why the semi-god can achieve such high returns based on this strategy.
Of course, since this is a left-side trade, it is possible to have situations where 'there are tops within tops, bottoms within bottoms, and divergences followed by divergences'. Therefore, in the semi-god trading strategy, ATR-based stop-loss is specifically added to avoid the risk of trading contracts against the strong trend, leading to a return to zero or even liquidation.
With both entry signals and stop-loss rules, logically, this is a relatively complete trading strategy. But the problem is, if one relies on the naked eye to identify continuous MACD divergences, the efficiency is likely to be very poor.
Although there are relevant indicators in TradingView to assist with trading, in domestic trading software, there are few tools of this toolbox nature. Most just have a cool name, giving the illusion that one can make money simply by trading according to indicator signals.
However, we all know that for different markets, different assets, and different times, the trading signals generated must be treated differently.
In a strong trending market, the KDJ indicator may remain in the overbought and oversold range; in a volatile market, moving average indicators may frequently exhibit golden crosses and dead crosses. If you completely rely on a single signal, you may find that after a period, you might lose everything.
Therefore, technical indicators should actually be viewed as auxiliary tools, primarily aimed at improving efficiency. For instance, for MACD continuous divergence, if we can use technical indicators to achieve automatic recognition of this pattern, it can help us better seize such opportunities.
There are three key points in identifying divergence: triggering mechanism, time range, and judgment method. In previous articles, we introduced a simple method for identifying divergence through MACD’s color change and divergence.
This identification method is very simple, using the golden cross and dead cross of MACD as the triggering mechanism, with two golden crosses/dead crosses as the time range, and then judging whether divergence has occurred based on the trends of DIF and stock prices at the time of the golden cross and dead cross.
This is actually a form of opportunistic speculation; for general situations, it can barely be used, but it is clearly inappropriate to identify signals based on the semi-god trading strategy.
For example, a consecutive top divergence refers to several gradually decreasing peaks, and there is no retracement to below the zero line between the peaks, or even if there is a retracement, it is only a few bars.
Therefore, its triggering mechanism is to first find the peaks, then look back to see where the last peak was, whether there are any parts below the zero line between the two peaks, and if so, check whether the number of bars below the zero line exceeds the threshold. Finally, determine whether the two peaks are decreasing while the corresponding stock price is still rising.
Similarly, continuous bottom divergence requires first identifying the troughs, then looking back to the last trough to see if there are any parts above the zero line between the two troughs, and if so, checking whether the number of bars above the zero line exceeds the threshold. Finally, determine whether the two troughs are rising while the corresponding stock price is still falling.
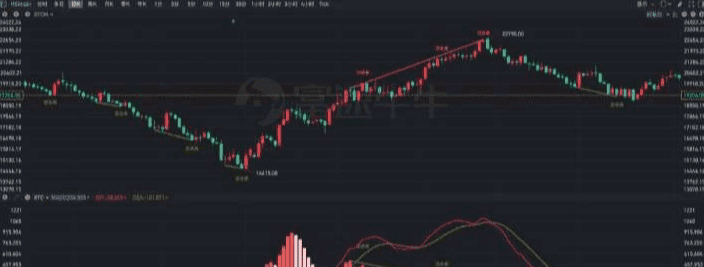
Comparing with the screenshots provided at the beginning of the article, we no longer need to manually draw lines to assess whether continuous divergences have occurred. Through custom technical indicators, we can identify whether MACD has diverged and connect peaks and troughs on the sub-chart, and on the main chart, connect the highest or lowest prices corresponding to MACD's peaks and troughs, allowing for easy identification of divergences.
Of course, since this is a custom indicator, the conditions for continuous divergences can be set according to personal preferences. For example, how many consecutive peaks and troughs should appear, the number of bars below the zero line between peaks, and how much difference is needed between consecutive peaks and troughs; these can all be adjusted.
Identify trends
Trading strategies based on divergence will enter the market when the trend has not yet been fully confirmed, exhibiting the characteristic of left-side trading. Therefore, ATR-based stop-loss is indispensable as an important component of the semi-god trading strategy.
However, we can completely combine other technical indicators to further reduce the potential risks associated with left-side trading. MACD measures the strength of a trend, and the trend itself can naturally be measured using moving average indicators.
Generally speaking, most people identify trends based on the crossover of two short-term and long-term moving averages. However, there is a significant issue here: if the two time parameters are too close, the two moving averages may cross frequently, leading to a large number of invalid signals; if the two time parameters differ too much, the timing of entry and exit will lag severely.
Therefore, we can adopt this approach: choose a personal preferred time parameter and then choose different moving average algorithms to obtain the fast and slow lines.
For example, we first calculate MA10 using the closing price, and then calculate EMA10 of MA10, thus mimicking the calculation principle of DIF and DEA to obtain two fast and slow lines, and then formulate buy and sell signals based on the crossover of these two lines.
Of course, compared to traditional double moving averages, although there is only one time parameter, there are still issues of filtering out invalid signals.
The market is mostly in a state of volatility, so we can use whether the market is overbought or oversold as a filter for moving average crossover signals.
For example, when the two moving averages form a golden cross, if the RSI indicator's value is between 50-70 (above 70 is considered severely overbought, do not chase high) and is rising, it is considered an effective long signal; when the two moving averages form a dead cross, if the RSI indicator's value is between 30-50 (below 30 is considered severely oversold, do not chase low) and is falling, it is considered an effective short signal.
At the same time, further restrictions can be placed on the candlesticks, requiring that the lowest price is above the fast line when going long, and the highest price is below the fast line when going short. In this way, the effect shown in the following image can be achieved.
Optimization and iteration
Thus, we have constructed a trading strategy using moving averages, RSI/KDJ, and MACD, which are the most basic technical indicators.
For those who are very patient and can trade contracts, options, and futures, seeking a high win rate, they can patiently wait for the appearance of continuous MACD divergence signals. Other traders can do some short-term trading based on moving average crossover + RSI filtered signals.
Moreover, the beginning of a market trend will inevitably trigger a crossover of the two moving averages, while the end of a market trend often forms a MACD divergence.
Therefore, by combining them, after making long and short trades based on the moving average crossover signals, you can use divergence signals to observe when to take profits; and after entering the market on the left side of the divergence signal, you can then confirm on the right side through the moving average crossover signal.
Thus, this is actually a complementary system, where there is still significant room for improvement regarding signal prioritization, compatibility of short and long-term trading, historical data backtesting, and parameter tuning.
We welcome all cryptocurrency friends to provide more feedback while using the indicators, so we can make further optimizations and iterations.
The current market is indeed in a bottom-building phase. If you lack direction, remember to follow my lead, standing on the shoulders of giants can save you ten years of detours!
Old Ma only does real-time trading, and the team still has positions available. Speed up to #加密市场回调 .


