With over 10 years of cryptocurrency trading experience, spending 3 years, over 1000 days and nights, and verifying through tens of thousands of trades, this method has a win rate of up to 90%
Also tested by Mu Qing: with a principal of 80,000, this method of trading cryptocurrencies made over 10 million!
Cryptocurrency market manipulation strategy violently breaks through "volume-price explosion + on-chain anomalies, targeting the market makers’ weak points! Sudden spikes in the early morning, fully decrypting candlestick language—stay close to whale wallets and capture 50% of the wave!
Basic concept of market manipulation strategies in the cryptocurrency circle
Difference between cryptocurrency and stocks:
There is no difference in nature, including foreign exchange, futures, gold and silver, precious metals, stocks, and virtual currencies; they are all the same, and ultimately, it is a game of capital. Capital needs to control the market, raise funds, and harvest profits, which requires a platform where participants willingly get harvested, so these platforms have emerged accordingly.
Just like every time you buy a lottery ticket, you always feel you'll win. Luck is an instinctive human nature that every normal person possesses. On these platforms, you're the protagonist, free to display your greed, fear, luck, madness, and numbness. No one questions you, no one cares. It's entirely up to you. Buying and selling is a matter of whim. At the moment you place an order, you're unconstrained by reality. In this world, you've finally found a sense of unrestricted transcendence, so you're willing to accept the consequences while being exploited.
Formally speaking, each country has its own stock market regulations, which are tied to ethnic and national culture. Chinese people value harmony over extremes, so stocks can only rise 10 points per day—neither more nor less. This is known as the circuit breaker mechanism. Forex, futures, and cryptocurrency platforms are open, and these open platforms are often dominated by developed countries. Therefore, the favorable interest rate spreads of these platforms are often closely tied to the United States.
It can be said that it is state-owned enterprise capital that is manipulating the domestic A-share market, while it is American capital that is manipulating the currency circle.
Let's be clear: the emergence of a capitalist game must have a purpose: to make money. The scale of this money-making is no less than that of a world war sparked by primitive accumulation. Sheep eating humans simply become the sheep being eaten. World wars are resource plundering, and so are capital games! So don't think you're a child of destiny, that you can make a hundredfold profit by entering the cryptocurrency world, reach the pinnacle of life, and marry a beautiful, wealthy woman. We all live under the control of capital. Think carefully, is this idea your own? Or is it just a dream created by capital? It's a dream that invites you to come. If you do come, sorry, the money in your pocket no longer belongs to you. It's that simple.
Four words: zero-sum game. It does not create any wealth, but it can redistribute wealth from your pocket to my pocket. The overall wealth has not increased, but your money is gone.
The basic logic of the cryptocurrency market manipulation strategy
How can I make money in the stock market or cryptocurrency?
Let’s clarify two concepts: market makers and retail investors.
To put it bluntly, stocks or virtual currencies are just a game played by market makers using price fluctuations to manipulate retail investors.
Some people say, "I know the dealer." So what? The dealer says, "I'm right here." So what? Do you have a bigger team than the dealer? Do you have more money than the dealer? Do you have more information than the dealer? You have nothing, so what's the point of knowing about the dealer?
What we really need to understand is not concepts or news. The false and empty news we face every day is like a rope that pulls you to the south and makes you forget about the north.
What you really need to know is the data, the dealer's data.
How to interpret market makers' data? Whether it's stocks, foreign exchange, or the cryptocurrency market, the most infallible factor is volume.
Volume price difference = money = money invested by the dealer!
If you know how much money the dealer has invested in a currency pair, at what cost, and how much profit the dealer intends to make, then you can relax and enjoy the benefits, and then walk away with the money.
It is easier said than done.
The difficulty lies in being manipulated by the candlestick chart before you, running away when you should have held on, or entering when you should have run. Often, you'll regret it later: "If only I hadn't sold, if only I hadn't acted impulsively, I wouldn't have been trapped. I said this would go up, and you were bullish, right? I said this would fall, and you were so bullish." But if it happened again, you'd still choose to act impulsively and regret it again. Hindsight is meaningless! It only adds to your emotional drain.
The most fundamental reason is that you are not sure. Why? Because you don’t understand the most basic logic.
What is logic? For example, what is the complete logic of life? Birth, adolescence, youth, prime age, and old age. This is the complete logic of life.
So what's the logic behind a coin? Rising and falling? Seeing this, you might say, "Nonsense, I know that too." The key here is the milestones: Three-year-olds should start kindergarten, 20-year-olds should get married, and 60-year-olds should retire. These are milestones. If a child turns three, you know: Oh, this child is going to kindergarten. Similarly, if you see a K-line chart reaching a rising milestone, you know it's time to buy in without hesitation.
The rise and fall of a stock can be broken down into four stages: accumulation, wash-out, pull-up, and distribution. Understanding the accumulation stage is half the battle. This, at the very least, will ensure you avoid losses.
The K-line Basics of Cryptocurrency Market Strategy
Let's discuss the banker's actions separately. To have a correct understanding, you need a comprehensive foundation. Just as a towering building starts from the ground, without a foundation, your logic has no support points, cannot be grounded, and therefore cannot be executed. Let's start with the simplest candlestick chart.
What is a K-line? A K-line chart is a price chart recorded over a specific period of time. Examples include daily, weekly, and monthly K-lines. Shorter periods include hourly and minute K-lines. A K-line chart has four main elements: the highest price, the lowest price, the opening price, and the closing price.
Taking daily K as an example, concentrating the price fluctuations of one day on one line is daily K.
Opening price: the price at midnight of the day.
Closing price: the price at 24:00 on the day.
Highest Price: The highest price reached during a day.
Lowest Price: The lowest price reached during the day.
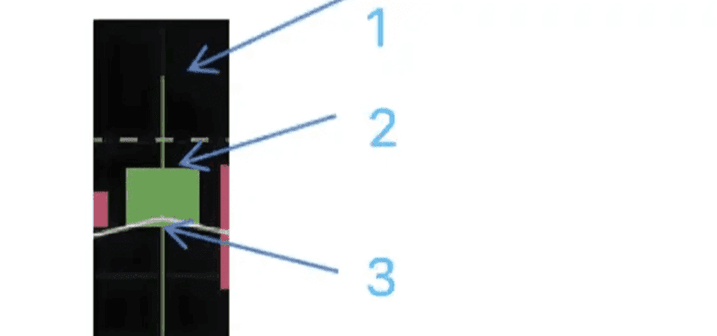
1 is the highest price, 4 is the lowest price, 2 is the opening price, and 3 is the closing price. The line between 1 and 2 is called the upper shadow, and the line between 3 and 4 is called the lower shadow. These four elements can be used to generate various candlestick patterns, such as dojis, long black candlesticks, long white candlesticks, hammers, and inverted hammers.
These special K-line graphics often have different meanings in different positions.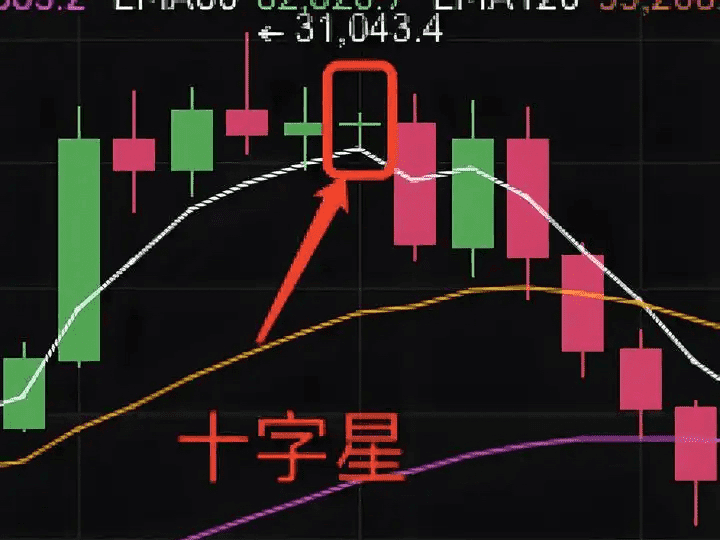
To understand the meaning of a doji, we must analyze its formation logic. A doji occurs when the closing price is nearly identical to the opening price. This signifies little price fluctuation during the day. Why? Market sentiment is hesitant or cautious about the price, and market makers are quietly distributing or absorbing shares to avoid significant volatility. This is more intuitive when combined with trading volume, indicating a likely direction. Generally speaking, the appearance of a doji after a period of price growth signals a decline. However, after a period of sideways trading, the appearance of a doji is often a sign of an upward trend.
Hammer head, inverted hammer head:
The hammer pattern forms when the market maker distributes chips to retail investors, causing a rapid price drop. To prevent a complete price collapse, the market maker gradually pulls the price back up while distributing chips. This upward movement also attracts retail investors to follow suit, further facilitating the distribution. At the end, a hammer pattern forms, exerting strong pressure on future prices. Similarly, an inverted hammer pattern also functions to distribute chips, opening high to lure more buyers, and then falling back after the distribution. Generally speaking, the appearance of this pattern after a period of price growth indicates that the market maker is distributing chips, representing a sell-off signal. Once the market maker completes the distribution, the price will plummet, creating a risk of being trapped. Conversely, the same principle applies at the bottom. Often, after a period of sideways price consolidation, the appearance of an inverted hammer pattern indicates that the market maker is absorbing chips, a follow-up signal. Buying at this time and holding on can often yield good returns.
Dayang
After the dealer has washed the market for a period of time, a big Yang line will appear. If the previous wash is sufficient, it is for the real purpose of pulling up the price, and the purpose is to make retail investors miss out. If the previous wash is not sufficient, and a big Yang line suddenly appears, there will often be a big Yin line the next day. The purpose is to wash the market. If you panic and sell, then your chips will be mine, and you can only watch when I pull up the price again. In fact, if retail investors don’t care about the price and buy crazily, once this happens, the dealer will wash the market again and hang the retail investors who chased in on the flagpole. Therefore, the appearance of the big Yang is the charge horn played by the dealer. You can choose to enter the position when the big Yang line retreats. If the price drops sharply after entering the position, it is a signal of washing the market. The right amount of replenishment can lower the cost, and the time period for washing the market again will be greatly shortened, so you can wait for the end of the wash and wait for the profit. The opposite is true for the big Yin line.
Big Yin
There are two situations in which this occurs. One is a false dip, aimed at scaring off undecided retail investors and acquiring these chips to accumulate funds and prepare for a subsequent rally. The other is a true dip, which often occurs after the dealer has distributed all the chips at the top. Without the support of the main force, the price plummets. The panic caused by the decline causes retail investors to flee, further exacerbating the formation of a large black candlestick. This large black candlestick has lost the participation of the main force and is the result of mutual infighting among retail investors.
In short, the judgment of the K-line shape should be combined with the current stage, whether it is consolidating or rising, distributing or collapsing, and it often has different meanings at different stages.
Then the question is, how to determine which stage the current K-line is in?
The Curse of Retail Investors in Cryptocurrency Markets
About the curse that the price goes down when you buy and goes up when you sell.
Think about this from another angle and you'll understand. It's a simple truth. If I were the market maker, I'd nurtured such a large team and invested so much money. My goal was to make money from you, not to help you make money. This is the most crucial point. All my actions revolve around this principle. I've painstakingly lurked for months or even a year, secretly collecting bottom-tier stocks. Why would I want to help you soar? So, I must kick you off the train before the price rises. How? By purging the market!
After lurking for a while, I acquired enough chips—enough to control the market. From then on, the fate of the entire K-line chart was completely in my hands. Controlling the K-line was like holding the hearts of retail investors. The K-line was a rope, and the retail investors were sheep, to be toyed with wherever I led them. You claim you won't be easily deceived, but you overestimate yourself. As long as you have any humanity, as long as you have desires, you won't be able to maintain a calm mind. Emotions fluctuate in a moment, and buying and selling actions take only a second. You won't have time to notice that your emotions are being manipulated. By the time you realize all this, you've already completed your buying and selling, and that's exactly what I want you to do.
When you think a coin is going to rise, others will too—most people will. So, not only you buy in, but everyone else does too. With everyone in, how can the price still rise? If it rises, and you all run away with your profits, who will buy in? So, once everyone buys in, I'll clean the market until there are no more undecided investors left. Unless you uninstall the platform after buying, I really can't do anything about it. But how many people can do that?
On the contrary, when no one thinks the coin will rise, no retail investors are flocking in, and the previous retail investors have almost washed out, then I will start to rise, and directly pull up a big bullish candlestick. You can chase it or not. If you chase too much, I will repeat the wash-out action again. If you don’t chase it? Then why don’t I continue to rise, and you will miss out successfully.
Therefore, it is inevitable that the price will fall as soon as you buy and rise as soon as you sell. This is a result caused by the actions of the vast majority of retail investors. This is a dynamic orientation.
As long as you are in the "majority," you will fall under this curse. How to be a minority? The bankers hunt the retail investors, and we hunt the bankers.
There are many big names in the cryptocurrency circle. They watch the show when the market makers hunt retail investors, follow the market when the market makers push up the price, and run away when the market makers distribute chips.
Their common trait is patience. Like a wolf, they stare at their prey without moving.
Only by knowing yourself and the enemy can you win every battle. Only by understanding the enemy's movements can you strike in a targeted manner.
I believe that experienced people have seen the picture below, and may even know it by heart.
After seeing this chart, you might be thinking, "How could I be so stupid?" Don't believe it, right? Just open your trading history and you'll see. Why is something so simple to understand so difficult to implement? It's just human nature. Trading is all about human nature.
Just to give an example:
There is no new low in the new decline on December 31, 2022. This is a bottoming signal. You can buy at this time and wait to sell in March 2024. It is very simple and clear at a glance. When you see this, you may scold me and say that the K-line has come out now. If you say so, what if it hasn't come out?
Each complete K-line is like a complete civilization. History will not repeat itself, but it keeps repeating itself.
If you're dreaming of getting rich overnight, trading contracts, leveraging your profits 10x, 100x, and trading dozens of times a day, then the candlestick chart won't matter to you, and your money will eventually be wiped out. Don't deny it, patience is a luxury for most retail investors. The entire process shown above would take over a year. If you're tempted to trade dozens of times a day, let alone a year, that's enough.
Of course, this doesn't apply to professional short-term traders, whom I admire greatly because they require not only patience but also keen insight. If you have nothing but guesswork, you're just gambling, and you're gambling with a dealer who can cheat.
How can you not lose?
If you want to play against the banker, you need to have a comprehensive understanding of the banker. Each banker has his own unique trading methods. Some are bold and aggressive, some are cautious and careful, some are bloody and violent, and some are gentle and elegant.
According to their attitude towards retail investors, they can be divided into two types: good bankers and bad bankers.
Look at the two comparison pictures:
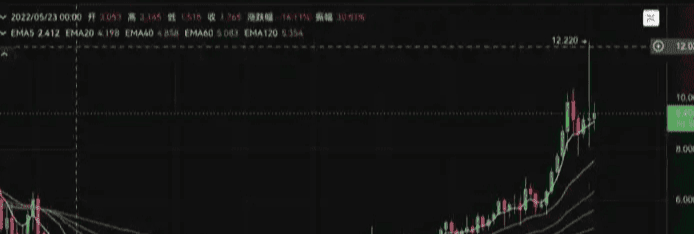
The weekly chart trend is from around 1 in May 2022 to the highest price of 12 in April 2024, which is a nearly 11-fold profit in two years. It has been slowly climbing up from the bottom. As long as you are on the bus, it will give you profits in no time. There will not be too much fluctuation and it will not scare you. I make money and I will make money with you, giving you the feeling of a big brother. This kind of banker is hard to come by!
Most of them are as follows:
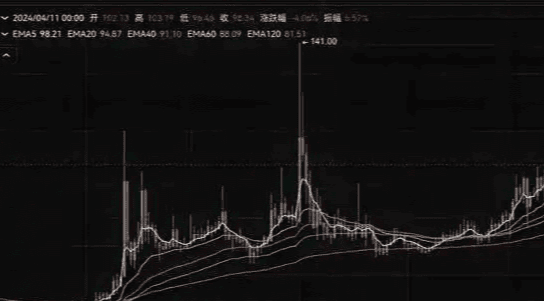
They lure investors into buying, distribute the profits to retail investors at the peak, and then use a large bearish trend to bet against them, leaving many small investors hanging on the chin. Their tactics are extremely violent and brutal. They use the same manipulation techniques over and over again, never getting tired of it. It's difficult to make money with this kind of dealer. Even if you're lucky enough to make a little money, you'll eventually give it back to them. Not only will you not make any money, but you'll also suffer a miserable loss.
There is no shortage of such dealers in the cryptocurrency circle, and their trading methods are ruthless.
In the stock market, there's a saying called the limit-up gene. This term applies equally to the cryptocurrency world. If a market maker has used a certain tactic before, they're likely to do so again. Every trader has their own personality, reflected in their different trading methods. It's easy to change a situation, but it's hard to change one's character, unless the market maker changes.
Of course, there is another type that is average. It washes the market when it needs to, and pulls up when it needs to. There are sideways movements, fluctuations, and main upward waves.
By observing the trading techniques used by the dealer, we can roughly judge what type of dealer it is, and then you can estimate the difficulty of making money in this dealer. Of course, choose the one with the easiest difficulty.
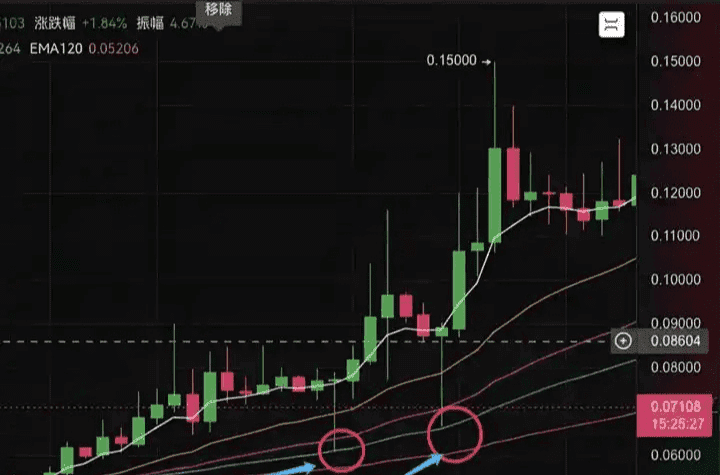
With this basic concept, let's take a look at the market maker's entry point, which is commonly known as the bottom of bottom fishing.
What is the “bottom”? Can I copy it?
Let’s first talk about how the “bottom” is formed. When the price of a currency pair falls below its market value, the “bottom” is about to appear. How do you understand it?
Everyone is familiar with the "Suan Ni Hen" incident. What is the normal value of a pound of garlic? When garlic prices are driven up by capital with ulterior motives, they have already deviated far from their market value. If a pound of garlic costs 3 yuan and is hyped up to 10 yuan, the extra 7 yuan is a bubble. Remember, bubbles must burst! When this bubble bursts, garlic will drop from 10 yuan to 9 yuan, 8 yuan, 7 yuan... Eventually, the price will drop to 3 yuan, and people will consider it the normal price, which will increase their purchasing power. At this point, the price will gradually stabilize. This price is the floor price for garlic, and therefore, its market value.
Of course, this is just a conceptual statement, so how do we judge it based on the K-line pattern?
When the value of a commodity is recognized by the "majority of capital," its value will be relatively stable. This "majority of capital" can be considered the dealer, and the value recognized by the dealer is basically its market value.
Next, let’s talk about its logic.
When a commodity is suddenly purchased frequently, it is impossible for it to remain stable at its original price. Scarcity makes things valuable, so the price will rise. Once the price rises, purchasing power will decrease. If garlic is expensive, I can just eat onions! When purchasing power decreases, the price will seek equilibrium and fall again. The following sentence is very important:
If it falls to a new low again, it means that the last low price was not recognized by the dealer, which means that the dealer did not really buy it.
When the price falls to a new low again, a large amount of purchasing power will appear again, the price will rise again, the purchasing power will decrease, and the price will fall again.
Note that if the price does not return to the original lowest price at this time, it means one thing: "Capital is continuing to acquire."
Sustained purchasing power is the strong support for not setting new lows.
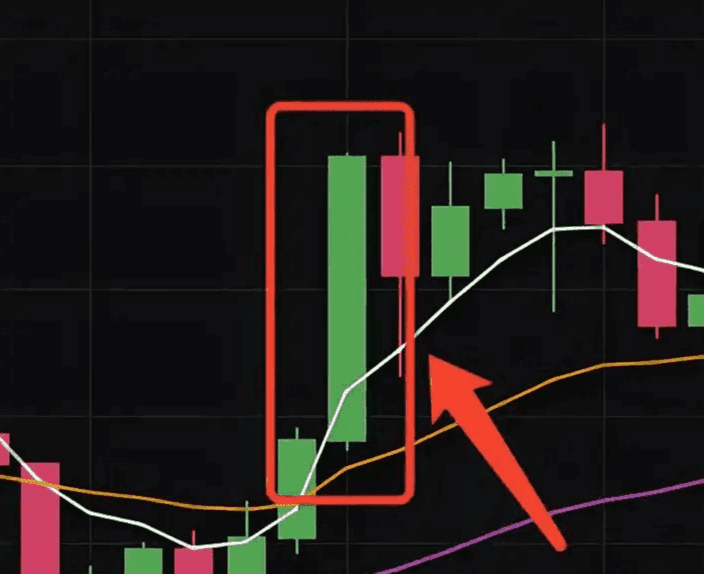
So how do you determine the bottom?
When a currency pair falls for a period of time and reaches its first low, how do you determine if it is the bottom? Wait for the second low to appear. If the second low hits a new low, it proves that the first low is not the bottom.
How do we determine if number 2 is the bottom? If number 3 doesn't hit a new low, it means "capital is continuing to acquire." Number 2 is preliminarily considered the bottom. Why is it a preliminary judgment? When number 4 appears, the bottom is basically confirmed.
Then you may ask, why don't I buy in directly when the number 2 appears? If the price should have risen a bit by the 4th, wouldn't it be too late?
If you have this idea, you need to re-read the above analysis. Even if you copied it, you did not copy No. 2, but No. 1. Remember that No. 2 is not the bottom before No. 3 comes out!
Even if you enter at No. 2, you will be washed out by the subsequent wash-out, and you may not be able to complete the entire climbing stage. So there is no such thing as late or not, it is a question of whether you can make judgments. If you can make the right judgment eight out of ten times, then you can make money.
If you want to rely on luck to pick at the bottom, there is a bottom below the bottom. If you catch a flying knife with your bare hands, you will definitely break your hands.
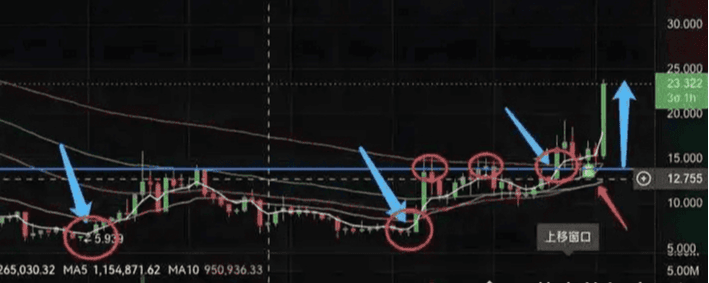
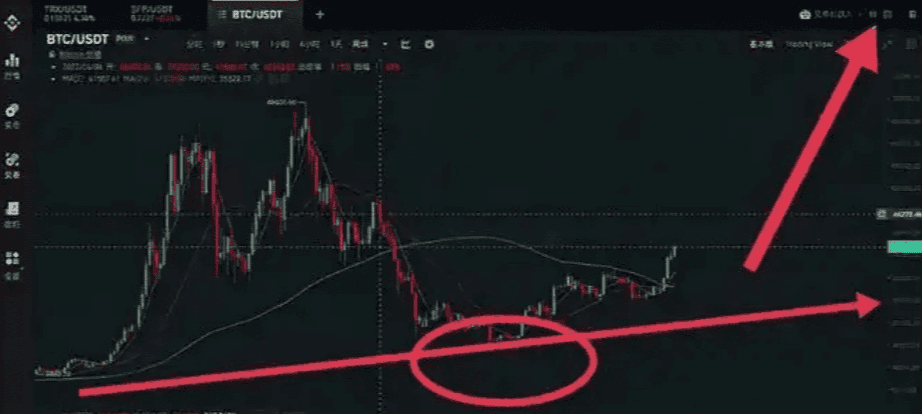
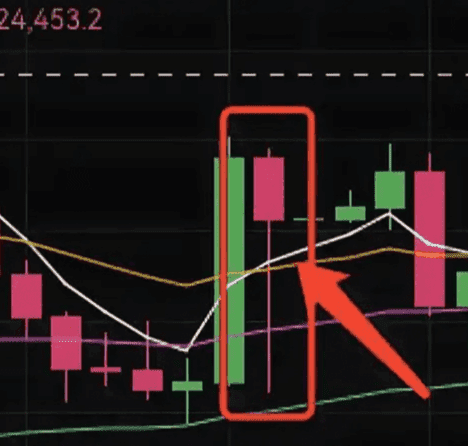
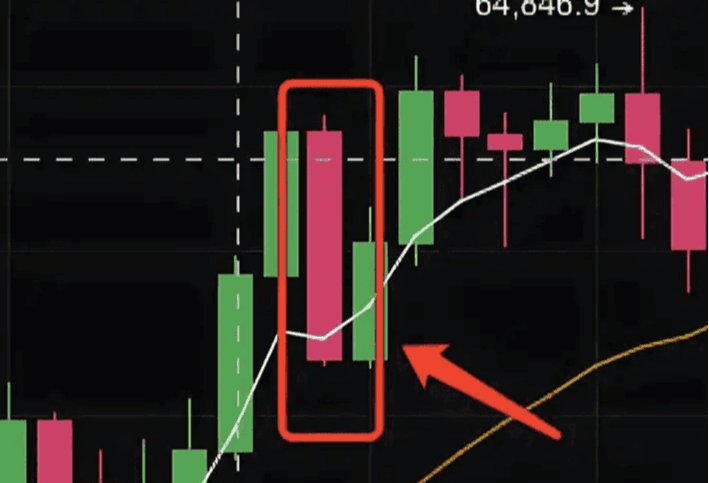
The red arrow in the picture is the actual buying point. You can try it out by opening any candlestick chart.
In fact, if we think about it, what will inevitably happen in the middle of a complete decline and rise?
There will inevitably be a turning point. Think carefully about what a turning point is.
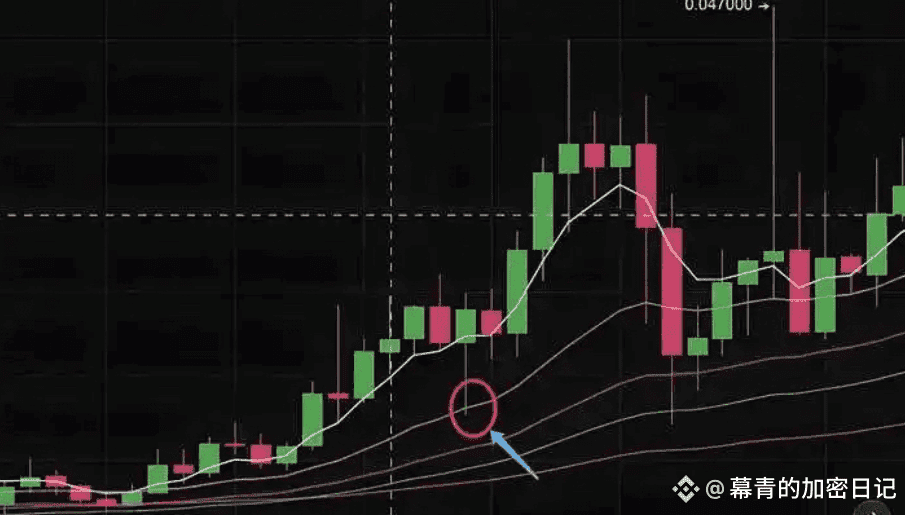
The free-rider strategy in the cryptocurrency market
Let me first talk about a strategy:
Every dip during an uptrend provides an opportunity to enter the market, and every rise during a downtrend provides a signal to escape.
Take a look at a few pictures to get a feel for it: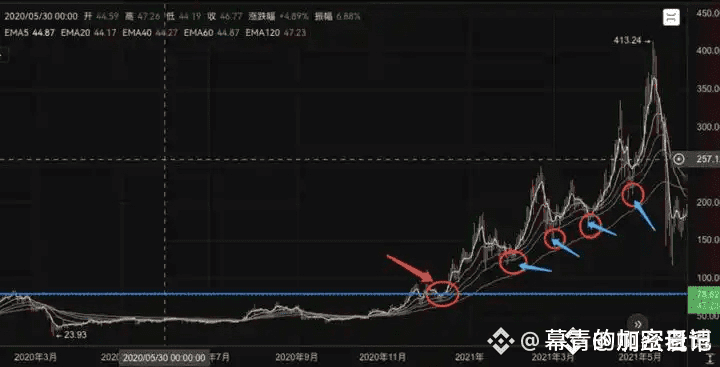
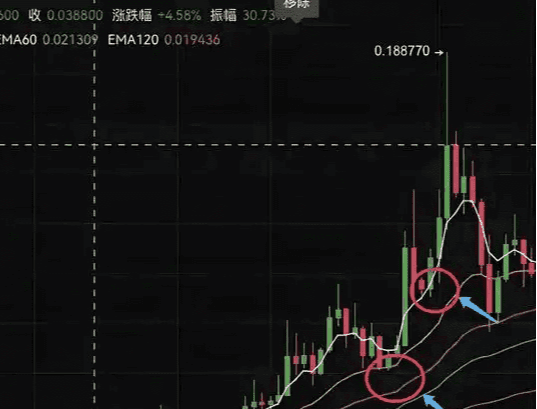
Let’s think about this question first: does such a powerful market maker have any weaknesses for retail investors?
Yes, this weakness is the dealer’s throat, and what we have to do is to hit the target with one strike.
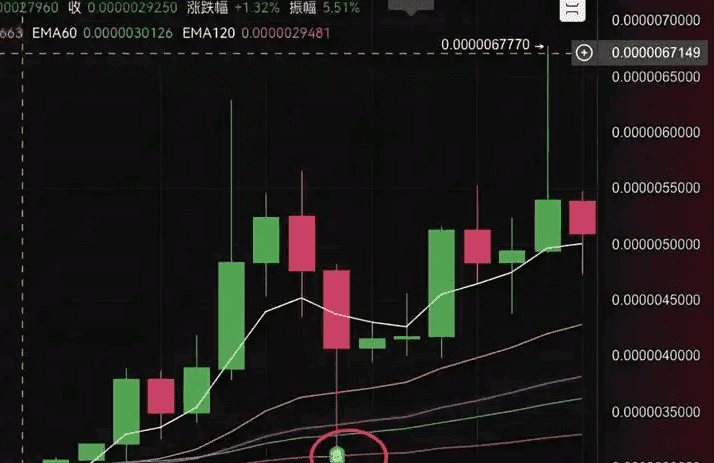
When a market maker sneaks into a currency pair and starts to collect chips, then this currency pair will most likely not hit a new low, and you will know: Oh, this market maker has started to sneak in. Individual rare events that hit a new low will also quickly pull back. When the main force has collected enough chips, the main force has to do one thing: start to push up the price. Even if a large number of retail investors get on board at this time, the market maker has to push up the price because he has enough chips. At this time, what we need to do is to catch this wave of free ride and reap the benefits.
The bottom-picking position mentioned in the previous article is precisely inserted at the position of the dealer: the throat.
So when does a trend begin? When a currency pair stops hitting new lows, it means the market makers have entered the market, indicating that an upward trend has begun. This is the trend.
Remember, once the trend starts, every decline is an entry opportunity that should not be missed.
During the rise, there will be many retail investors following the market, and the purpose of the decline is to wash the market, but the reality is often that you chase the high point when the market is rising, and you can't stand the loss at the low point when the market is washing, so you cut your losses and leave. Pull out your trading records and think about it carefully, it is ridiculous.
Remember, every dip during an upward trend is a market shakeout—just a market shakeout. Don't assume every dip is doomed, that the coin is about to fall below zero, or even be delisted. It's simply a market shakeout, a false alarm at best. Why fear a false alarm? Even if you don't know when to buy or sell, as long as you have this concept in mind, you've already surpassed 80% of retail investors. At least you'll have a general framework for the K-line chart. With this general framework, you'll have a clear understanding, and all that's left is patience.
Then someone said, this is because the K-line chart has come out, so you can naturally draw it like this. How would you know if it hasn’t come out?
Don’t be stubborn, don’t get stuck in a rut, think about it, think about the logic behind this process!
Some people say that I entered at the throat and I also entered when the price was falling, but how do I judge which place is the top and when should I exit?
As the saying goes, "the apprentice is the one who knows how to buy, the master is the one who knows how to sell." Market makers often try to be subtle in their attempts to avoid detection, making absconding significantly more difficult than bottom fishing. The reality is, if you, as a retail investor, happen to be buying at the top, you're lucky. You can't eat the entire fish from head to tail; a small portion is enough to digest. Escape before the market maker flees, securing your profits is key.
As for how to judge whether it is the top, one is to look at the volume, and the other is to see whether the price of the currency will reach a new high. This will be discussed later in an article specifically on how to judge the top of the dealer.
The logic of the tactics mentioned at the beginning also includes an ultimate skill: pin insertion.
Among these washout techniques, I particularly like the pin pattern, especially the large pin pattern. I often get excited when I see it because I know exactly what the main force is trying to do. I call this pattern a slingshot: the tighter you pull the slingshot, the farther it will shoot. For example:
So is the pin-splitting scary? Not really, it’s even a little cute, but only if the trend is upward.
Conversely, when the price of the currency doubles or even triples, profits can reach ten or even a hundred times higher in the cryptocurrency market. It is no exaggeration to say that if you can get even 50% in this process, you will already be at the top of the pyramid of retail investors.
Once the price stops reaching new highs, be careful. Remember these 12 words.
Next, if there is an avalanche and everything is shattered, every rise is an opportunity to escape. Don't expect it to rise a little more, don't hesitate, otherwise you will be trapped for eternity.
There is an extremely dangerous operation in this: betting on a rebound. The returns are not high but the risks are huge. It is like trying to pull chestnuts out of the fire, and the loss outweighs the gain.
Cryptocurrency Market Strategy: Strategic Trading
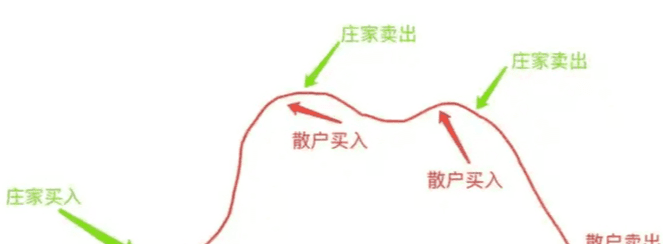
Let’s first take a look at how pressure points and support points are formed?
It can be said that the pressure level is created by the joint strength of retail investors, and retail investors are still very united in this area. When a peak is hung with many retail investors, these investors will become numb and indifferent.
It is a very interesting phenomenon that no matter in the stock market or in the cryptocurrency circle, people don’t care after a big drop, but they rush to sell when the price goes up a little, fearing that their profits will be withdrawn.
The real approach is to stop loss in time. Once you hold the trend, you should wait patiently for the harvest. Working hard for decades and then leaving after taking two points is a pure waste of time!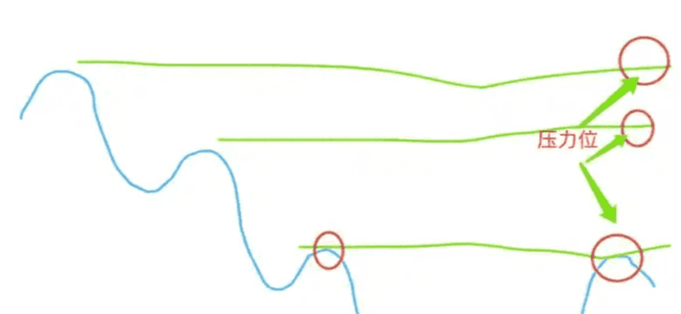
When the price returns to this position again, everyone rushes to get out of the market. People really know how to cherish things only after they have lost them. After waiting for so long, the point is finally back. How can they not be excited? Since the selling pressure to get out of the market is too great, the pressure level is formed and it has the power to suppress.
How is the support level formed?
By the same token, support levels often only play a supporting role in an upward channel. When many retail investors chased the previous high point and bought in, when the price of the currency falls back to this price again, due to the bullish market sentiment, the selling volume is very small, thus forming an actual support, and the price will often fall back to this place and then rise again.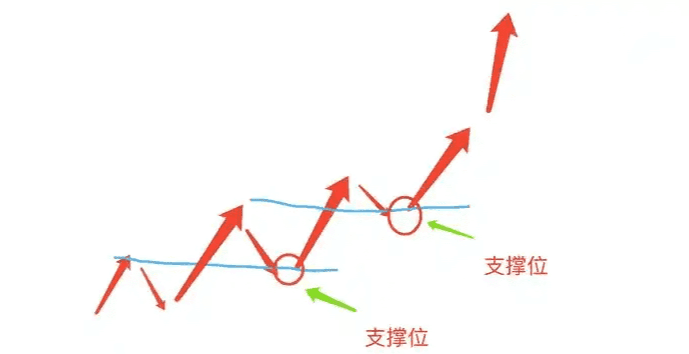
The above picture also shows the common tactics used by some dealers, which are the four steps of penetration, withdrawal, pressure and pull. However, under the mechanism of the currency circle, some dealers have reduced this kind of gameplay. Some only use it once or twice, and the currency price has reached the ceiling.
Remember, there is no absolute support level and no absolute resistance level. Support and resistance levels are only effective in a fixed trend. There is no resistance level that cannot be broken, and no support level that cannot be broken. Therefore, simply drawing lines is useless. As I said before, the trend is the overall framework. Without a framework, any indicator is not judgemental.
How to judge the trend? You can take a look at the basic logic introduction in the previous articles. If you understand it, you will not ask this question again. Then someone said: I will just buy a robot. I don’t need to look at the trend. It will directly give buying and selling strategies.
I can tell you: all strategy trading robots, or various single composite indicators, Bollinger Bands, energy tides, triple indicator averages, etc., you will find that you still don’t understand them even if you have learned them, because all trading strategies have one thing in common, which is the delay. Only when the K-line comes out will the trading signal be given based on the K-line. What’s the use?
Speaking of strategy trading robots, especially the so-called "magic tools" on the market, the systems that automatically generate buy and sell signals seem amazing at first glance. If you think so, I think you're incredibly smart. Who else should I cut? I've personally experimented with many strategy trading systems in the forex market, and the results are all artificially incompetent. My nickname, "Night Watchman," is the name of a trading system, a very powerful private equity system, but without human operators, it's also artificially incompetent.
Just think about it: if AI could ever generate K-line charts, the financial system would collapse completely. All strategic trading would either be a scam or require human judgment. With only these two options, valuable strategic systems would be used by their own people, while those without value would be used to scam people.
Basic indicators of cryptocurrency market manipulation tactics
What should a normal disk include?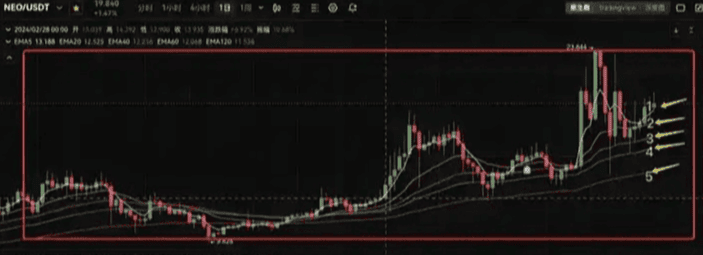
Generally speaking, the entire disk is divided into two parts: main and secondary. You can also place the main picture alone, depending on your personal preference.
Let’s look at the main picture first:
What indicators are generally used in the main chart?
I personally use the weighted moving average EMA, of course there are also those who use MA.
What is the difference between the moving average MA and the weighted moving average EMA?
The simple explanation of MA is to average the stock prices of several days and then connect them into a line.
For example, the 5-day moving average: average the prices from the first to the fifth day, average the prices from the second to the sixth day, average the prices from the third to the seventh day, and so on. Connecting these values into a line is the 5-day moving average.
How to understand it?
If the current price is above the 5-day moving average, it means that the market purchasing power is relatively enhanced in these five days. Otherwise, it means that the market purchasing power is continuously declining in these five days.
5 days is too short. What if we change it to a 120-day moving average?
In other words, if the market price stands above the 120-day moving average, does it mean that purchasing power has continued to rise over those 120 days? What does this signal? Short-term purchases may be volatile, but long-term purchases form trends. Therefore, the 120-day moving average is useful for determining medium- to long-term trends.
If the price crosses above the 120-day moving average and stabilizes, it indicates that there will be a short-term or long-term upward trend. This is the significance of the moving average.
So what is EMA?
It is an algorithm based on MA. As for how to calculate it, it is relatively complicated. Its characteristic is that it increases the sensitivity of MA, allowing the moving average to adjust accordingly when the short-term K-line changes drastically.
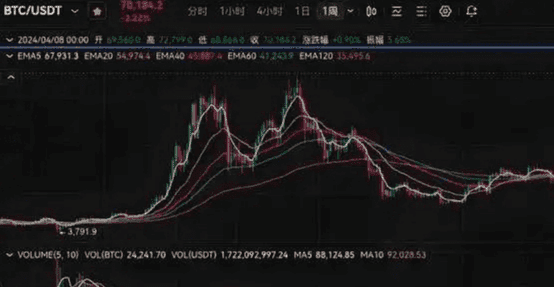
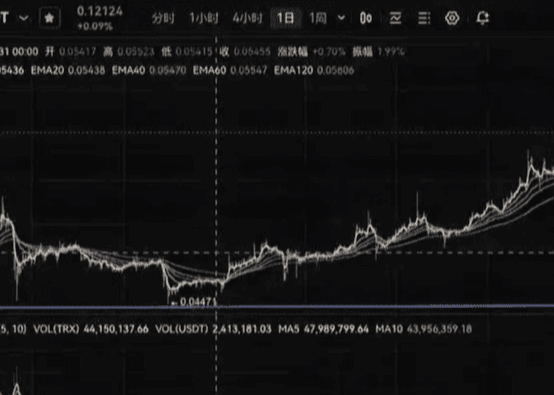
As shown in the figure, 12345 are EMA5, 20, 40, 60 and 120 day lines respectively.
I personally choose EMA because it is smoother and more pleasing to the eye than MA, and it can also increase the accuracy of judgment. The difference is not huge, so for short-term trading, I recommend the latter.
The relationship between moving average and price: price is like a dog running wild, and the moving average is like a rope. When the dog runs too far, tension will be generated between the rope and the dog.
However, the moving average only cares about price and not volume, so market makers use it to create various traps to lure in more or less money. Remember: Talking about price without considering volume is a scam.
How can we use moving averages to help us make better judgments?
Some indicators extended from the moving average include:
What do golden cross, death cross, price support, price pressure, golden spider, death spider, etc. mean respectively?
Golden Cross: The cross formed by the short-term moving average crossing the long-term moving average has a supporting effect on the price in the short term. As shown in the figure:
There are two golden crosses in the figure: the cross formed by the 5-day moving average crossing the 10-day moving average, and the golden cross formed by the 5-day crossing the 20-day moving average. The price successfully rose in a short period of time.
The 5-day golden cross indicates that people who bought within 5 days are willing to use more than the average price within 10 days to chase the rise, so the short-term demand exceeds the supply, and the price increase is natural.
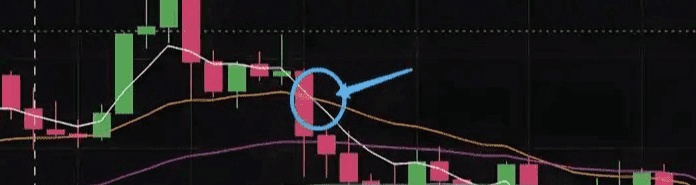
The cross formed by the 5-day moving average crossing below the 10-day moving average in the figure is called a death cross, which has a suppressive effect on prices in the short term.
Golden cross and death cross play a role in judging the next trend in a certain sense.
However, it also has a lag, and if it is a short-term moving average, it is even more limited.
How to increase its power?
Multiple Crossovers Simultaneously: Golden Spider and Dead Spider.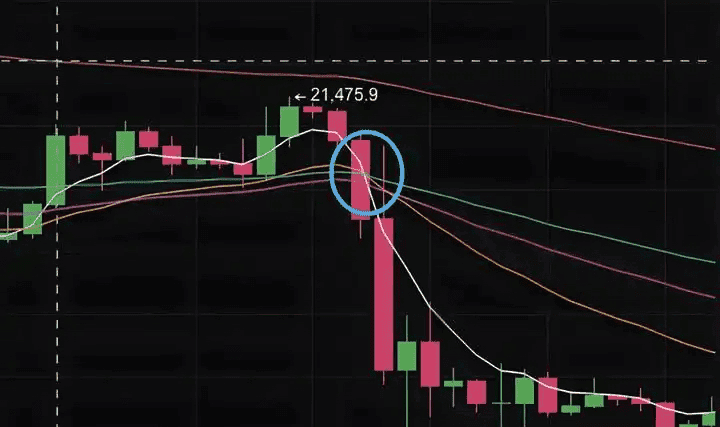
The picture shows a typical dead spider pattern: the 5-day moving average crosses below the 10-day and 20-day moving averages, while the 10-day moving average crosses below the 20-day moving average, forming a six-legged spider-like pattern. This is a strong bearish warning.
On the contrary, the shape formed when the 5-day line crosses the 10-day line, the 5-day line crosses the 20-day line, and the 10-day line crosses the 20-day line is called the Golden Spider. The appearance of the Golden Spider indicates the arrival of a bull market.
The appearance of spiders often indicates the market trend for the next period of time, because it involves three cycles at the same time. As for how long the trend will last, it depends on the moving average of the cycle involved.
By the same token, any moving average crossover has a lag. How can we increase its stability and durability?
So let’s extend it further: price support and price pressure.
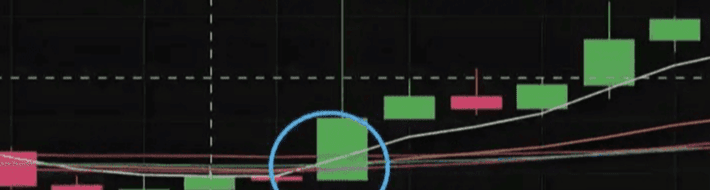
Price support: The triangle formed by the 5-day moving average crossing the 10-day moving average, the 10-day moving average crossing the 20-day moving average, and the 5-day moving average crossing the 20-day moving average provides support for prices for a period of time. As shown in the figure, not only is there a price support, but there is also a double price support, which has been proven to lead to a subsequent three-month upward trend.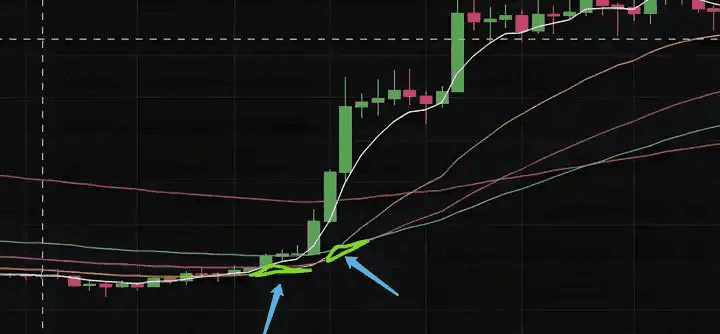
Not only did it form a price support, but it also formed a double price support. Facts proved that there was a wave of upward trend lasting three months.
Price pressure: The triangle area formed by the intersection of the 5-day moving average crossing below the 10-day, the 5-day crossing below the 20-day, and the 10-day crossing below the 20-day will have a suppressive effect on prices in the future.
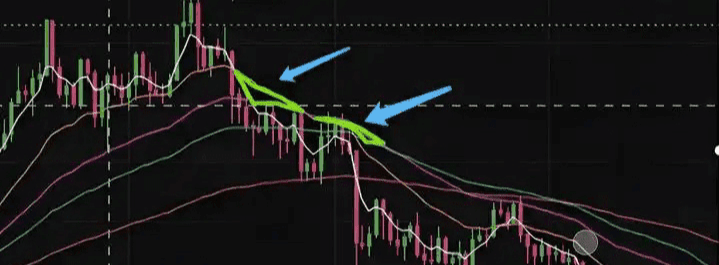
The price continued to fall for a whole year under this double price pressure.
Therefore, generally speaking, the beginning of a market trend is often preceded by the appearance of a price support or price pressure pattern. Two price support or price pressure patterns are more stable. When this pattern appears, bulls can enter the market at a low price, and vice versa.
Note: Horizontal and volatile market conditions are excluded.
Let's look at the picture above and think about a question: How did the two levels of double price support appear? Why did this market situation occur?
As a trader, the most terrifying thing isn't a technical problem, but a lack of understanding, falling into trading traps without realizing it! There's no such thing as an invincible trading system, only people who use it invincibly! This is the truth; trading systems ultimately come down to people!
Lao Ma only does real trading, the team still has positions to speed up#加密市场回调
