
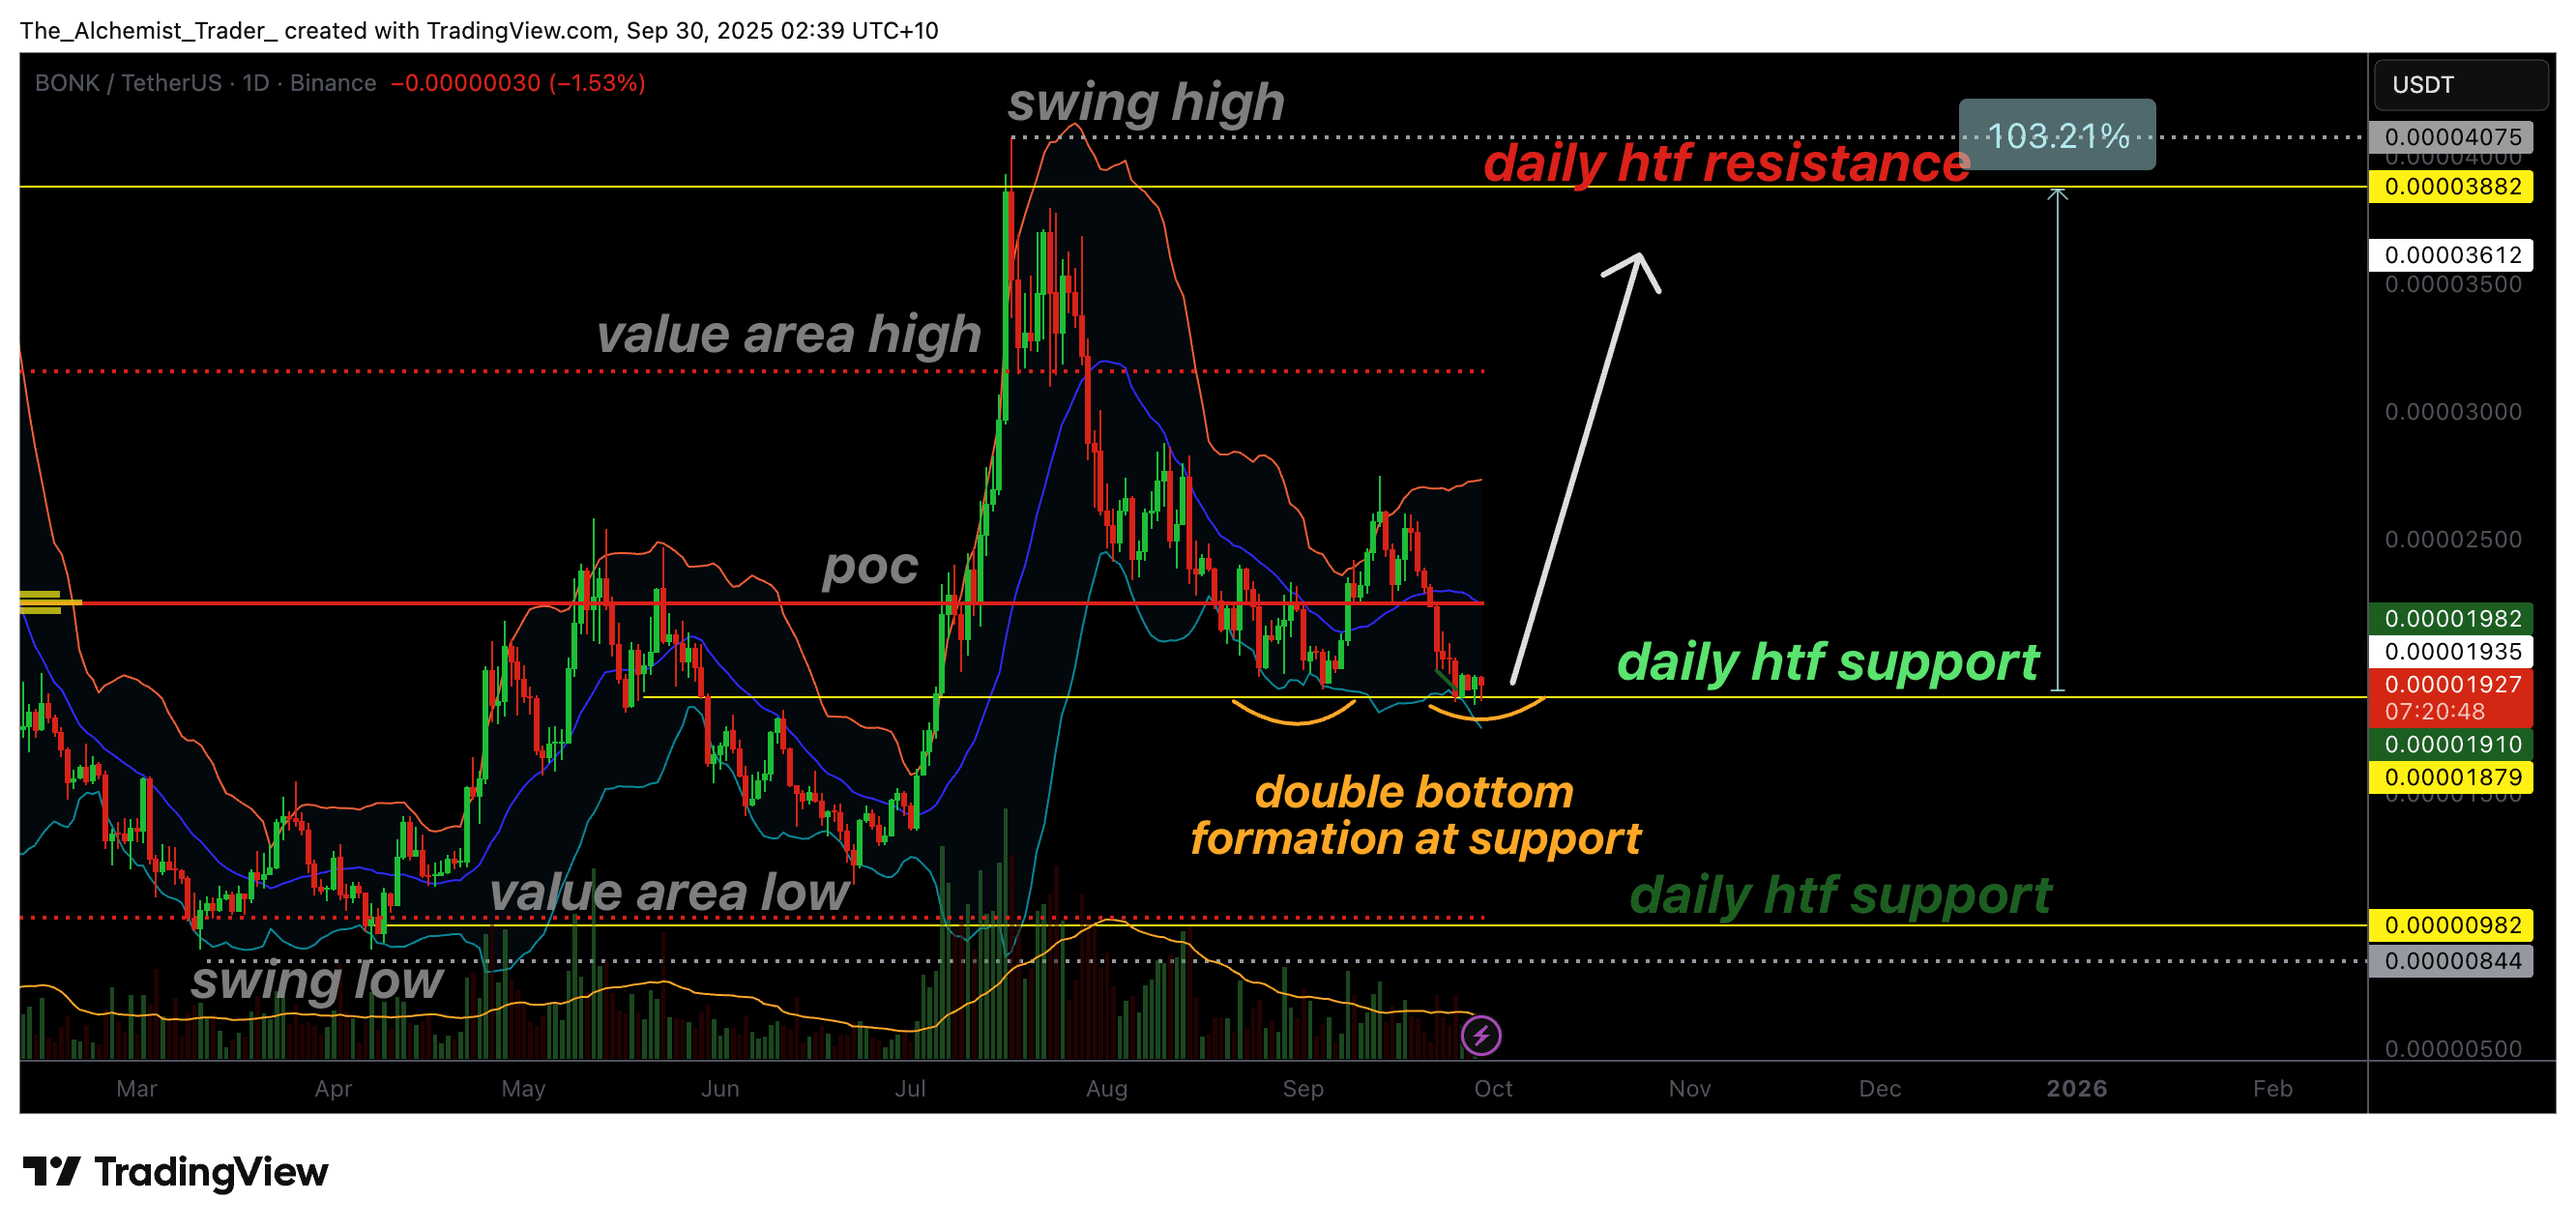
The Bonk (BONK) token is currently maintaining an important support level after a long correction period, where the chart shows indications of forming a double bottom pattern, which is a classic pattern that can reverse the trend and bring back upward momentum.
Key technical points:
The daily support level corresponds to the Point of Control (POC), which is a pivotal area that may determine the future of price movement. (Note: The POC value is not displayed as a separate field on Binance; based on the Volume Profile indicator reading in market analyses and recent analysis articles, the Point of Control is approximately within the range of 0.0000194 – 0.0000196 USDT).
The Bollinger Bands indicator suggests that the currency is in an oversold area on the daily timeframe, increasing the likelihood of a technical rebound if coinciding with high buying volume.
To activate the double bottom pattern, the price must close above the Point of Control (POC) on a daily closing basis to give strength to the upward wave.
Accurate price data (updated from Binance):
Current price (Binance, Spot BONK/USDT): 0.00001945 USDT.
Another 24-hour range (Binance): low: 0.00001849 USDT — high: 0.00001964 USDT.
Trading volume over 24 hours (Binance): ~837.14 billion BONK equivalent to ~16.01 million USDT according to exchange data.
What to expect:
If the price manages to reclaim the Point of Control (≈0.00001945 USDT) at daily close, it may lead to a significant bullish surge, with the potential to achieve gains exceeding 100% if strong liquidity and buying volume are present.
If the price fails to do so, the correction may continue or the sideways volatility period may expand, especially if trading volume declines.
💡 Tip: Monitor trading volume and whale movements; on-chain data and Nansen reports indicate an accumulation of whales by ~80 billion tokens recently (which reduced token balances on exchanges and gave accumulation signals that could support the likelihood of a reversal).
