Solana breaks below the 225 USD area, initiating a new round of decline. Currently, the SOL price is trying to rebound from 192 USD and facing…… .

Solana starts a new round of decline below 225 USD. The SOL price is currently attempting to rebound from 192 USD and facing resistance around 215 USD.
SOL price begins to decline again, falling below 225 USD and 220 USD against the dollar.
The current price is above 200 USD and the 100-hour simple moving average. A key bearish trend line was broken on the hourly chart of SOL/USD, with resistance at 200 USD (data source: Kraken).
If the price remains below $215 and $220, it may start to decline again.
Solana's price is declining again.
Solana's price failed to maintain above $220 and started a new round of decline, like Bitcoin and Ethereum. The SOL trading price broke below the support levels of $212 and $205, entering a bearish zone.
Bears even pushed the price below $200 and the 100-hour simple moving average. The price formed a low at $191 and recently began to rebound above the 23.6% Fibonacci retracement level, which is from the downtrend from the 242 high to the 191 low.
In addition, on the hourly chart of SOL/USD, it broke through the key bearish trend line, with resistance at $200. Solana is currently trading above $200 and the 100-hour simple moving average.
If the price rises further, it may face resistance around $212. The next major resistance level is around $215, which is the 50% Fibonacci retracement level from the downtrend from the 242 high to the 191 low. Major resistance may be at $220.
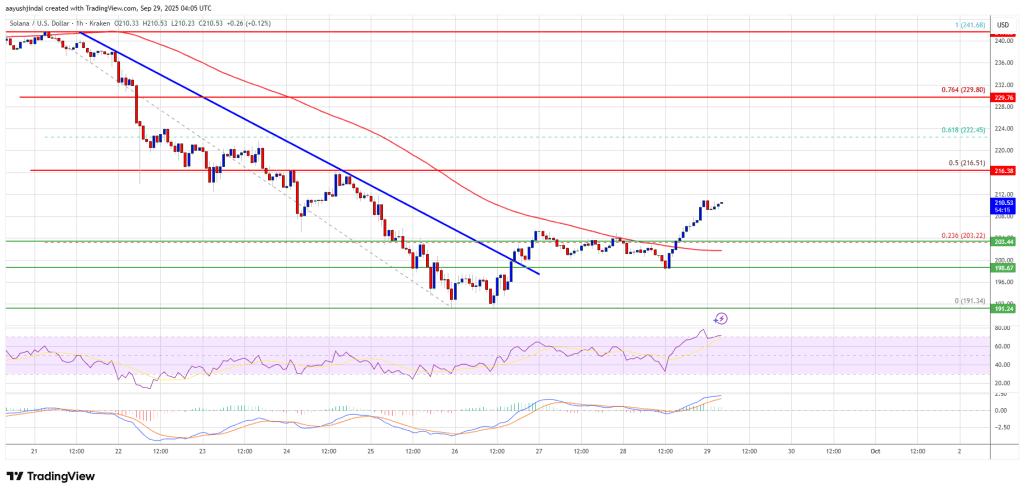
If it successfully closes above the resistance level of $220, it may lay the foundation for the next round of steady rise. The next key resistance level is $230. If it continues to rise, the price may further approach $242.
SOL down again?
If SOL fails to break through the resistance level of $215, it may continue to decline. On the downside, the initial support level is around $202. The first major support level is around $200.
Breaking below the $200 level may push the price towards the support level of $192. If the closing price falls below the support level of $192, the price may drop to the support level of $180 in the short term.
Technical Indicators
Hourly MACD - The MACD for SOL/USD is accelerating in the bullish zone.
Hourly RSI (Relative Strength Index) - The RSI for SOL/USD is above the 50 level.
Major support levels - $202 and $200.
Major resistance levels - $215 and $220.
I am (Military Brother Encryption) with 7 years of deep cultivation in the cryptocurrency circle, showcasing true skills in short-term speculation and strategic layout in mid to long-term investments. Accurately capturing the optimal trading opportunities, I empower your investment decisions with firsthand information. Choosing the right direction and finding the right rhythm, here is the professional perspective you need.$SOL