The essence of market trading
Fourth Lesson
Today, I will continue the theme of the third lesson: analyzing the game of supply and demand through the relative relationships between candles, incorporating elements of space.
The third lesson talks about the high-three patterns, while this lesson will discuss the low-three patterns. The pattern is the appearance; we need to look through the pattern, understand the changes in the supply and demand game, and clearly recognize who is strong and who is weak, so we can accurately position ourselves. As shown in the figure:
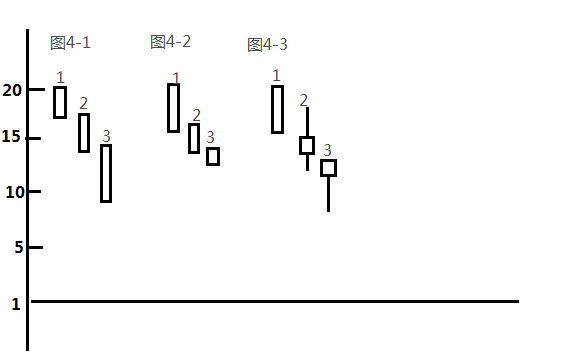
Figure 4-1 to Figure 4-3, although they are all low-three patterns, we can clearly feel through comparison that the supply force is strongest in Figure 4-1; the supply force is weakest in Figure 4-3;
Now, I will analyze the supply and demand principles of these three groups of candle patterns one by one.
In Figure 4-1, the candles 1-3 all showed that after the opening, sellers actively completed transactions downward at the buyers' quotes. Moreover, the bodies of the three candles gradually enlarged and closed at the bottom, indicating that sellers were willing to sell their chips regardless of how low the price was, reflecting their eagerness to close positions and an abundance of supply. The performance of candles 1-3 occurred under conditions of insufficient demand, with supply increasing.
In Figure 4-2, the patterns of candles 1-3 are exactly the opposite of those in Figure 4-1, with the bodies of the candles gradually shrinking. Although they all closed at the bottom, it indicates that there was no significant influx of demand to prevent the price from falling. However, the gradually shrinking bodies and price differences also indicate that sellers are unwilling to continue selling at low prices. Therefore, the performance of candles 1-3 is that although demand is insufficient, supply is also gradually decreasing.
In Figure 4-3, the first candle is a medium to large bearish candle that closed at the bottom after the opening, indicating that sellers actively completed transactions downward at the buyers' quotes, reflecting a strong willingness to sell among sellers and robust supply. The long upper shadow of the second candle indicates that there was a time when buyers actively completed transactions upward at the sellers' quotes. The lower shadow also indicates that when the price fell to the lowest price, demand began to transact upward at the sellers' quotes. Ultimately, it did not close at the bottom. Comparing the performances of the buyers and sellers in candles 2 and 1, it shows that in the second candle, although supply was greater than demand, it also reflects that the power of demand began to strengthen while the power of supply began to weaken (the forces of supply and demand showed a situation of mutual rise and fall). After the opening, the third candle fell to the bottom and then encountered strong demand at the bottom. Buyers continued to complete transactions upward at the sellers' quotes, ultimately closing above the midpoint, indicating that demand was greater than supply.
From the price movement from the 1st to the 3rd, it is clear to see that during the price decline, some buyers thought the price was cheap and continued to buy. The lower the price, the more they bought. This indicates that supply changes from strong to weak and demand changes from weak to strong, ultimately leading demand to overcome supply.
Through the interpretation of the candles in the third and fourth lessons, have you sensed the market language of candles through my candle interpretation?
A single tree cannot make a forest; a lonely sail cannot go far! In this circle, if you do not have a good community, and you lack first-hand news from the cryptocurrency circle, then I suggest you follow Lao Wang, who will help you profitably reach the shore. Welcome to join the team!!!
