The Essence of Market Transactions
Lesson Twenty-Five
I have been very busy and haven't updated the course for a long time. Given that many friends have reflected they don't know how to understand the connotation of candles, I have thought for a long time and hope to tell everyone in the way that is closest to practical application and easy for everyone to accept. Therefore, I thought of interpreting the connotation of candles through the following charts.
The book states that when demand exceeds supply, prices rise, and when supply exceeds demand, prices fall. However, from the perspective of transaction volume, the formation of transaction volume is achieved through the agreement between supply and demand, meaning that the quantity of supply corresponds to the quantity of demand. At the same time, I want to ask everyone, if demand is greater than supply, does that mean prices will definitely rise? If supply is greater than demand, will prices definitely fall? The answer is not necessarily. I will explain the reasons one by one below using charts.
As shown in the figure:
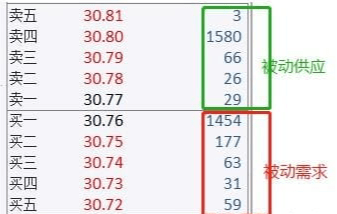
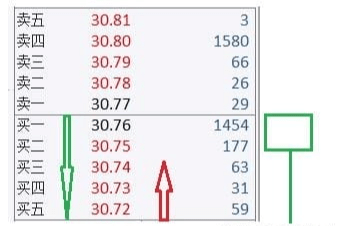
In Figure 25-1, sell one to sell five are the seller's quotes and quote quantities, while buy one to buy five are the buyer's quotes and quote quantities. If the buyer does not buy at the seller's quotes or the seller is not willing to sell at the buyer's quotes, the price will not change. Therefore, the green box on the right side of sell one to sell five represents passive supply, which cannot drive the price down; at the same time, the box on the right side of buy one to buy five represents passive demand, which cannot drive the price up.
As shown in the figure below:
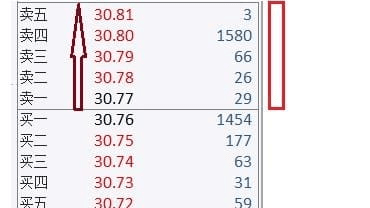
In Figure 25-2, when the buyer executes all the sell orders from the seller's sell one to sell five on the right side, the price rises, forming a bullish candlestick on the right side. These buy orders do not appear in the upper chart, which are market buy orders; they represent active demand that drives the price up.
As shown in the figure below:
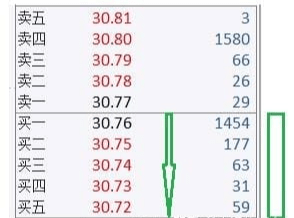
In Figure 25-3, when the buyer executes all the buy orders on the right side from the seller's buy one to buy five, the price drops, forming a bearish candlestick on the right side. These sell orders do not appear in the upper chart, which are market sell orders; they represent active supply that drives the price down.
In summary:
Demand is divided into active demand and passive demand; active demand drives the price up, while passive demand cannot drive the price up.
Supply is divided into active supply and passive supply; active supply drives the price down, while passive supply cannot drive the price down.
When observing the market, we need to focus primarily on active demand and active supply, followed by passive demand and passive supply. The reason is that while passive demand cannot drive prices up, it can hinder price declines; passive supply cannot drive prices down, but can hinder price increases.
As shown in the figure below:
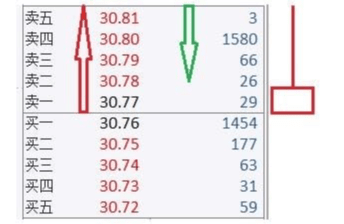
In Figure 25-4, the red arrow represents active demand eating away at passive supply, resulting in a price increase. At the same time, during the rise, passive supply is consuming active demand. When active demand is fully consumed and supply is in surplus, active supply begins to eat away at passive demand from the top of the red arrow, causing the price to drop, forming a red candlestick with a long upper shadow at the close. In this candlestick, we also observed the situation of active demand and active supply. From the perspective of a single candlestick, closing below half of the entire candlestick indicates that supply is stronger than demand.
As shown in the figure:
In Figure 25-5, the green arrow represents active supply eating away at passive demand, resulting in a price drop. At the same time, during the drop, passive demand is also consuming active supply. When active supply is fully consumed and demand is in surplus, the red arrow indicates that active demand begins to eat away at passive supply from the bottom of the green arrow, leading to a price increase, forming a long lower shadow green candlestick at the close. In this candlestick, we simultaneously observed how active demand and active supply drive price fluctuations, as well as how passive supply and passive demand hinder price fluctuations. From the perspective of a single candlestick, closing above half of the entire candlestick indicates that demand is stronger than supply.
As shown in the figure:
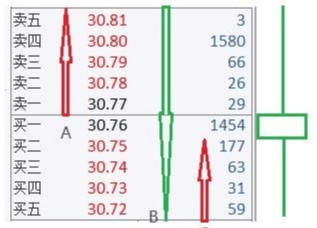
In Figure 25-6, the red arrow A represents active demand eating away at passive supply, resulting in a price increase. Simultaneously, during the rise, passive supply is consuming active demand. When active demand is fully consumed and supply is in surplus, the green arrow B shows that active supply begins to eat away at passive demand from the top of the red arrow, causing the price to drop. During the drop, active supply is also being consumed. When active supply is fully consumed and demand is in surplus, the red arrow C represents active demand once again eating away at passive supply, forming a green candlestick with both a long upper shadow and a long lower shadow at the close.
In this candlestick, we simultaneously observed how active demand and active supply drive price fluctuations, as well as how passive supply and passive demand hinder price fluctuations. From the perspective of a single candlestick, closing below half of the entire candlestick indicates that supply is stronger than demand.
The formation implications of other candlestick patterns refer to the interpretations of the above charts.
Note that the above chart is static and not dynamic, and the real-time movements of each candlestick can vary greatly. However, the close is always the same candlestick. Therefore, my charts may differ somewhat from actual movements, but please pay attention to the market implications I interpret.
The above is the interpretation of a single candlestick. I hope this lesson inspires you and provides some insights. Thank you all for reading.
A single tree cannot form a boat, a lone sail cannot travel far! In the crypto space, if you do not have a good circle, and lack first-hand news from the crypto world, I suggest you follow Old Wang, who will help you profit and get on board. Welcome to join the team!!!