Investment Strategy: Find your own 'path to wealth'
Long-term investment in mainstream crypto assets is a good choice. Mainstream cryptocurrencies like Bitcoin and Ethereum are like the 'evergreen trees' of the investment world. Despite significant market volatility, their value tends to rise over the long term. Investing a portion of your funds in them could yield surprises over time.
Short-term trading requires you to have sharp market insight. The cryptocurrency market is like a roller coaster, with prices fluctuating wildly. You need to decisively buy at the lows and sell without hesitation at the highs, which requires a precise grasp of market trends.
Diversifying your portfolio can reduce risk. Don't put all your eggs in one basket; invest in various cryptocurrencies, including mainstream coins and promising altcoins, so that even if one cryptocurrency performs poorly, other assets can balance the risk.
Regular investments are also a good method. Using dollar-cost averaging, regularly invest a fixed amount to avoid the risks of a lump-sum investment, gradually accumulating wealth over the long term.
Risk management: Protecting your 'wealth defense line'.
Controlling risk on individual trades is very important. Follow the 1% rule: the risk on any single trade should not exceed 1% of your total capital, so that even if one trade fails, it will not have a devastating impact on your overall investment.
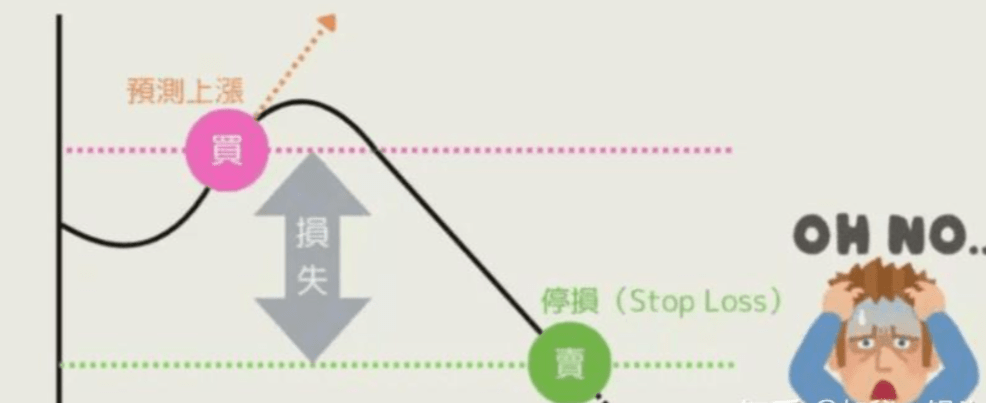
Setting stop-losses and take-profits is the 'seatbelt' in trading. Stop-losses can limit losses, and take-profits can lock in profits. It's like double insurance for your investments, ensuring that you can steadily protect your wealth amid market fluctuations.
Keeping track of market dynamics is key to risk management. Policy regulations, technological developments, and market emotions can all affect cryptocurrency prices. Staying informed is like sailing in the ocean while watching for changes in weather, allowing you to prepare in advance.
Other suggestions: Fuel your journey to financial freedom.
Cultivating a good mindset is the cornerstone of successful investment. In the cryptocurrency market, it is crucial to remain calm and rational. Do not be swayed by market emotions, overcome greed and fear, and strictly execute your investment plan.
Learning and research are essential paths to improving investment capabilities. Continuously learning about cryptocurrencies and blockchain knowledge, and deeply understanding the characteristics and market performance of different cryptocurrencies, is like constantly charging your investment brain, making it smarter and wiser.
Using tools and platforms can enhance trading efficiency. Choosing a reliable trading platform and utilizing its analytical tools and data support is like equipping your investment journey with a high-performance racing car, allowing it to speed through the market track.
In summary, the cryptocurrency market is full of opportunities and challenges. As long as you grasp the correct methods and maintain rationality and caution, the door to financial freedom may open for you. But remember, investment has risks; enter the market with caution.

Remember these 10 iron laws of the crypto space:
1 Strong coins falling consecutively for 9 days must be decisively followed; many people cannot wait for these 9 days.
2️ For coins that rise for 2 consecutive days, you must reduce your position; do not be greedy; if it's time to take profits, take them.
3️ For coins that rise more than 7% on the day, there is generally still room for growth the next day. You can continue to observe but do not rush in.
4️ Don't chase high prices for strong coins; wait for the correction to confirm before entering the market.
5️ If a coin has been flat for 3 consecutive days without movement, observe for another 3 days. If there is still no change, consider switching positions.
6️ If the next day you cannot recover the previous day's costs, exit in time; do not linger.
7️ A coin that has risen for three consecutive days is likely to have a fifth day. If a coin rises for two consecutive days, buy on the third day; the fifth day is usually a sell point.
8️ Volume and price are the soul: low volume breakout is an opportunity; high volume stagnation at high prices means it's time to exit.
9️ Only trade in rising trend coins: 3-day line for short-term buys, 30-day line for medium-term buys, 80-day line for main upward trends, and the 120-day line represents the underlying logic of a real bull market.
10 Small funds can also outperform the market. The key is: the right method, stable mindset, ruthless execution, and being daring when opportunities arise.
What is contrarian trading?
Contrarian trading (Counter Trend) refers to trading in the opposite direction of market trends.
In forex trading, contrarian trading refers to holding positions in the opposite direction of market trends. #BNB hits a new high.
When prices are in an uptrend: Sell.
When prices are in a downtrend: Buy.
If you can accurately catch the timing of trend changes or brief reversals, you may have the opportunity to profit.
However, due to the nature of contrarian trading being opposite to the trend direction, if the trend does not reverse, losses may increase significantly, posing a higher risk.
The differences between contrarian trading and trend-following trading.
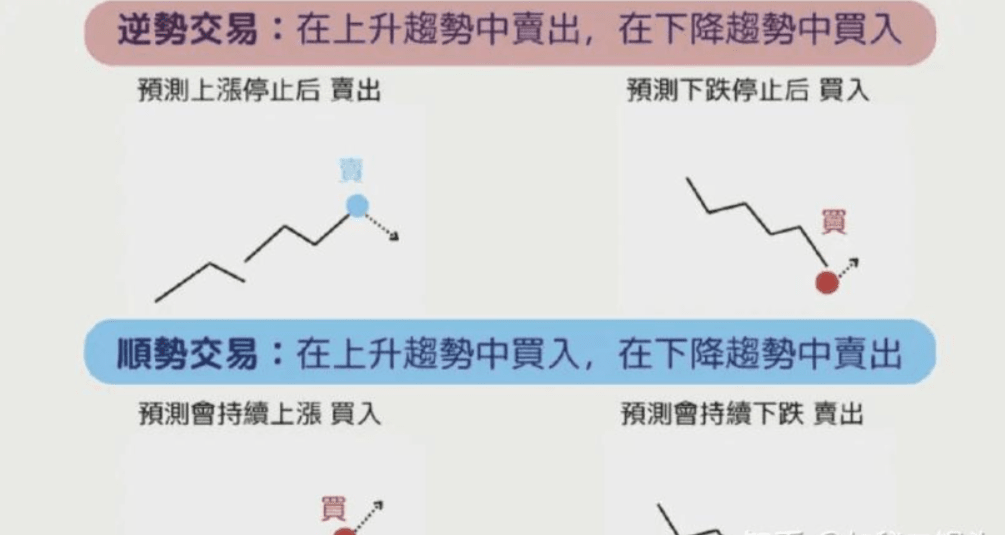
Trend-following trading, as opposed to contrarian trading, refers to holding positions in the direction of the market trend.
In an uptrend: Buy.
In a downtrend: Sell.
Generally, once a trend forms in the forex market, it often continues for a while, so trend-following trading is considered the mainstream method.
Conversely, contrarian trading is more effective during trend reversals or range-bound markets.
Flexibly using both trend-following and contrarian trading according to market conditions and time frames is key to improving profitability.
Method definition: Applicable market conditions: Trend-following trading follows the trend; trend market: Contrarian trading goes against the trend; range-bound market or trend reversal.
The advantages and disadvantages of contrarian trading.
The following introduces the advantages and disadvantages of contrarian trading.
The advantages of contrarian trading.
The main advantage of contrarian trading is that it can yield high rewards when successful.
If you can accurately judge the end of a trend and enter contrarian trading, once the market reverses, you can capture the initial movement of the trend and gain significant profits.
The drawbacks of contrarian trading.
Although contrarian trading can yield substantial rewards in successful cases, if the trend continues in the original direction after entering the market, one must be prepared.
If you do not stop losses in time, it may lead to significant losses, so extra caution is needed.
How to effectively utilize contrarian trading.
In forex trading, the entry timing for contrarian trading includes the following situations:
Targeting important figures' speeches.
Targeting range-bound markets.
Targeting rebounds.
Targeting important figures' speeches.
In forex, 'important figures' speeches refer to speeches made by people who have a significant impact on a country's financial policy or economy.
This specifically includes central bank governors, finance ministers, and high-ranking government officials.
In the USA and Europe, common important figures include:
Chairman and council member of the FRB (Federal Reserve Board of the USA).
President and council member of the ECB (European Central Bank).
Finance ministers, treasurers, financial officers.
The content and influence of these figures' speeches are as follows:
Speech content: Policy rates, currency values, optimistic views on the economy rising, pessimistic views on the economy falling, prices being 'above appropriate levels' rising, prices being 'below appropriate levels' falling.
If you predict that important speeches may reverse the current trend, you can position yourself for contrarian trading beforehand. If the prediction comes true, you may have a chance to profit.
Targeting range-bound markets.
Range-bound markets refer to market conditions where prices fluctuate within a certain range.
As shown in the figure, prices are easily subject to selling pressure at the upper limit of the range and buying pressure at the lower limit, causing prices to fluctuate up and down.
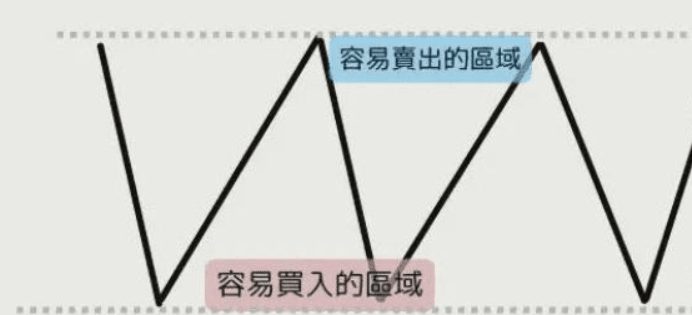
When the price approaches 'difficult to break levels', contrarian trading can be conducted, for example, selling at the upper limit and buying at the lower limit.
Targeting rebounds.
A rebound refers to the transition of the market from a decline to an increase (or from an increase to a decline).
The 'buy on pullback' and 'sell on rebound' in trend-following trading are trend-following from an overall perspective, but are contrarian operations at a single point in time.
How to conduct contrarian trading through technical indicators.
In contrarian trading, technical indicators are usually used to predict trend reversal points.
The following introduces methods for contrarian trading using representative indicators – RSI, KD stochastic indicators, CCI, Bollinger Bands, and MACD:
The contrarian trading method of RSI.
The contrarian trading method of the KD random indicator.
The contrarian trading method of CCI.
The contrarian trading method of Bollinger Bands.
The contrarian trading method of MACD.
The contrarian trading method of RSI.
RSI (Relative Strength Index) is an indicator based on the average gains and losses of price changes over a certain period, used to analyze the market's overbought level (overbought or oversold). Generally believed that:
RSI > 70: The market is overbought, the price may correct or decline, suitable for considering selling or reducing positions.
RSI < 30: The market is oversold, the price may rebound or rise, suitable for considering buying or averaging up.
RSI divergence: When the price hits a new high, but RSI does not, it may be a signal of trend reversal.
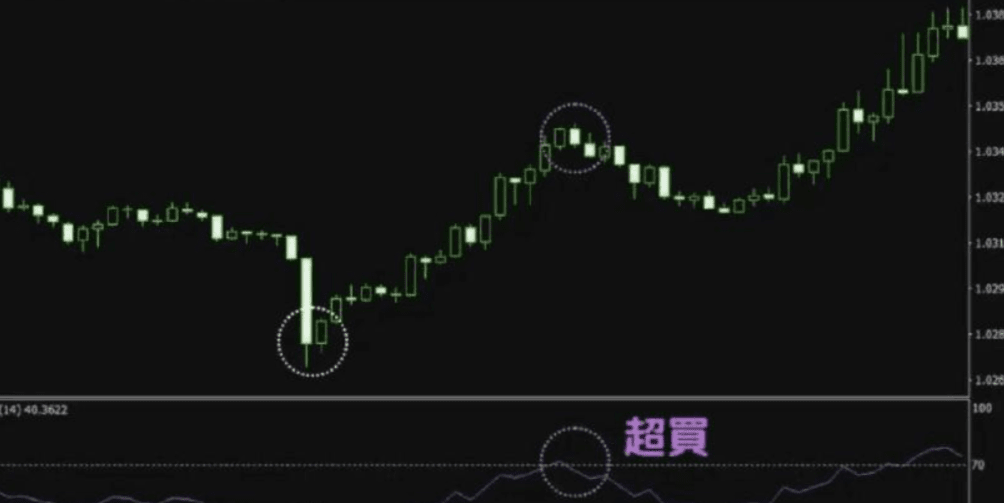
The above figure shows that after the RSI indicates overbought signals, the price subsequently declines; after indicating oversold signals, the price rebounds.
Using RSI can predict trend reversals, engaging in contrarian trading to pursue profits.
The contrarian trading method of KD stochastic indicator.
The KD stochastic indicator consists of %K and %D lines, which is a commonly used oscillator indicator to measure market overbought and oversold conditions, predicting potential price reversals by comparing current prices with a certain range of prices over time.
Its value range is 0-100%, and the general judgment standard is:
Signal type description: %K > 80: The market is in an overbought state, which may indicate that the price is about to correct or decline, suitable for considering selling or reducing positions. %K < 20: The market is in an oversold state, which may indicate that the price is about to rebound or rise, suitable for considering buying or averaging up. %K crosses %D: %K line crossing above %D line is a buy signal; %K line crossing below %D line is a sell signal.
Price divergence: When the price reaches a new high or low, but the KD stochastic indicator fails to synchronize with the new high or low, this may be a signal of trend reversal. For example, when the price hits a new high but the KD stochastic indicator does not, it may indicate that the upward trend will end, and vice versa.
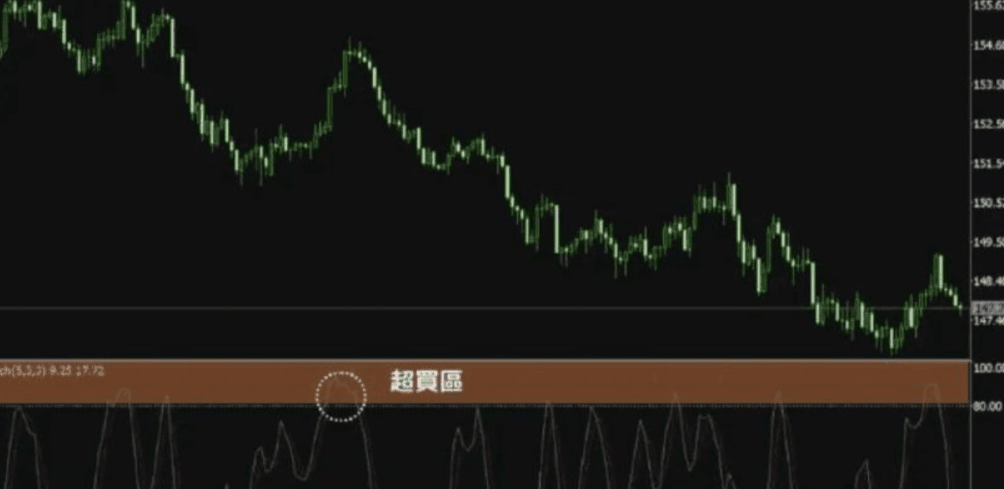
The above figure shows that when %K crosses below %D (above 80%), the price falls, and when %K crosses above %D (below 20%), the price rises.
However, the random indicator signals are frequent, which may increase the likelihood of false signals.
The contrarian trading method of CCI.
CCI (Commodity Channel Index) is an oscillator indicator used to measure the degree of price deviation from its statistical average. It can help traders identify the market’s overbought or oversold status and provide potential reversal signals.
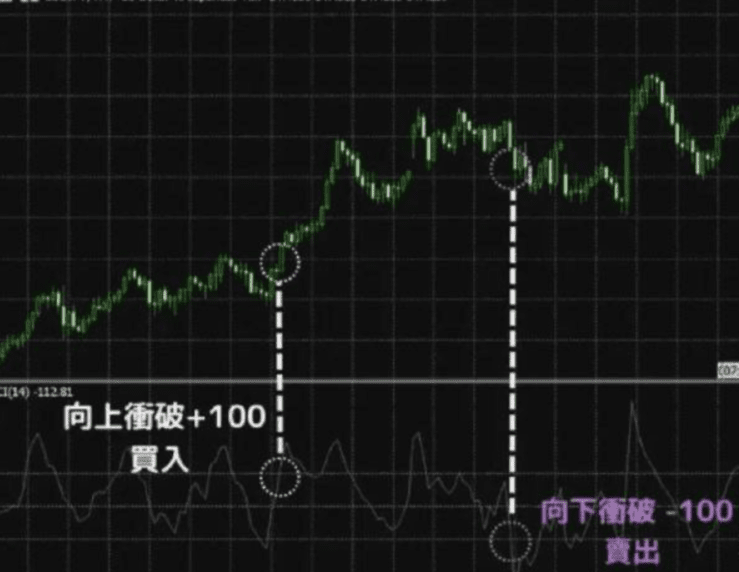
Signal type description: CCI > +100: The market is in an overbought state, which may indicate that the price is about to correct or decline, suitable for considering selling or reducing positions. CCI < -100: The market is in an oversold state, which may indicate that the price is about to rebound or rise, suitable for considering buying or averaging up. CCI zero line crosses: CCI breaking from the negative zone to above the zero line is a buy signal, while breaking from the positive zone below the zero line is a sell signal.
In times of severe market volatility, the following situations may occur:
CCI simultaneously breaks above +100 and +200.
CCI simultaneously breaks below -100 and -200.
This situation usually indicates extreme market volatility, making it difficult to predict. It is advisable to observe temporarily and not to enter easily.
Although most oscillators are typically used for 'contrarian trading', one of CCI's unique features is that it can also be used for 'trend-following trading'.
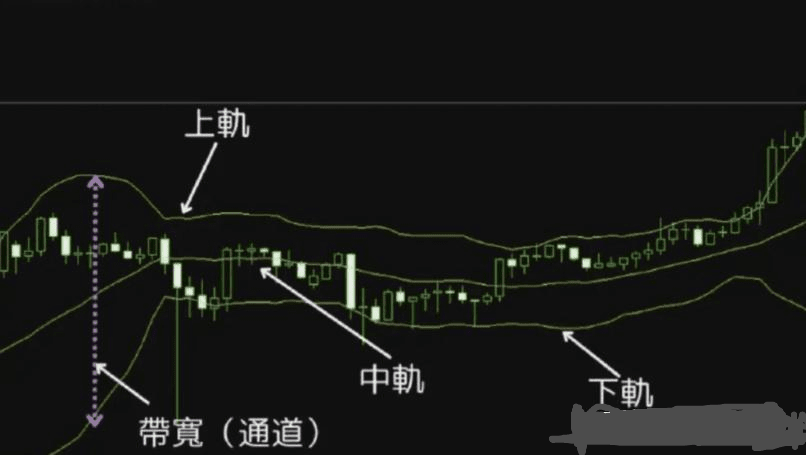
The contrarian trading method of Bollinger Bands.
Bollinger Bands determine the price's volatility range through simple moving averages (SMA) and standard deviations, thereby judging the market's overbought or oversold status.
When the price touches the upper band, the market may be in an overbought state; when the price touches the lower band, the market may be in an oversold state. Traders can use these signals to make buy and sell decisions.
However, be aware that if the K-line breaks the channel and the trend continues, it may lead to prediction errors.
To improve trading quality, you can use the characteristics of Bollinger Bands – 'Expansion' and 'Squeeze'.
One of the judgment methods is that when the channel narrows, it may signal an upcoming price fluctuation; when the channel expands, it may indicate increased market volatility.
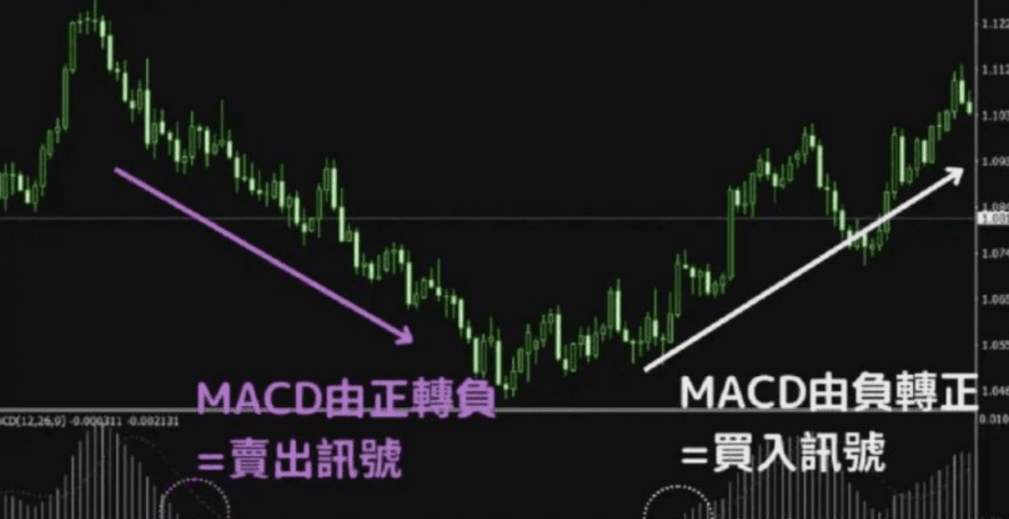
The contrarian trading method of MACD.
On the MT4/MT5 platform, the MACD indicator is usually displayed in the form of a histogram and a signal line (the MACD line is not displayed separately by default). Here are the specific interpretation methods:
Cross type description: Golden cross: When the MACD histogram transitions from the negative zone (below) to the positive zone (above), it means the MACD line (fast line) has crossed above the signal line (slow line), forming a 'golden cross'. This is usually seen as a buy signal, indicating that market momentum is increasing, and prices may rise. Death cross: When the MACD histogram transitions from the positive zone (above) to the negative zone (below), it means the MACD line (fast line) has crossed below the signal line (slow line), forming a 'death cross'. This is usually seen as a sell signal, indicating that market momentum is weakening, and prices may decline.
When two lines cross, it usually indicates a trend reversal and is an effective time for contrarian entry.
Additionally, the 'histogram' formed by the difference between MACD and the signal line, when crossing at 0, can also be used as a reference for entering the market.
Points to note when entering contrarian trading.
In forex contrarian trading, the following points need attention:
Avoid unplanned averaging down.
Set stop-loss lines.
Trade based on clear reasons.
Avoid unplanned averaging down.
When engaging in contrarian trading, avoid unplanned averaging down.
Averaging down means adding positions when the market goes against your expectations to lower (or increase) the average cost.
Due to the counter-trend nature of contrarian trading, if predictions are wrong, the risk of loss will increase significantly.
Set stop-loss lines.
Contrarian trading, due to being opposite to the trend, carries a higher risk of loss if the trend continues.

Therefore, it requires stricter execution of stop-loss than trend-following trading.
Before entering, clearly set the price point at which you will abandon the trade if losses reach this level.
Trade based on clear reasons.
Contrarian trading should not be done blindly; it should be based on technical indicators or fundamental analysis to ensure that there are reasons behind it.
Even if predictions fail, trading based on sound reasoning can help analyze the reasons for failure and improve the accuracy of future predictions.
Contrarian trading related Q&A.
The following are common questions about contrarian trading in forex:
Q1: What is the key to winning in contrarian trading?
A key point is to target calm periods when range-bound markets frequently occur.
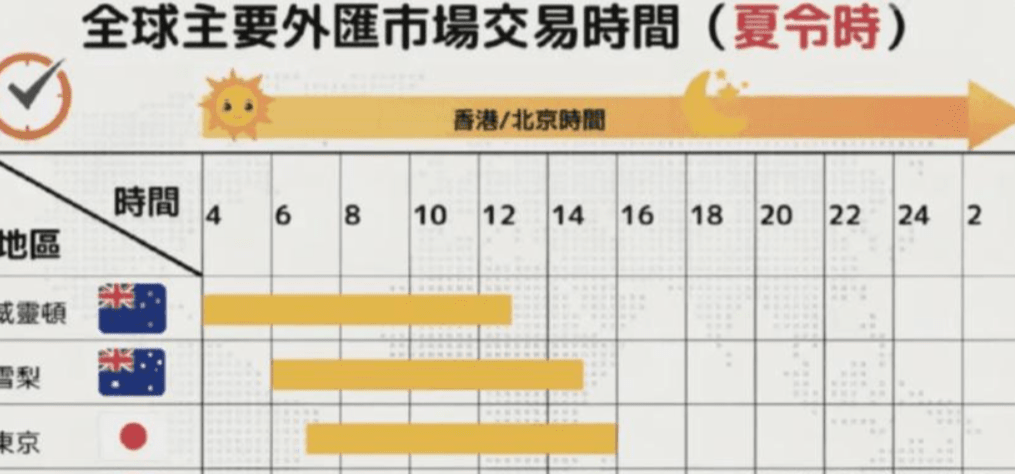
The forex market is more active when the London and New York markets open (approximately 4:00 PM to 5:00 AM Beijing time), making it easier to form trends.
Therefore, choosing a time outside of this period, such as from 10:00 AM to 3:00 PM Beijing time, is more likely to result in range-bound markets, suitable for contrarian trading.
Q2: Which is less likely to incur losses, trend-following or contrarian?
For beginners, trend-following trading is less likely to incur losses.
Because trend-following trades follow existing trends, the risk of loss is relatively low; whereas contrarian trades, if the reversal has not occurred, are prone to losses.
Q3: Is contrarian trading suitable for beginners?
Newbies in contrarian trading can also try, but due to the counter-trend operation, the difficulty is higher than trend-following trading.
Trend-following trading is more intuitive and suitable for beginners to master first.
Q4: Which indicators are recommended for contrarian trading?
Oscillator indicators are suitable for contrarian trading and can judge overbought or oversold conditions.
Common examples include:
RSI (Relative Strength Index).
RCI (Relative Strength Index).
Psychological Line.
Stochastic indicator.
Summary.
Contrarian trading is a trading strategy that goes against market trends, such as selling when prices rise and buying when they fall.
It has advantages in trend reversals or range-bound markets; if you can accurately capture reversal opportunities, you can achieve high returns, but if the trend does not reverse, the risk of loss is high.
Using technical indicators such as RSI, KD stochastic indicators, CCI, Bollinger Bands, and MACD can enhance prediction accuracy, determine entry points, and strictly execute stop-loss orders.
For beginners, it is recommended to first master trend-following trading, and then gradually try contrarian trading.
Let's talk about something practical – perpetual contracts, simply put, are futures markets that have 'no graduation date'. You don't have to worry about the delivery time; as long as you don't get liquidated, you can hold your position as long as you want. It's simply a favorite for those who stay up late to monitor the market!
How to choose the leverage multiple? Insiders have different opinions.
In the community, some people are stable with 30x leverage, while others operate aggressively with 50x leverage. But to be honest, since you're trading contracts, what's the difference between 1x leverage and buying spot? For example, with a popular coin, you can enter with 5U at 100x leverage, but at 30x, you need 16U. In the same market, 100x returns can achieve milk tea freedom, while 1x might not even cover the transaction fee...
But! Is! (The key point comes)
Never use a meager capital to engage in high-risk scenarios! I have seen too many people use a capital of 500U to open 100x leverage, only to be eliminated with slight fluctuations in the market. Remember: leverage is an amplifier, not a money printer. It is advisable to keep an additional 20% margin to provide your account with a layer of 'protective clothing' for stronger risk resistance.
Liquidation warning! Do not imitate these operations.
1. Holding onto the position: thinking you can endure everything, only to end up liquidated.
2. All-in: This is not investment; it's giving money to the exchange.
3. Contrarian averaging down: Buy more as it falls? Exchanges love such 'good-hearted people'.
Survival techniques:
Using the isolated margin model, if this order loses, there is still an opportunity to place another order.
Set a stop-loss; it should be more decisive than dealing with an ex.
Set a small daily goal (for example, earning 50U from a principal of 5000U), and stop when you reach it.
Real profit calculation (being aware).
Assuming you earn 1%-2% daily, achieving the target for 20 days in a month:
- 5000U × 1% × 20 days = 1000U.
- Even if there are a few days of losses, the bottom line can still yield a few hundred U.
Isn't this more exciting than bank wealth management? But remember – contracts are not a casino; planning is essential for long-term success.
Lastly, I’ll leave you with a mnemonic:
Lower the leverage and set stop-loss earlier.
Make money quickly and stay away from liquidation.
To make money trading coins, you only need to do one thing: do not be greedy.
I believe that in the crypto space, if you do not get greedy, you will definitely make money.
If you are greedy, most people will lose a lot of money, while a few will gain a lot.
Why do I say this? Because the cryptocurrency market is relatively mature now, and the more mature the market is, the fewer opportunities there are for sudden wealth.
First, if you are not greedy, making money is very simple.
In the long term, cryptocurrency is still gradually developing, and it is definitely possible to achieve a certain level of wealth in a gradually developing industry.
At the very least, you can dollar-cost average into BTC. In the long term, dollar-cost averaging into BTC is definitely a good wealth management strategy.
Secondly, if you are greedy, you are likely to lose a lot of money, while a small probability might earn you a lot. If you pursue excess returns and want tenfold or hundredfold results, you are likely to end up with nothing. Just take the bull market of 2023-2024 as an example; many people did not buy Bitcoin. Q2: Which is less likely to incur losses, trend-following or contrarian?
For beginners, trend-following trading is less likely to incur losses.
Because trend-following trades follow existing trends, the risk of loss is relatively low; whereas contrarian trades, if the reversal has not occurred, are prone to losses.
Q3: Is contrarian trading suitable for beginners?
Newbies in contrarian trading can also try, but due to the counter-trend operation, the difficulty is higher than trend-following trading.
Trend-following trading is more intuitive and suitable for beginners to master first.
Q4: Which indicators are recommended for contrarian trading?
Oscillator indicators are suitable for contrarian trading and can judge overbought or oversold conditions.
Common examples include:
RSI (Relative Strength Index).
RCI (Relative Strength Index).
Psychological Line.
Stochastic indicator.
Summary.
Contrarian trading is a trading strategy that goes against market trends, such as selling when prices rise and buying when they fall.
It has advantages in trend reversals or range-bound markets; if you can accurately capture reversal opportunities, you can achieve high returns, but if the trend does not reverse, the risk of loss is high.
Using technical indicators such as RSI, KD stochastic indicator, CCI, Bollinger Bands, and MACD can enhance prediction accuracy, determine entry points, and strictly execute stop-loss orders.
For beginners, it is recommended to first master trend-following trading, and then gradually try contrarian trading.
Let's talk about something practical – perpetual contracts, simply put, are futures markets that have 'no graduation date'. You don't have to worry about the delivery time; as long as you don't get liquidated, you can hold your position as long as you want. It's simply a favorite for those who stay up late to monitor the market!
How to choose the leverage multiple? Insiders have different opinions.
In the community, some people are stable with 30x leverage, while others operate aggressively with 50x leverage. But to be honest, since you're trading contracts, what's the difference between 1x leverage and buying spot? For example, with a popular coin, you can enter with 5U at 100x leverage, but at 30x, you need 16U. In the same market, 100x returns can achieve milk tea freedom, while 1x might not even cover the transaction fee...
But! Is! (The key point comes)
Never use a meager capital to engage in high-risk scenarios! I have seen too many people use a capital of 500U to open 100x leverage, only to be eliminated with slight fluctuations in the market. Remember: leverage is an amplifier, not a money printer. It is advisable to keep an additional 20% margin to provide your account with a layer of 'protective clothing' for stronger risk resistance.
Liquidation warning! Do not imitate these operations.
1. Holding onto the position: thinking you can endure everything, only to end up liquidated.
2. All-in: This is not investment; it's giving money to the exchange.
3. Contrarian averaging down: Buy more as it falls? Exchanges love such 'good-hearted people'.
Survival techniques:
Using the isolated margin model, if this order loses, there is still an opportunity to place another order.
Set a stop-loss; it should be more decisive than dealing with an ex.
Set a small daily goal (for example, earning 50U from a principal of 5000U), and stop when you reach it.
Real profit calculation (being aware).
Assuming you earn 1%-2% daily, achieving the target for 20 days in a month:
- 5000U × 1% × 20 days = 1000U
- Even if there are a few days of losses, the bottom line can still yield a few hundred U.
Isn't this more exciting than bank wealth management? But remember – contracts are not a casino; planning is essential for long-term success.
Lastly, I’ll leave you with a mnemonic:
Lower the leverage and set stop-loss earlier.
Make money quickly and stay away from liquidation.
To make money trading coins, you only need to do one thing: do not be greedy.
I believe that in the crypto space, if you do not get greedy, you will definitely make money.
If you are greedy, most people will lose a lot of money, while a few will gain a lot.
Why do I say this? Because the cryptocurrency market is relatively mature now, and the more mature the market is, the fewer opportunities there are for sudden wealth.
First, if you are not greedy, making money is very simple.
In the long term, cryptocurrency is still gradually developing, and it is definitely possible to achieve a certain level of wealth in a gradually developing industry.
At the very least, you can dollar-cost average into BTC. In the long term, dollar-cost averaging into BTC is definitely a good wealth management strategy.
Secondly, if you are greedy, you are likely to lose a lot of money, while a small probability might earn you a lot. If you pursue excess returns and want tenfold or hundredfold results, you are likely to end up with nothing. Just take the bull market of 2023-2024 as an example; many people did not buy Bitcoin.

21 days to develop a profitable investment habit, teaching you how to build your own trading system!
Creating a system is not very difficult. The challenge is to follow the rules you set when creating the system.
The goals of the trading system.
When you design your system, you need to achieve two very important goals:
1. Your system should be able to judge trends as early as possible.
2. Your system must prevent you from incurring double losses.
If your trading system can achieve the above two points, your chances of success will increase.
The reasons these goals are relatively difficult to achieve is because they contradict each other.
If you have a system that can quickly capture trends, you are very likely to catch false trends.
On the other hand, if your system emphasizes preventing losses, you may enter trades too late or miss many opportunities.
When formulating a mechanical system, your task is to find a balance between these two goals. Find a way to quickly judge the trend while distinguishing between false and true trends.
Six steps to formulate a trading system.
From a long-term perspective, a good trading system can potentially help you make a lot of money.
Step 1: Time frame.
When formulating a trading system, the first thing you need to determine is what type of trader you are.
Are you a day trader or a swing trader? How often do you look at charts – daily, weekly, monthly, or yearly? How long do you want to keep your positions?
This will help you determine the time frame you use when trading. Even if you look at charts from multiple time frames, this will determine the primary time frame you use to identify trading signals.
Step 2: Find indicators that help you judge new trends.
Since your goal is to determine trends as early as possible, we need indicators that can achieve this goal. Moving averages are one of the most popular indicators used by traders to judge trends.
Use two moving averages (one fast and one slow), and then start waiting until the faster one crosses the slower one or moves below the slower moving average. This is the basis of the 'moving average crossover' system.
The simplest form of the moving average crossover system is the fastest way to identify new trends. It is also the easiest way to discover new trends.
Of course, traders have many methods to identify trends, but moving averages are one of the easiest tools to use.
Step 3: Find indicators that help you determine this trend.
The second goal of our trading system is to avoid incurring double losses, meaning we do not want to be caught in the wrong trend. Our method of avoiding double losses is to confirm whether a new trend signal is real or false using other indicators.
There are many indicators that can be used to confirm trends, but we prefer using the smoothed moving average, stochastic index, and relative strength index. As you become more familiar with various indicators, you can find the ones you like and integrate them into your system.
Step 4: Clarify your risks.
When creating a trading system, it is very important to determine the size of the loss you can tolerate for each trade. Not many people are willing to discuss losses, but in fact, good traders think about how much loss they are willing to accept before considering how much they can earn.
The size of the loss you are willing to accept will differ from others. You need to determine how much breathing space your trading requires, and do not take too much risk on a single trade. In later courses, you will learn how to manage funds. Fund management has a huge impact on how much risk you undertake in each trade.
Step 5: Clarify entry and exit.
Once you have determined the size of the loss you are willing to tolerate in trading, the next step is to find out where to enter/exit to maximize your profit.
Some like to enter trades immediately when their indicators align and provide good signals, even if the candle has not yet closed. Others will wait until the candle closes before entering.
A trader stated that he believes waiting for the candle to close before entering is the best choice. He has entered multiple times when all indicators aligned before the candle closed, only to find that at the close, the trade was completely opposite to his expectations.
This is just a matter of trading style. Some traders are more aggressive, and in the end, you will find out what kind of trader you are.
When it comes to exiting, you have several options. You can move your stop-loss; if the price moves X points in your favor, adjust your stop-loss up by X points.
Another method is to set fixed targets; exit when the price reaches the target. How you calculate your target points depends on you. Some choose to use support and resistance levels as their targets.
Some people set the same point for each trade. No matter how you calculate your target, make sure to stick to it. Don’t exit early no matter what happens. Stick to your system! After all, you created it.
Another way to exit is to have a standard; when the standard is met, you exit. For example, if your indicator retraces to a certain level, you exit.
Step 6: Write down the rules of your trading system and follow them.
A quality that traders must possess, therefore you must act according to the trading system. If you do not follow the rules, your trading system is useless, so remember to stick to your principles.
One tree cannot make a forest; a lone sail cannot sail far! In the crypto space, if you don’t have a good community and first-hand information, then I suggest you follow me, and I will help you make profits! Welcome to join the team!!!#币安HODLer空投FF #加密市场回调 $ETH
