

Bitcoin stepped into Sept. 23, 2025, priced at $113,014 with a $2.25 trillion crown on its head. Traders pushed $52.16 billion through the books in 24 hours, watching the coin bounce between $111,644 and $113,384 like a caffeinated pinball.

Bitcoin
On the daily chart, bitcoin’s got the look of a tired champ — a rounded top after flexing at $117,968, then tumbling to $111,571. Today’s candle hints at a recovery near $113,000, but the vibe is still bearish. Oscillators — relative strength index (RSI), stochastic, and average directional index (ADX) — are shrugging in neutrality.
Momentum fired a cheeky buy signal, but the moving average convergence divergence (MACD) stayed grumpy and bearish. Short-term moving averages are mostly red flags, except the 30-period simple moving average (SMA), which gave a polite nod toward the bulls.
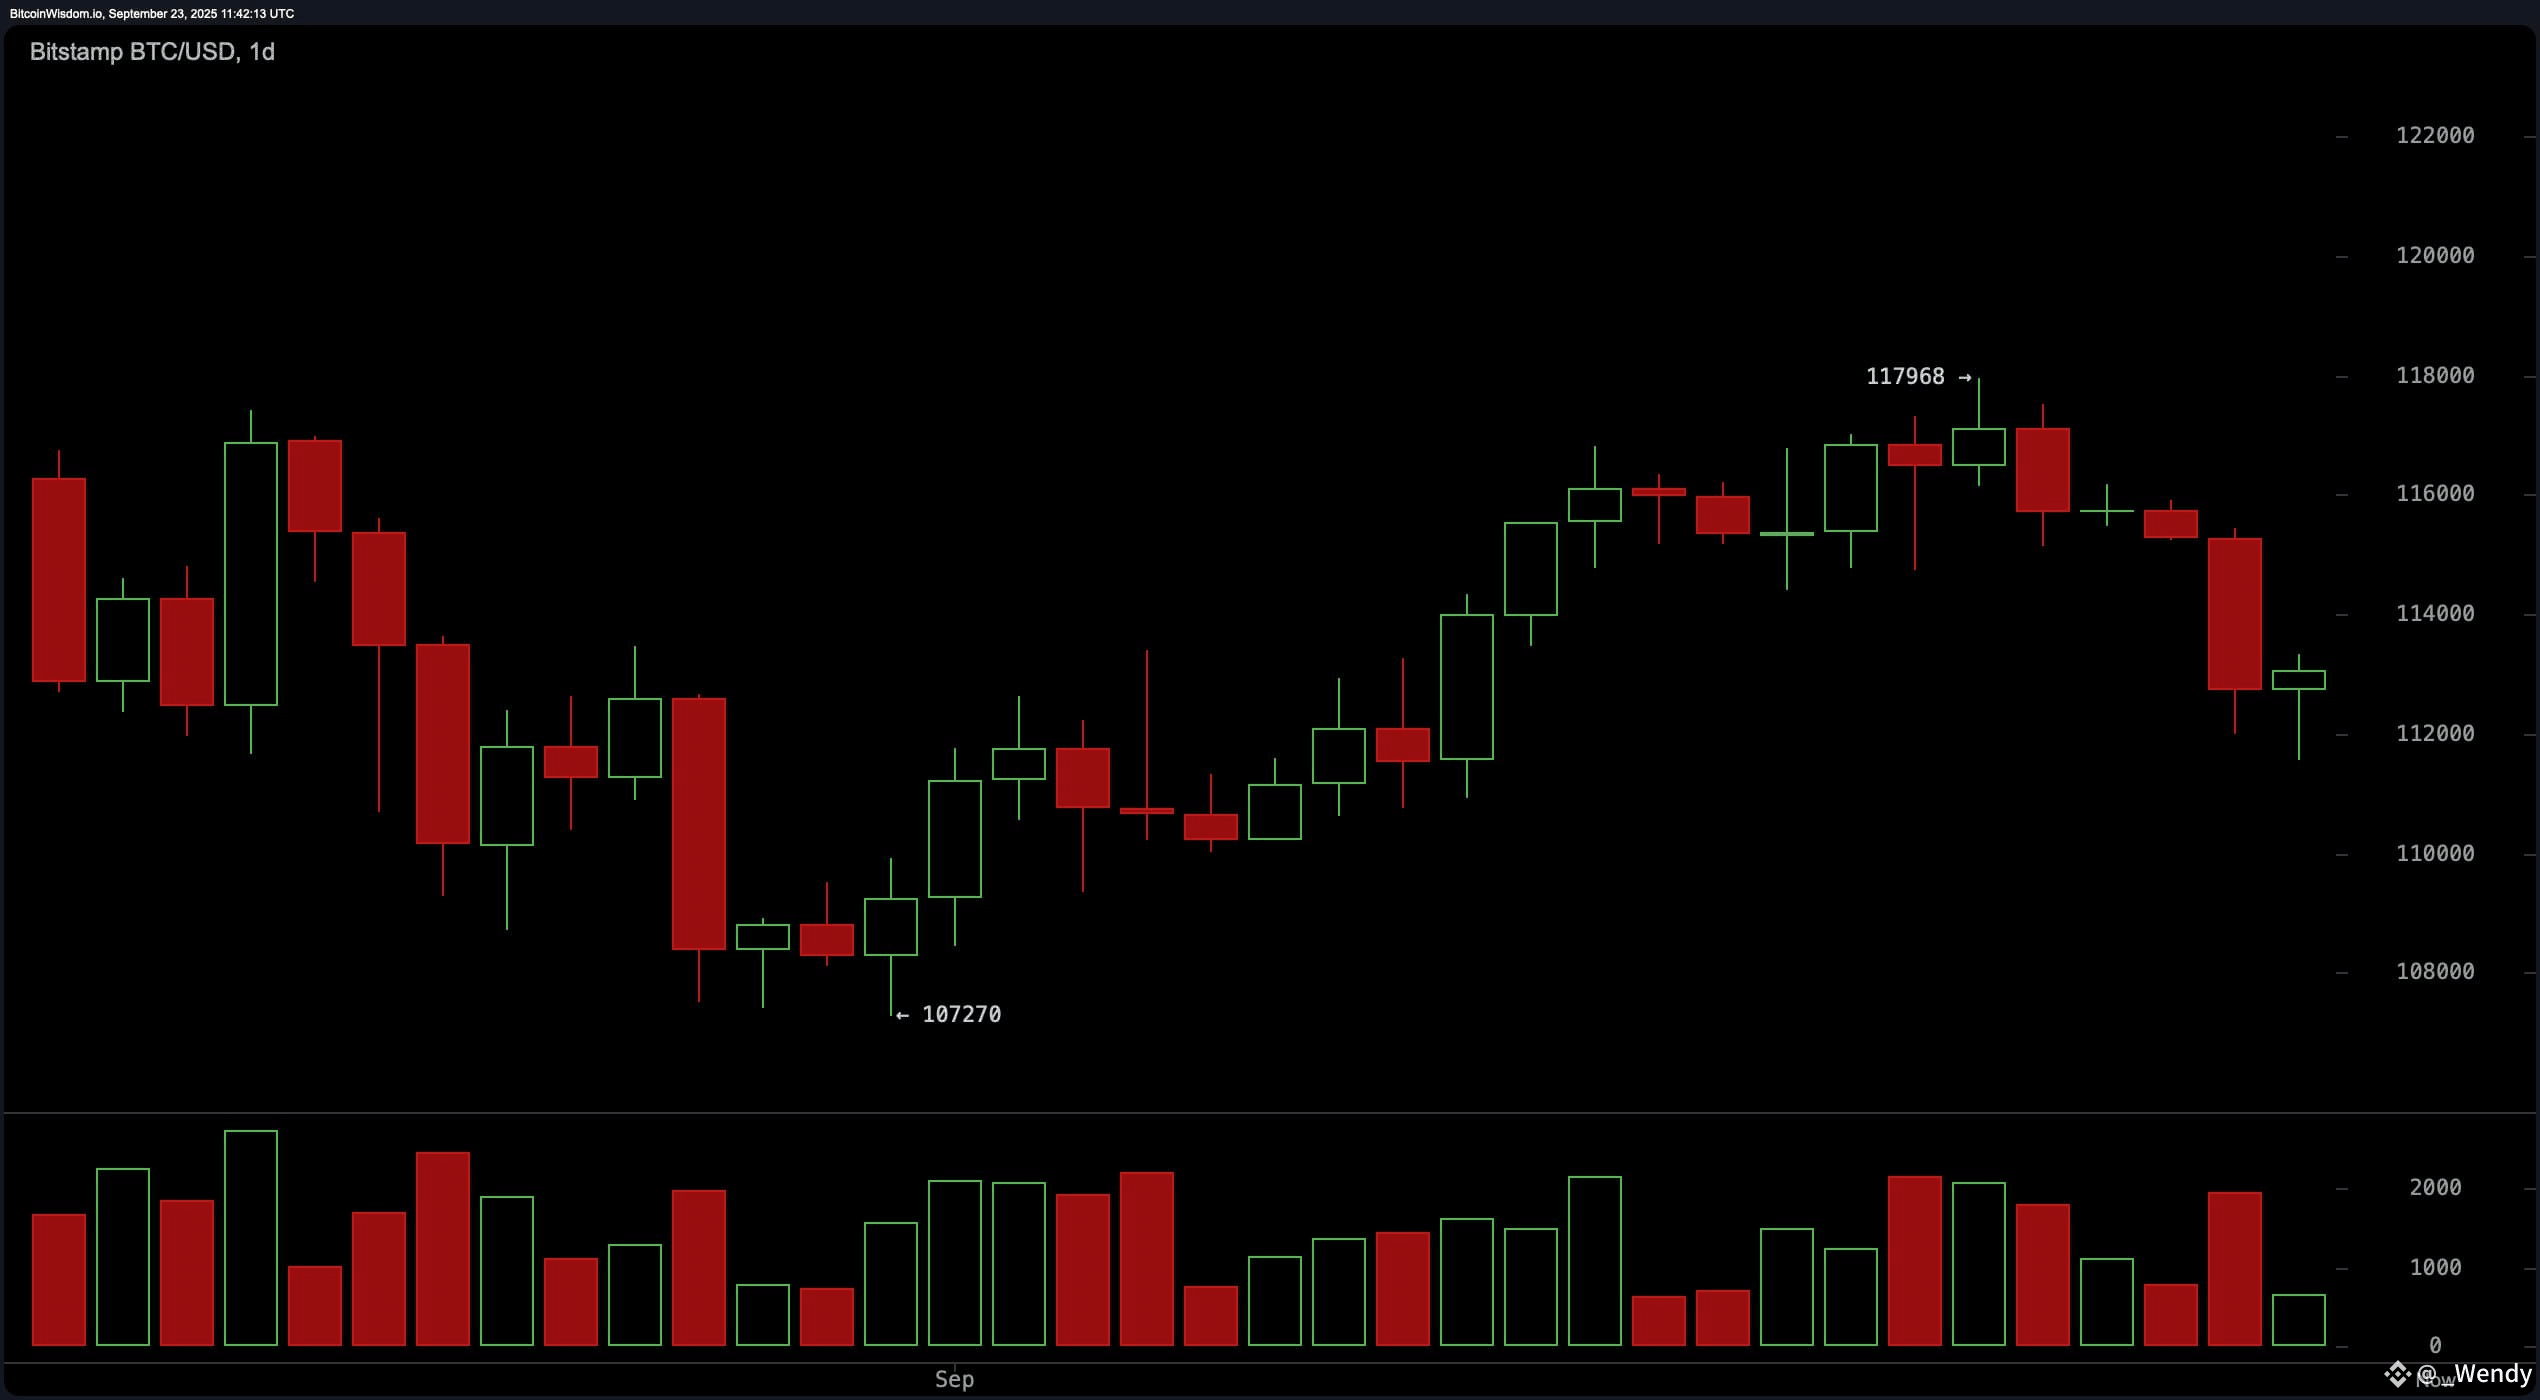
BTC/USD via Bitstamp on Sept. 23, 2025. Daily chart.
The 4-hour chart shows bitcoin tiptoeing toward recovery, still shackled to a downtrend since its $117,968 peak. A faint bullish divergence peeks through, suggesting price action might be hunting for a bottom as RSI begins to wink higher. Traders have their eyes on the $111,571 to $113,500 zone for entries. Resistance lurks around $114,500 and $116,000. Oscillators kept playing Switzerland, but a breakout over $113,500 with some muscle in volume could shift the short-term mood from meh to mildly bullish.
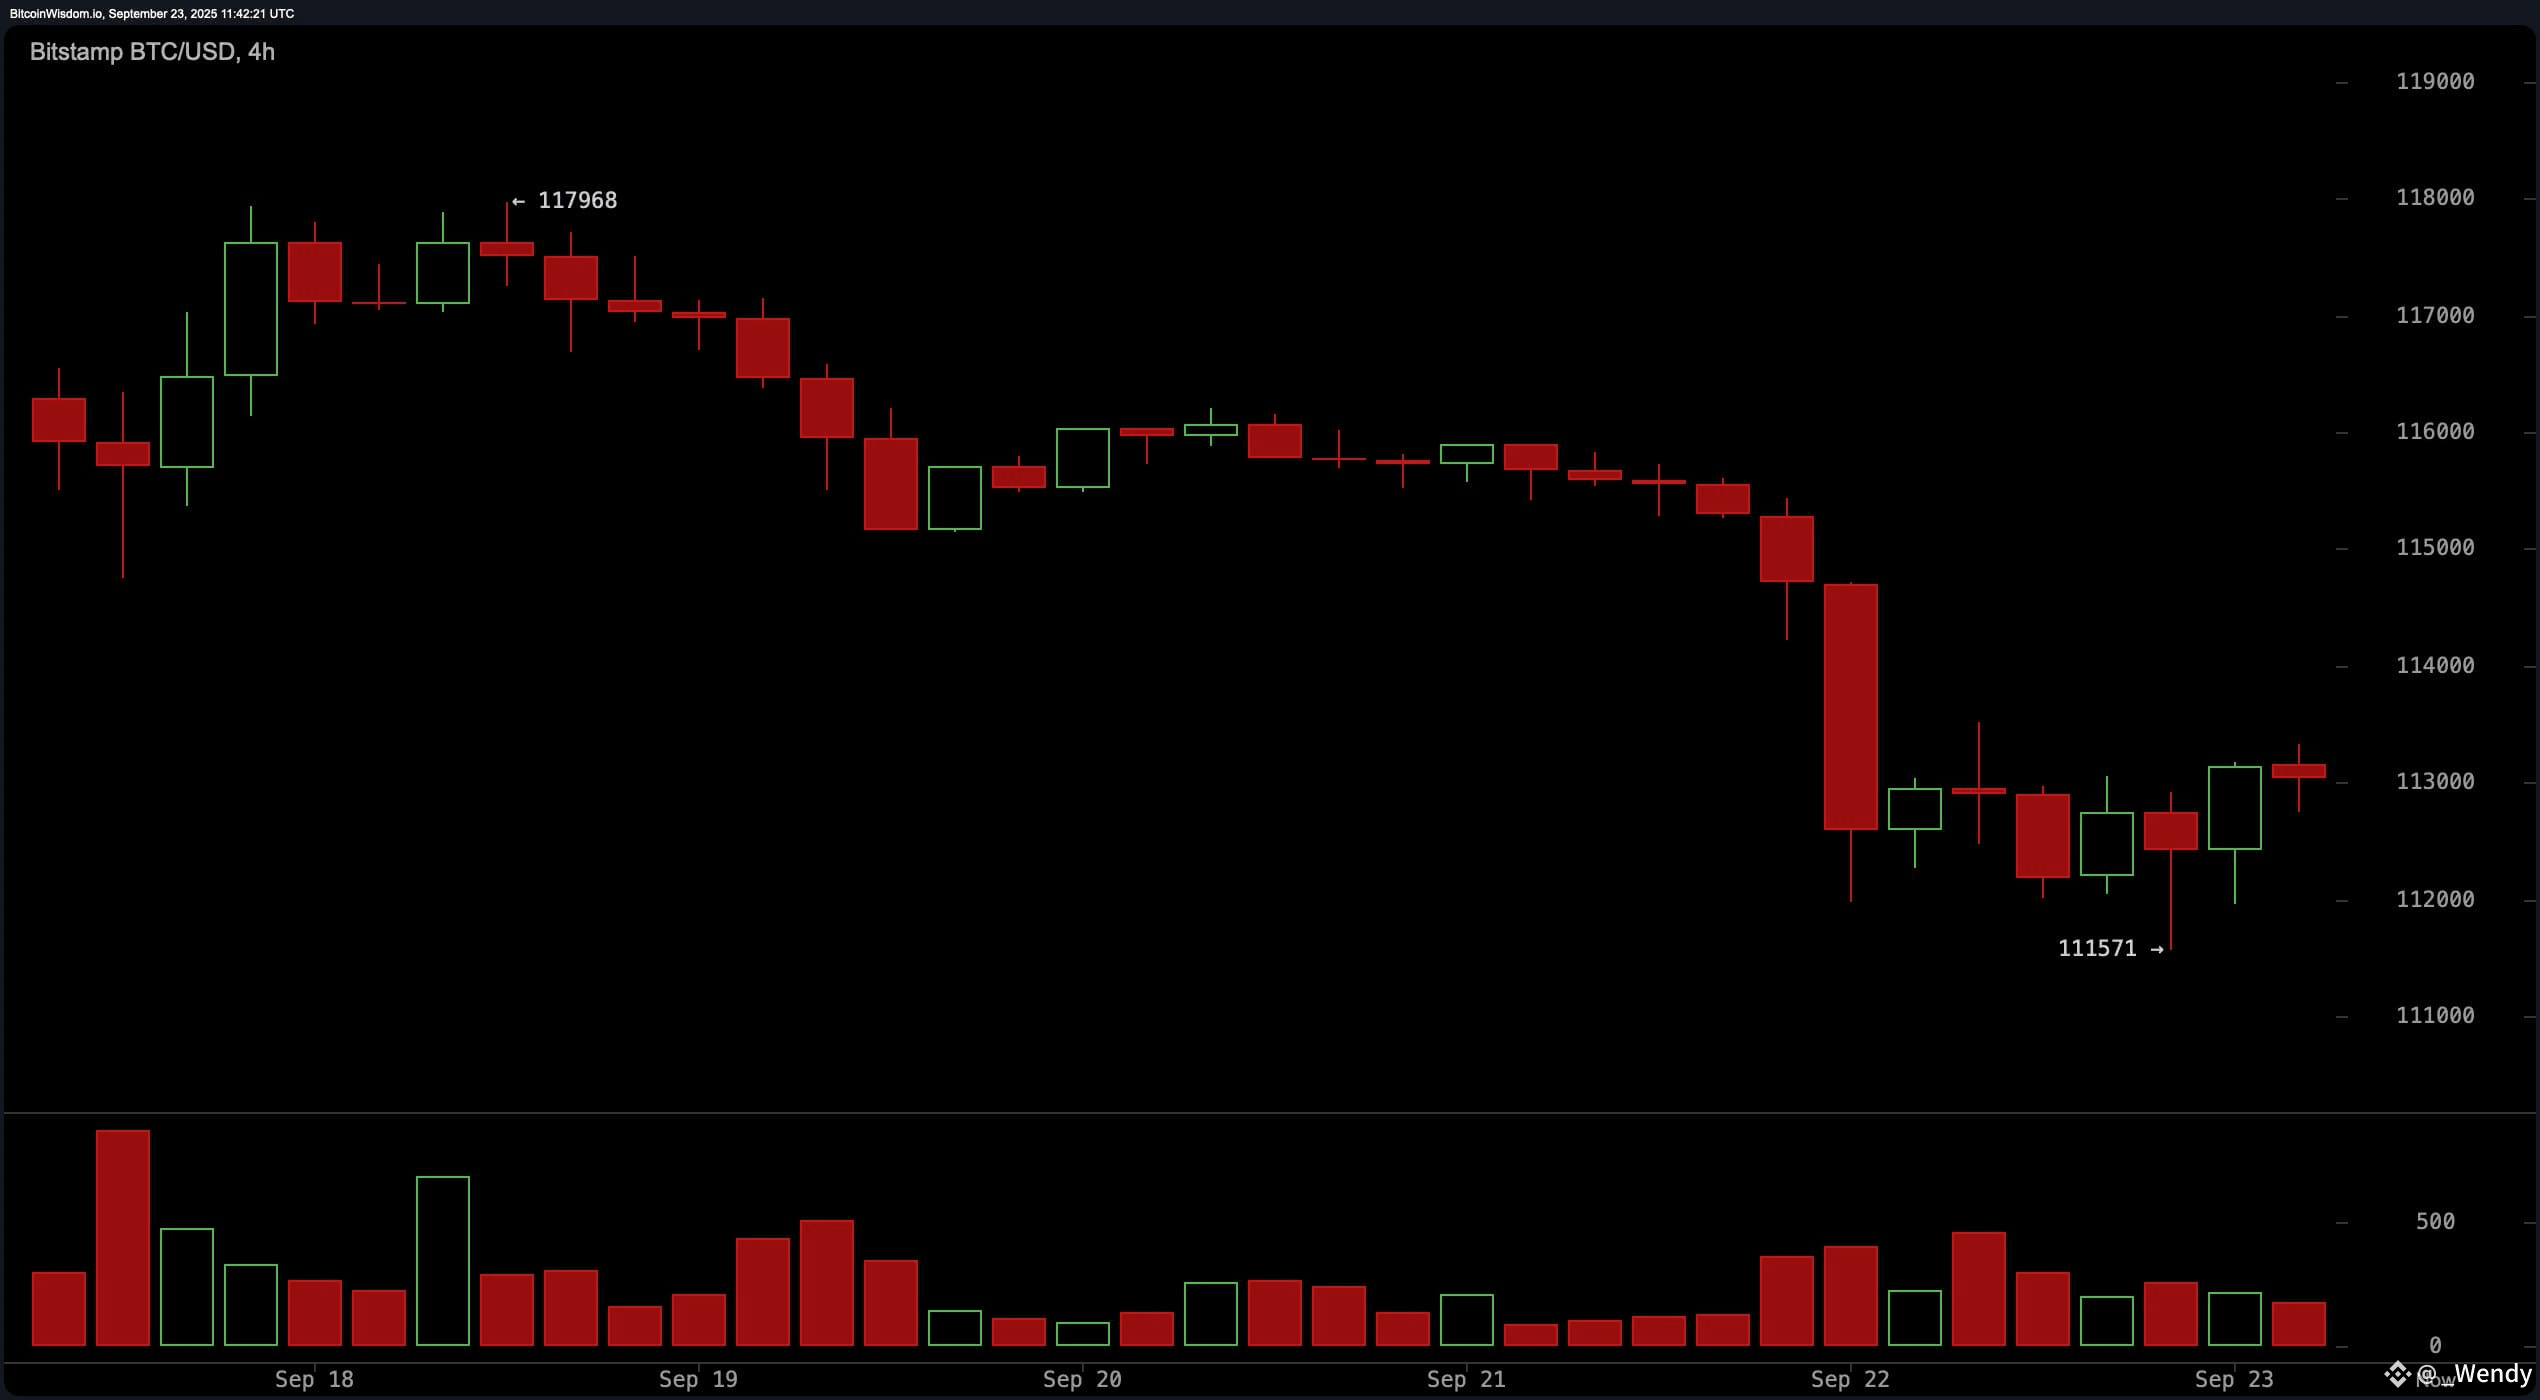
BTC/USD via Bitstamp on Sept. 23, 2025. Four-hour chart.
Zooming into the 1-hour chart, bitcoin’s flashing a double bottom near $111,571 — the classic “don’t count me out yet” move. Green candles are creeping back in, giving scalpers a potential playground between $112,000 and $112,500. Confidence grows if the coin busts through $113,300, with targets sitting at $113,500 and $114,500. The short-term outlook tilts bullish, but resistance is the bouncer at the door — proceed with caution.
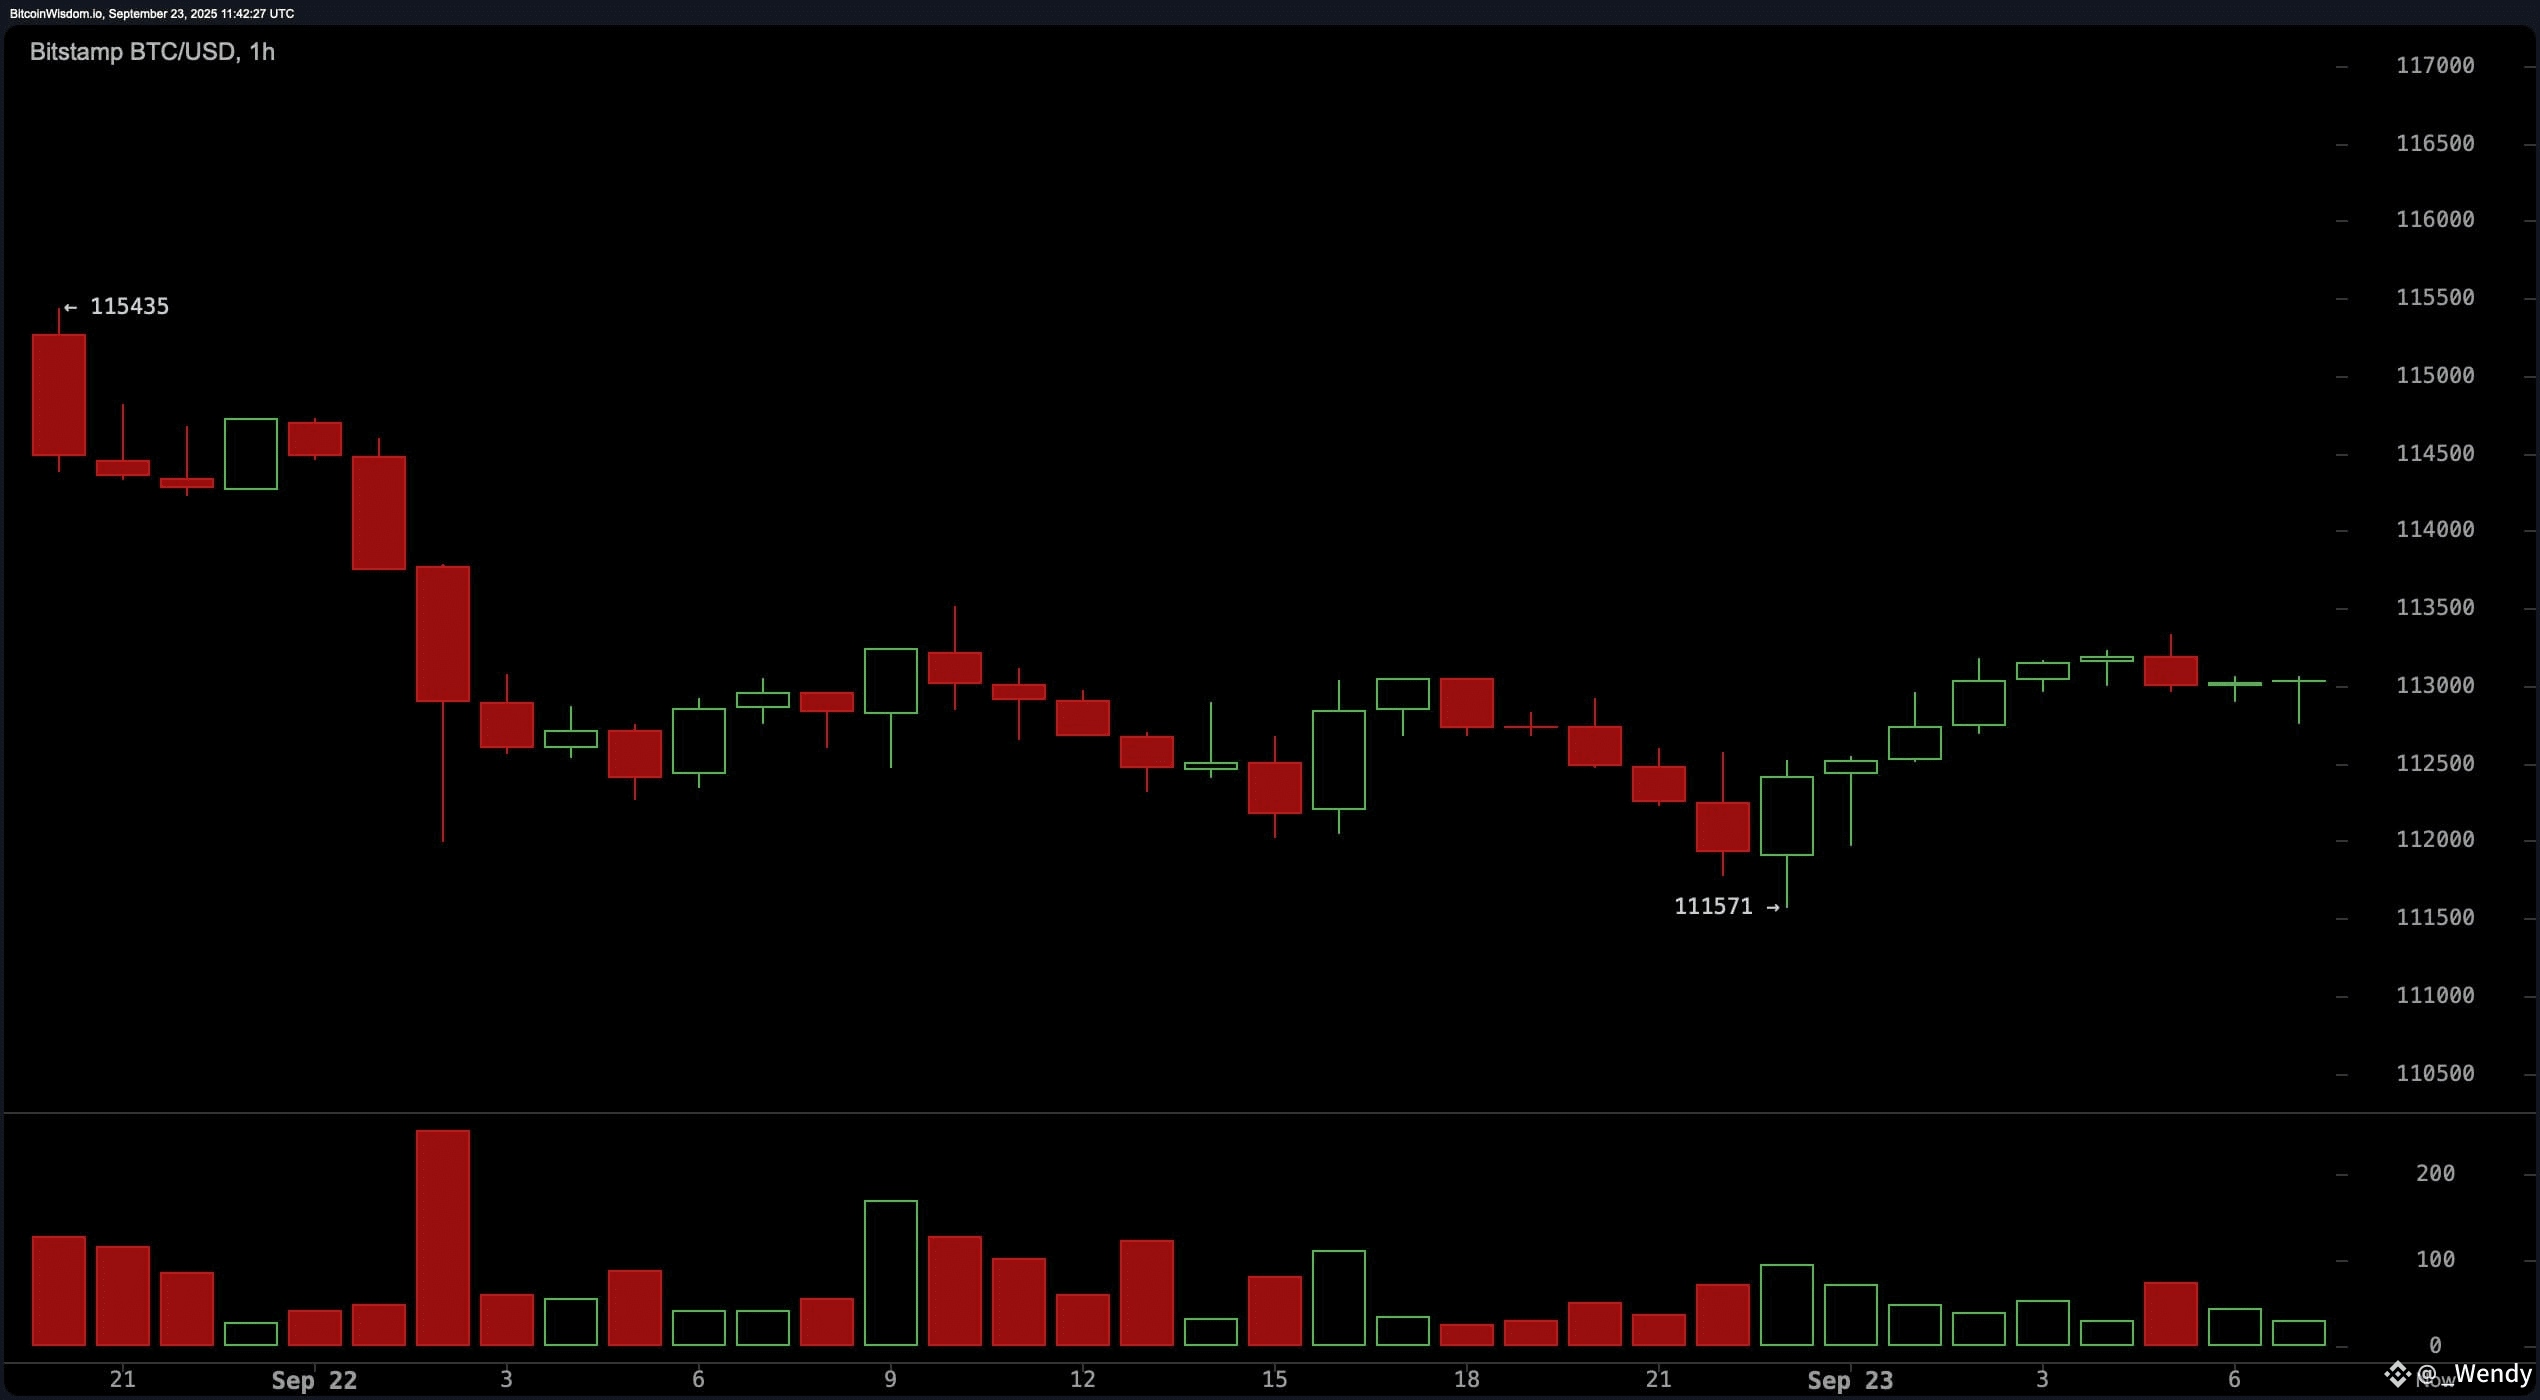
BTC/USD via Bitstamp on Sept. 23, 2025. One-hour chart.
Oscillators across timeframes? A muddle. The RSI parked at 46, neither hot nor cold. Stochastic at 40 sat on the fence. Commodity channel index (CCI) and ADX also threw up neutrality signs. Momentum, however, flashed a buy signal at −2,955, teasing strength. The MACD’s 370 reading, though, clung to its sell bias, reminding traders the bears still have claws unless momentum flips the script.
Moving averages joined the indecision party. The 10, 20, 30, and 50-period EMAs and SMAs all sang bearish tunes, while the long-term heavyweights — the 100-period EMA, plus the 200 EMA and SMA — backed the bulls with buy signals. Long-term support looks alive and well, but traders should keep a sharp eye on volume and set stop-losses just under $111,500 in case gravity takes another swing.
Bull Verdict:
Bitcoin’s short-term swagger may be shaky, but hints of bullish divergence, a momentum buy signal, and long-term moving average support suggest it could be setting up for a rebound. If $113,000 holds and $113,500 cracks with volume, a sprint toward $116,000 isn’t out of the question.
Bear Verdict:
The bear case still prowls. With MACD flashing sell, most moving averages leaning bearish, and no volume punch to confirm optimism, bitcoin could stumble back to $111,500 before anything sustainable develops. Until resistance caves, the bulls are just shadowboxing.
