🚀 B2/USDT Detailed Market Analysis 🚀
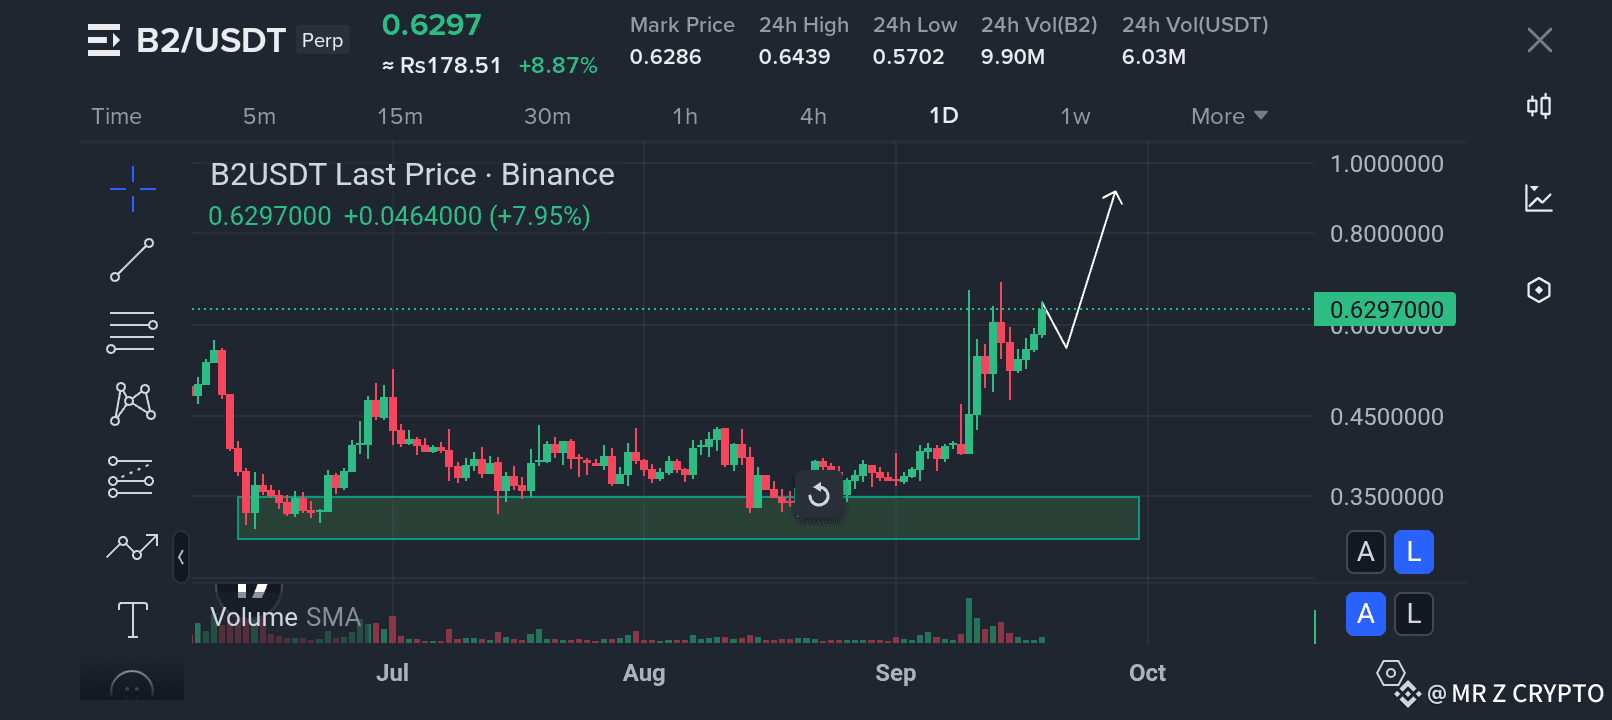
Today’s chart of B2/USDT is showing a very strong bullish structure. The price is currently trading around 0.6297 USDT (+7.95%) and this move is backed by increasing trading volume – which means buyers are actively entering the market.
📊 Technical Outlook:
After a long consolidation phase inside the green accumulation zone (0.35 – 0.45 USDT), the breakout has finally happened. This breakout is very important because it signals a possible shift from a sideways market into a new bullish trend.
✅ Support Zone: 0.45 – 0.50 USDT → This is the zone where buyers are strongly defending. As long as the price stays above this level, the trend remains bullish.
✅ Immediate Resistance: 0.70 – 0.80 USDT → If this level breaks with strong volume, we can expect further rally.
✅ Major Resistance / Target Zone: 0.90 – 1.00 USDT → A psychological and technical barrier. Crossing this could bring even bigger gains.
⚡ Why This is Important:
Strong breakout after months of sideways consolidation.
High buying volume supports the move.
Clear bullish momentum visible on daily timeframe.
🔮 Possible Scenario Ahead:
If B2 sustains above 0.60 USDT, the next likely targets could be 0.75 → 0.85 → 1.00 USDT. Short pullbacks may happen, but as long as support holds, the upward trend is intact.
📈 Conclusion:
B2 is showing strength and buyers are in control. Trend remains bullish as long as price holds above 0.45 – 0.50 USDT. A breakout above 0.80 could trigger a rally towards 1.00.
👉 Always remember: trade with proper risk management and never invest more than you can afford to lose.
---