It is not uncommon for someone to make 10 million from 60,000, and 80 million is not surprising. Having this kind of model in the cryptocurrency circle is the essence, without relying on anyone's guidance. Although it's not like some people who turn 10,000 into two small goals, ultimately, the difficulty in making a profit is not the strategy, but its implementation. "When the coin price remains below the 30-day moving average for three consecutive days, one must decisively liquidate, without any illusions whatsoever." Just this sentence has eliminated 80% of the people.
Everyone's initial intention in entering the cryptocurrency circle is the same, this is beyond doubt. If you are just here to pass the time with a casual mindset, then this place is not suitable for you.
Below is a list of all the blockchain categories, leading currencies, mainstream currencies and altcoins that you need to know before entering the cryptocurrency circle. This will save you the effort of sorting out the details. You can like and save it!
【Contract Master】Contract World
1. Moving Average
The moving average (MA), also known as the moving average, is an important indicator. It's concise and clear, clearly showing the market's trajectory. It helps us match and integrate candlestick patterns, combining different candlestick patterns and indicators to identify optimal market trends.
2. What is a moving average?
The principle behind the moving average (MA) indicator is simple: it plots the average closing price over a specific timeframe on a candlestick chart and connects these average points to form a line, creating the moving average. The MA can also be used as a trendline indicator. When the MA is above the MA, the market is strong, with a high probability of continued growth. When the MA is below the MA, the market is weak, with a high probability of continued decline.
3. Set the MA indicator:
Common settings are: 5, 10, 30, 60, 120. If you set a 5-day moving average, fill in the number 5. The moving average was originally set based on the trading date of the stock market, but the cryptocurrency market is a 24/7 non-stop trading market, so the corresponding indicators can be adjusted according to personal habits, such as 7 days, 14 days, 30 days, 90 days, 180 days, etc.
4. Different periods and applications of moving averages:
According to the length of time, the moving average can be divided into: short-term moving average, medium-term moving average, and long-term moving average.
The 5-day, 10-day and 5-week moving averages are used for short-term fluctuations.
The medium-term market uses the 30-day line and 60-day moving average.
The long-term trend uses the 120-day or 360-day level.
In financial markets, the 20-, 30-, 60-, 120-, and 200-day moving averages often play a decisive role in determining medium- to long-term price trends. The 30- and 60-day moving averages are the lifelines of the medium-term trend, their direction indicating whether the price trend is bullish, bearish, or sideways. The 120- and 200-day moving averages are the lifelines for bull and bear markets.
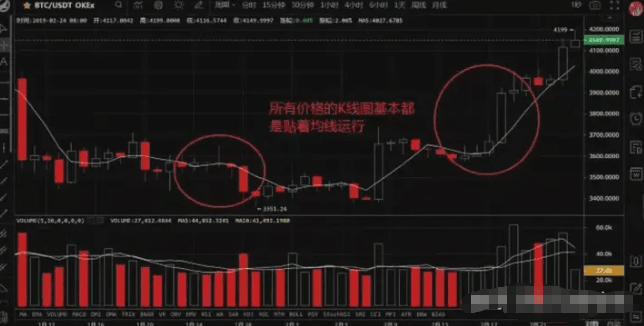
For example, the 5-day moving average: When the price deviates significantly from the 5-day moving average, it will pull back (or retrace). The 5-day moving average is a short-term moving average with a relatively fast reaction speed. The 10-day moving average and the 5-day moving average have similar functions.
As shown in the figure, only the 5-day moving average is shown for ease of viewing. You can see that all price candlestick charts, whether closing or opening, are closely aligned with the moving average. The shorter the moving average, the closer the candlesticks are to the moving average.
5. The inclination direction and angle of the moving average:
An upward sloping moving average indicates an upward trend. A downward sloping moving average indicates a downward trend. A horizontal moving average indicates sideways trading with minimal volatility.
An upward trend in the moving average is the best, and it is not advisable to intervene if the moving average is clearly downward.
The upward angle of the moving average is too steep, the market trend lasts for a short time, and the price fluctuates greatly.
The greater the downward angle of the moving average, the greater the decline and the greater the price volatility.
45 degrees upward is the perfect angle, rising steadily.
6. Combination patterns of multiple moving averages: divided into: entanglement and divergence.
① In a clear uptrend or downtrend, the moving averages of each period basically move upward or downward in sequence. This state is called moving average divergence. An upward arrangement indicates a bullish trend, while a downward arrangement indicates a bearish trend.
② When the moving averages shift from divergence to entanglement, the momentum of the market's rise or fall is weakening. The short-term moving average will fluctuate around the long-term moving average. The longer the entanglement, the greater the momentum of the outbreak. Therefore, the longer the sideways bottoming period, the greater the increase. During this phase, it is advisable to wait and see or trade in the short term.
7. Golden cross and dead cross of moving average:
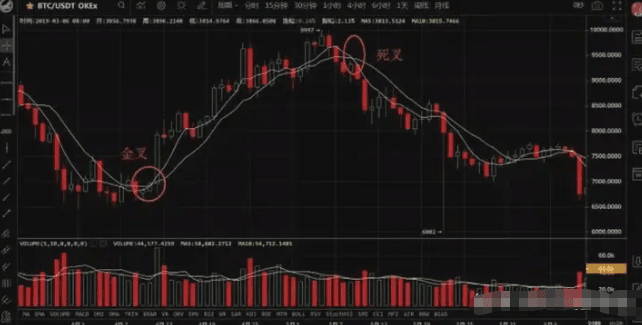
① A traditional short-term moving average golden cross occurs when a short-term moving average crosses over a long-term moving average, such as the 5-day moving average crossing over the 10-day moving average. If all moving averages diverge upward, and the price remains above the 5-day and 10-day moving averages, this indicates a price increase. This phenomenon, if accompanied by incremental growth, suggests a strong bullish outlook.
②When the short-term moving average crosses the medium- and long-term moving averages downward, the cross is called a death cross, which indicates that the price of the currency will fall.
Note: Not all golden crosses and death crosses are buy and sell points. Some may be market makers' shock wash or shock selling.
8. In actual operation:
Judgment basis: whether the K-line runs above or below the moving average, the distance between the K-line and the moving average, whether the moving average itself is rising, horizontal or downward, the angle of inclination of the moving average, etc.
For example: If the K-line is above each moving average and the moving averages are tilted upward, the market is in an upward trend.
No indicator is omnipotent, and the same goes for moving averages. Not all market conditions can be used as reference for moving averages. For example, when the market fluctuates, the moving average will form a sticky state with no obvious direction of movement. At this time, the moving average is unreliable.
Since the moving average is calculated based on the average price, it has a slight lag in its response. The longer the period, the more obvious the lag, but the stronger the stability. Therefore, it is important to choose an appropriate moving average based on your operating habits. Commonly used ones are the 5-day moving average and the 10-day moving average.
The moving average has a strong regularity. If the recent price moves upward along the moving average trajectory, once it falls and breaks below this moving average, you must be vigilant.
You can look at each level of moving average in turn, and once you have a good understanding of this moving average, you can add other moving averages to assist in your judgment. Practice more and apply them rationally.
Why do most retail investors lose money? It's not because they don't know how to choose a cryptocurrency. A major reason is that they don't know how to operate. They either trade frequently or go all-in, without understanding the overall trends of the cryptocurrency market.
Watching the market every day when you have time, panicking when seeing a drop, and tempted to trade, can easily lead to missing out on big gains. Sometimes, even when a coin is clearly trending downward, you still hold on, mistaking short-term trades for long-term holdings, ultimately leading to ever-increasing losses. The right approach is to choose a coin with strong fundamentals and promising growth potential, and hold on to it as long as it's on an overall upward trend.
2. Falls create opportunities, rises create risks. Retail investors often chase rising prices and fear declines. They become frustrated when their holdings don't rise for a day, and they try to chase rising coins, only to end up stuck at high levels. They can't handle major price fluctuations in their holdings, regardless of the broader trend. The result is missing out on strong coins and big profits. In reality, declines are opportunities, especially pullbacks with reduced volume during an uptrend; these opportunities are golden opportunities.
3. Only operate within your own system. Once you have your own trading system, you'll find that cryptocurrency trading becomes effortless. You'll no longer be drawn to market trends, but instead maintain a calm mind. For example, if I'm trading based on trend value, I'll only look for undervalued sectors with strong fundamentals, add them to my watchlist, and when market capital enters, I'll follow the trend and trade. Once I've made a profit, I'll exit and look for the next target. It's a clean and efficient process. Therefore, I rarely get stuck at high prices; I only exit if the price doesn't perform as expected.
4. Set stop-loss and take-profit points. Cryptocurrency trading is inherently probabilistic, with both success and failure. For most cryptocurrency traders, setting stop-loss and take-profit points is crucial.
When the price of a currency falls short of expectations or falls below the trend, you must unconditionally stop loss and do not waste time. Similarly, if the price of the currency has already made a lot of profit, it is a good decision to exit at any time. Don't feel sorry. Very few people can withdraw at the highest point. For us, exiting at a relatively high point is enough.
5. Learn to split your positions and don't put all your eggs in one basket. For example, if you're very optimistic about a coin and go all in, only to end up with a 10% loss, you're helpless and can only watch helplessly. However, if you've invested 30%, you can choose to cover your position or exit the market, as the loss won't have a significant impact on the overall situation.
6. Be patient. Waiting is also a form of operation. We are not gods. We can't make a profit as soon as we enter the market. Many times, we need to wait, and time can make up for mistakes in operation. If your cryptocurrency trading skills are not good, then use time to make up for it.
Learn to use K-line in 10 minutes
K-line charts are a must-read for anyone entering the secondary market. K-line charts, also known as candlestick charts, originated during the Tokugawa Shogunate era in Japan. Invented by Homma Munehisa, they were first used to record rice market prices. Their sophisticated and unique plotting techniques later led to their introduction into the stock and futures markets. Through K-line charts, we can visualize market fluctuations, including opening and closing prices, as well as highs and lows, over a specific period.
Let’s first look at the K-line screenshot:
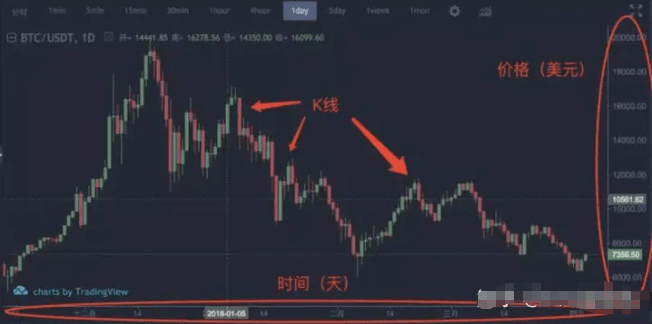
This is the daily K-line chart of BTC (Bitcoin)
The horizontal axis represents time (in this chart, units are days), the vertical axis represents units (in this chart, units are US dollars), and the red and green bars in the chart are individual candlestick patterns. Each candlestick (bar) represents the price fluctuations in the market over the course of a day. By connecting the candlestick patterns for each day, we obtain a candlestick chart that reflects market trends. Two charts explain the candlestick pattern:
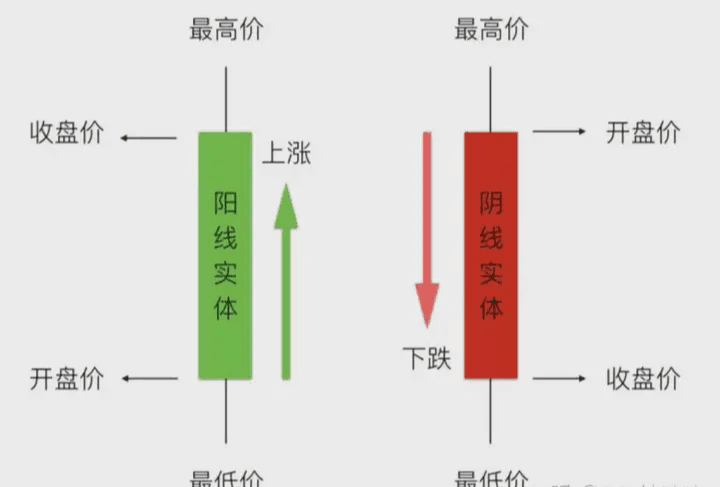
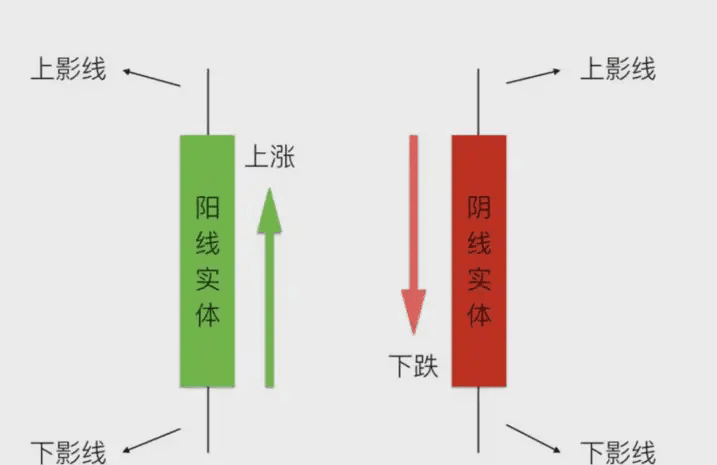
Each candlestick chart represents four daily prices: the highest price, the lowest price, the opening price, and the closing price. The area between the opening and closing prices is drawn as a "rectangular solid," and the highest and lowest prices are connected by a line. The combination of the two forms the candlestick chart.
When the closing price is greater than the opening price, the bar is green and the price rises, which we call a bullish candlestick.
When the closing price is lower than the opening price, the bar is red and the price falls, which we call a negative line.
Regardless of whether it is a negative line or a positive line, the straight line that protrudes upward from the column is collectively called the upper shadow line, and the straight line that protrudes downward from the column is collectively called the lower shadow line.
Now let’s go to the actual K-line chart and see how to use the K-line chart to judge market trends!
Single needle bottoming
Let’s look at the K-line chart of BTC in February:
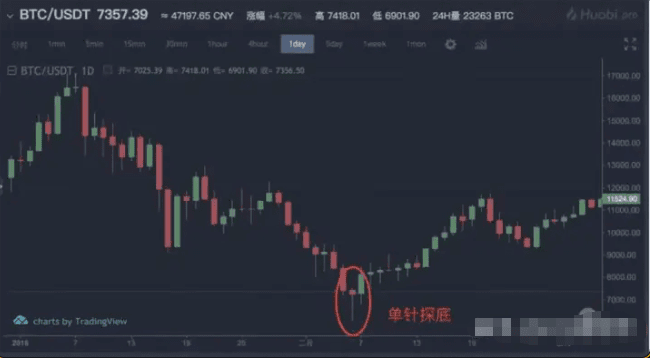
After reaching the highest point of 20,000 on December 17 last year, the market continued to fall until it reached the red circle position, where it reversed and formed the first strong rebound.
Pay attention to the K-line pattern in the red circle. The column itself is short, the upper shadow line is also short, almost non-existent, but the lower shadow line is extremely long. Such a K-line is a strong bottoming reversal signal, called a hammer line. When the upper shadow line disappears, it is also called a single needle bottoming.
We list the criteria for judging the hammer line:
1. In a continuous downward trend, the bottom is at the lowest price of the downward trend;
2. The body is at the upper end of the range, and the color doesn’t matter.
3. The lower shadow is at least twice as long as the body;
4. It is best if the upper shadow line disappears. If it exists, it should be shorter than the length of the body.
Why does a hammer candlestick pattern often signal a market bottom? The principle is easy to understand. During a period of sustained decline, bearish sentiment still dominates the market, so prices continue to fall at the opening. However, over time, bullish investors believe that the price has reached a suitable level (most often, this is due to the main players entering the market. If this is accompanied by high volume, it will be a strong reversal signal). This causes prices to rebound rapidly, approaching or even exceeding the opening price, thus forming the hammer candlestick pattern we see.
Let’s take a look at a common K-line tactic used in actual combat.
rickshaw puller
As usual, here are the pictures:
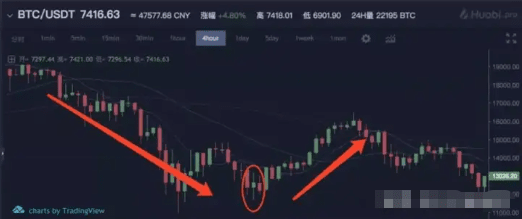
Let’s look at the 4-hour chart of BTC around December 24 last year.
In a wave of continuous decline, there were several rebounds, but they were not strong. However, in the red circle, the situation reversed and the first strong rebound occurred in a short period of time.
The K-line in the figure has a small body and long upper and lower shadows. We call this K-line with a small middle body but long upper and lower shadows a rickshaw puller line. When observing the rickshaw puller line, pay attention to the following points:
1. The entity is small or even non-existent;
2. The daily amplitude should be at least 3%, and generally 7%-8% is ideal;
3. The color of the rickshaw puller's line is not important.
The Rickshaw Puller pattern signals the end of a market trend. It's not necessarily a reversal signal; it may also be followed by price fluctuations (we call this range-bound price fluctuation an oscillation). In principle, during a downtrend, long upper and lower shadows indicate significant price volatility, but the body of the pattern is close to the center, indicating market indecision. Neither bullish nor bearish sentiment can fully dominate the market, making it likely that the previous trend will end, leading to a oscillation or reversal. Similarly, the appearance of a Rickshaw Puller pattern during an uptrend is also likely to signal the end of the uptrend.
I hope it can be helpful to everyone in actual combat.
A nanny-level tutorial on cryptocurrency position management
Whether in the stock market or the cryptocurrency market, if you manage your positions well, you will outperform most people.
The topic I’m going to share with you today is the management of trading positions. Whether it’s spot or contracts, how you manage your positions directly determines your risk control level, average holding price, and the final size of your profits. This can be said to be the most important point besides direction and mentality.
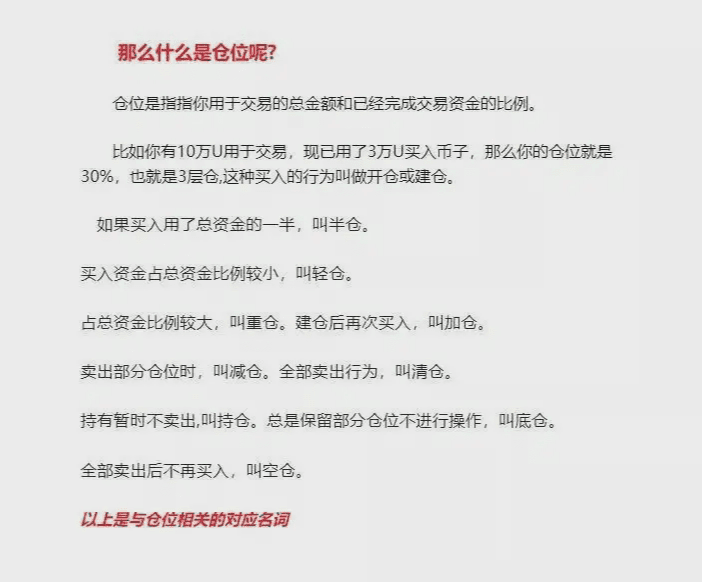
What is position management?
Position management refers to the specific strategies you develop for opening, increasing, decreasing, and liquidating positions when you decide to trade cryptocurrencies. Good position management is a key risk mitigation tool, minimizing losses and maximizing profits.
How to manage positions
Is there a standard for this? One of the key reasons many traders fail is that they treat market analysis as the be-all and end-all of trading, as if market analysis alone can determine success or failure. In reality, market analysis is only the most basic part of the equation; the real determinant of success or failure lies in the work that follows—the considerations after entering the market.
Position management encompasses both capital management and risk control. The word "position" shouldn't be taken as a literal definition; it more closely reflects when to add positions, how much to add, and where to reduce positions, and by how much. It's essentially a roadmap for "entering, increasing, reducing, and exiting a trade."
Then the complete transaction process should be:
1. Market analysis, you can use any technical analysis.
2. Position management. After entering the market, you need to consider what might happen next. What should you do if you make a profit? Should you add to your position, exit with a full profit, or continue holding? What if your profits increase again? What should you do if you incur a loss? Should you stop loss, hold onto your position, or exit partially? What is the maximum loss required before exiting completely? Position management considers both risk and reward.
3. Strictly execute transactions. Once you have a clear plan in mind, you should start implementing it and not let market fluctuations disrupt your thinking.
4. Summarize transactions. After a transaction is completed, it is necessary to review the transactions in the previous period. The review samples should cover three types of market conditions: rising, falling, and volatile. Based on this, the market analysis, position management, and transaction execution process can be improved and optimized.
We must first identify an entry point based on our trading techniques, and this point must be a support line. When the market is above the support line, the trend is upward, and when the market falls below the support line, the trend is downward. More importantly, the support line is also the basis for defining potential risk. When the stop-loss is placed below this support line, the potential risk range is determined. If the initial stop-loss area below the support line is reached, it is necessary to exit the market or close the majority of the position first, and then gradually reduce the position as the price continues to fall, until all positions are closed.
Then, the potential profit range is above the support line. The upward trend of the market has not ended, so the potential profit is theoretically unlimited. After entering the market, if the price rises, we can hold the original position and wait for it to rise, or gradually increase the position based on the original position.
We will move our stop-loss orders based on market developments. When the market moves as expected, we should move the stop-loss order closer to the cost price or below the support line with a certain margin. Moving the stop-loss order continuously reduces the risk in the market, effectively locking in floating profits.
When the price rises to a new support or resistance level and then starts to fall back, then the area below this support or resistance level is the position reduction area, at this time we need to gradually close all positions. To summarize: First, we need to find a support or resistance line of the cost price. When the price rises away from the cost line, we gradually increase our position, and the increase in position must be decreasing. When the price falls away from the cost line, we gradually reduce our position, and the reduction in position is also decreasing. Your position management technology must take into account both risk and return.
Six basic principles of position management:
First: Don’t operate with a full position, always keep a certain proportion of reserve funds:
Second: Buy and sell in batches to reduce risk, spread costs, and maximize returns. The advantage of buying in batches downwards and selling in batches upwards is that your average price is lower than others and your returns are higher.
Third: When the market is weak, you should hold a light position. In a bear market, it is best not to hold more than half of your position. In a strong market, you can increase your position appropriately. In a bull market, the recommended maximum position is 8 levels, leaving 20% for short-term trading or as a reserve fund to deal with unexpected events.
Fourth: As the market changes, corresponding position adjustments should be made, and positions should be increased or decreased appropriately.
Fifth: When the market is sluggish, you can go short in the short term and wait for opportunities to come.
Sixth: Position Change: Keep strong currencies and sell weak currencies
The above 6 principles apply to both spot and contracts. If you still don’t understand, please read them carefully several times. By reviewing the old and learning the new, you can become a teacher!
Let's talk about the method of position management, which is to operate in batches.
Batch operation refers to the act of dividing the invested funds, building positions in batches, increasing positions or reducing positions. Batch operation can be completed within a day or within a period of time.
Why do we need to do these actions? Because the currency market is unpredictable, and rises and falls are high-probability events. No one can accurately predict short-term price fluctuations, so we must set aside enough funds to deal with unpredictable fluctuations.
If you go all-in without sufficient confidence, you could suffer huge losses if the market changes in the opposite direction. Therefore, you can reduce the risk of going all-in by trading in batches, which can spread the cost and is the basis for reducing costs and maximizing profits.
Next, let's talk about how to batch: there are two types: equal batching and non-equal batching.
First: Equal distribution, also known as the rectangular buying and selling method, refers to dividing funds into several equal parts, buying or selling in sequence, and the proportion of funds bought and sold each time is the same. Usually 3 or 4 equal parts are used. For example, buy 30% first, and if you start to make a profit, buy another 30%. If there is no profit, no new funds will be involved for the time being. When the price of the currency reaches a certain high point or the market changes, reduce the position and sell in batches.
Second: Non-equal distribution, which means buying or selling funds in different proportions, such as 1:3:5, 1:2:3:4, 3:2:3 and other different proportions. The shapes generated according to the proportions are divided into: diamond, rectangle, hourglass, etc. The most commonly used is the pyramid buying and selling method.
Third: With the same capital and the same position, use different methods for comparison.
Pyramid: 1000 to buy 5 floors, 1100 to buy 3 floors, 1200 to buy 1 floor, average price 1055
Inverted pyramid: 1000 to buy 1 layer, 1100 to buy 3 layers, 1200 to buy 5 layers, the average price is 1144
Equally divided rectangle: 1000 to buy 3 layers, 1100 to buy 3 layers, 1200 to buy 3 layers, average price 1100
When the price rises to 1200, the profits are: Pyramid 145, Inverted Pyramid 56, Rectangle 100. When the price falls to 1000, the losses are: Pyramid +55, Inverted Pyramid -144, Rectangle -100.
By comparison, we can see that the pyramid type has the lowest cost and greater profits when prices rise. When prices fall, the risk is greater. The inverted pyramid is just the opposite. If the price falls to 1,000, the inverted pyramid loses 144. In actual application, it is more reasonable to use the positive pyramid method when buying and the inverted pyramid method when selling.
After the currency price drops sharply and reaches the bottom but we are not sure whether it has reached the bottom, if we buy at this time, we are afraid of being trapped in a further decline; if we do not buy, we are worried that the market will reverse and rise and we will miss out. In this case, we can use the pyramid position building method.
For example: A certain currency falls to 10U, and you buy 20% of the position. The price drops to 8U, and then enters 30%. At this time, the average cost is 8.6U. If the market continues to fall to 5U, and then enters 40%, the average cost is 6.5U.
If the price rebounds to 6.5 yuan, it is considered to be capital preservation. If it rebounds to 10U, it is equivalent to earning 3.5U. But if you buy in full at 10U, you will just get out of the predicament when the price returns to 10 yuan.
During the rise of the currency price, the lower the price is, the larger the buying position should be, and the position should be gradually reduced as the price gradually rises. This buying method belongs to the right side of building a position. Such a cost is relatively safe. Even if the market falls, as long as it does not fall below the holding cost, there is no need to panic.
This method has a heavy initial position, so the requirements for first entry are relatively high. It requires a grasp of market fluctuations and is suitable for technical players.
The inverted pyramid selling method is the opposite of the positive pyramid. It is wider at the top and narrower as it goes down, shaped like a funnel. When the price of the currency rises, the number of coins held is gradually reduced, that is, the number of coins sold increases as the price of the currency rises. This is the method of reducing or clearing positions.
The core of position management is the above points. After understanding them, I believe that in the future, whether it is opening a spot position or a contract position, you will have an idea.
If you can see this, then I believe you are definitely a loyal fan of the cryptocurrency world!
Now let's get into the actual combat teaching! (The following text will be explained in plain language, I am afraid you won't understand!)
Spot warehouse management
Example: If you have 100,000 U, you need to divide it into ten parts! Prepare to buy ten coins! Allocate 10,000 U to each coin! The amount of money you invest in each time is the same!
For example: Open a position in XX currency, 50% of the position at XX price, and add 50% of the position at XX price. The 50% position means that according to the standard of allocating 10,000U to each currency, 5,000U is reserved for opening a position and 5,000U is reserved for adding a position.
The biggest taboo in spot trading is to hold a large position in the stocks you are optimistic about and a small position in the stocks you are not optimistic about!
This coin is good. I will buy more, 30,000 U.
This coin is average, I bought 10,000 U.
When trading, you should buy the same amount of each coin and strictly follow the above example! If you don't follow this position, a problem will occur. If your heavy position of 30,000 U coins loses 10%, that's 3,000 U. Then, even if your light position of 10,000 U coins increases by 10%, that's only 1,000 U, so you still lose money!
Contract position management
ETH position allocation is calculated based on the number!
The maximum number of positions held with 1000u principal is 5
The maximum number of positions held with 3000u principal is 10
The maximum number of positions held with a 5000u principal is 20.
The maximum number of positions held with 10000u principal is 30.
The maximum number of positions held with a capital of 30000u cannot exceed 50
The maximum position allocation for a 50000u principal holding cannot exceed 100 BTC, calculated based on the number of positions!
The maximum number of positions held with a principal of 1000u cannot exceed 0.5
The maximum number of positions held with 3000u principal is 1
The maximum number of positions held with a capital of 5000u is 2
The maximum number of positions held with 10000u principal is 3
The maximum number of positions held with a capital of 30,000u is 5.
The maximum number of positions held with a capital of 50,000u is 10.
Contracts are actually the same as spot trading. The initial principal of each order is the same, and the number of orders placed each time is the same. This way, you will be able to handle orders with ease in the contract group and with God K! When it’s time to take profit, take profit. When it’s time to take loss, take loss. Treat yourself as a trading machine.
Digital currency has become quite popular in recent years, and everyone must have a lot of experience in this field. Today, the editor has collected some practical experience in cryptocurrency trading to share with you:
1. Never buy coins at high prices. You must have this mindset: it can grow as much as it wants, just treat the coin as if it doesn’t exist.
2. There are only two types of coins. The coins at the buying point are good coins, otherwise they are junk coins; the coins at the large-scale buying point are the best blue-chip coins. Be patient and wait for the coins that are built at a large level to become truly blue-chip coins. This is the real mentality.
3. The most important thing when trading cryptocurrencies is your mindset. Many people know it's not a good time to buy, but they can't resist. This is a mindset issue, and if you don't address this, any theory will be useless.
4. Maintain a steady mindset and don't get attached to any particular currency or price. Focus solely on market signals. You should have a strong sense of where to buy and sell. If you have good skills and a small amount of capital, such as using a 30-minute timeframe, then you can always be late.
5. The reason for mistakes is never related to the market. When looking for reasons, you can only look for your own reasons. You must summarize any mistakes immediately.
6. A mindset without technical assurance is a fool's mindset. A fool's mindset is the best; it's the one that doesn't react to anything. Insight guided by wisdom is the only guarantee of a healthy mindset.
7. Why can't you turn yourself into a wolf? It has nothing to do with the size of your capital. As long as you can buy and sell at the right time, you are the most ferocious wolf.
8. When operating, you must remain calm. You have money and everything, so why worry about not having good currencies?
9. In the market, any luck is only temporary and will be doubled back by the market. Facing the market, it is impossible to defeat the market without a complete change of heart.
10. The mentality of being in a hurry to make money is a taboo for us cryptocurrency traders. If we cannot control our own hearts, our greed and desires, we will not be able to succeed in the market for a long time.
It is destined that the vast majority of investors are fooled by the market, and all those who are fooled are trapped in the market and confused by themselves. All the behaviors of these people are classified into multiple categories.
There are two forms of long and short. When you hold the currency, your thinking is controlled by the bulls, and vice versa, you are a slave to the bears. The market sentiment is accumulated and guided by this.
I am Axin. If you don’t know what to do in a bull market, click on my avatar and follow me. I will share the bull market spot planning and contract password for free.

