In chart patterns, channels usually imply stability, such as triangular reversal channels and wedge reversal channels. Channel boundaries can generally serve as entry points for shorting & going long. However, a well-formed channel typically requires three points to determine a boundary. In the $PENGU so-called 'upward channel' chart, we can see that it has already failed, and at the second point. If we here use the lower boundary of the channel as a basis for going long, it actually carries the suspicion of predicting the market trend, as we firmly believe it will eventually form a channel. This is not advisable.
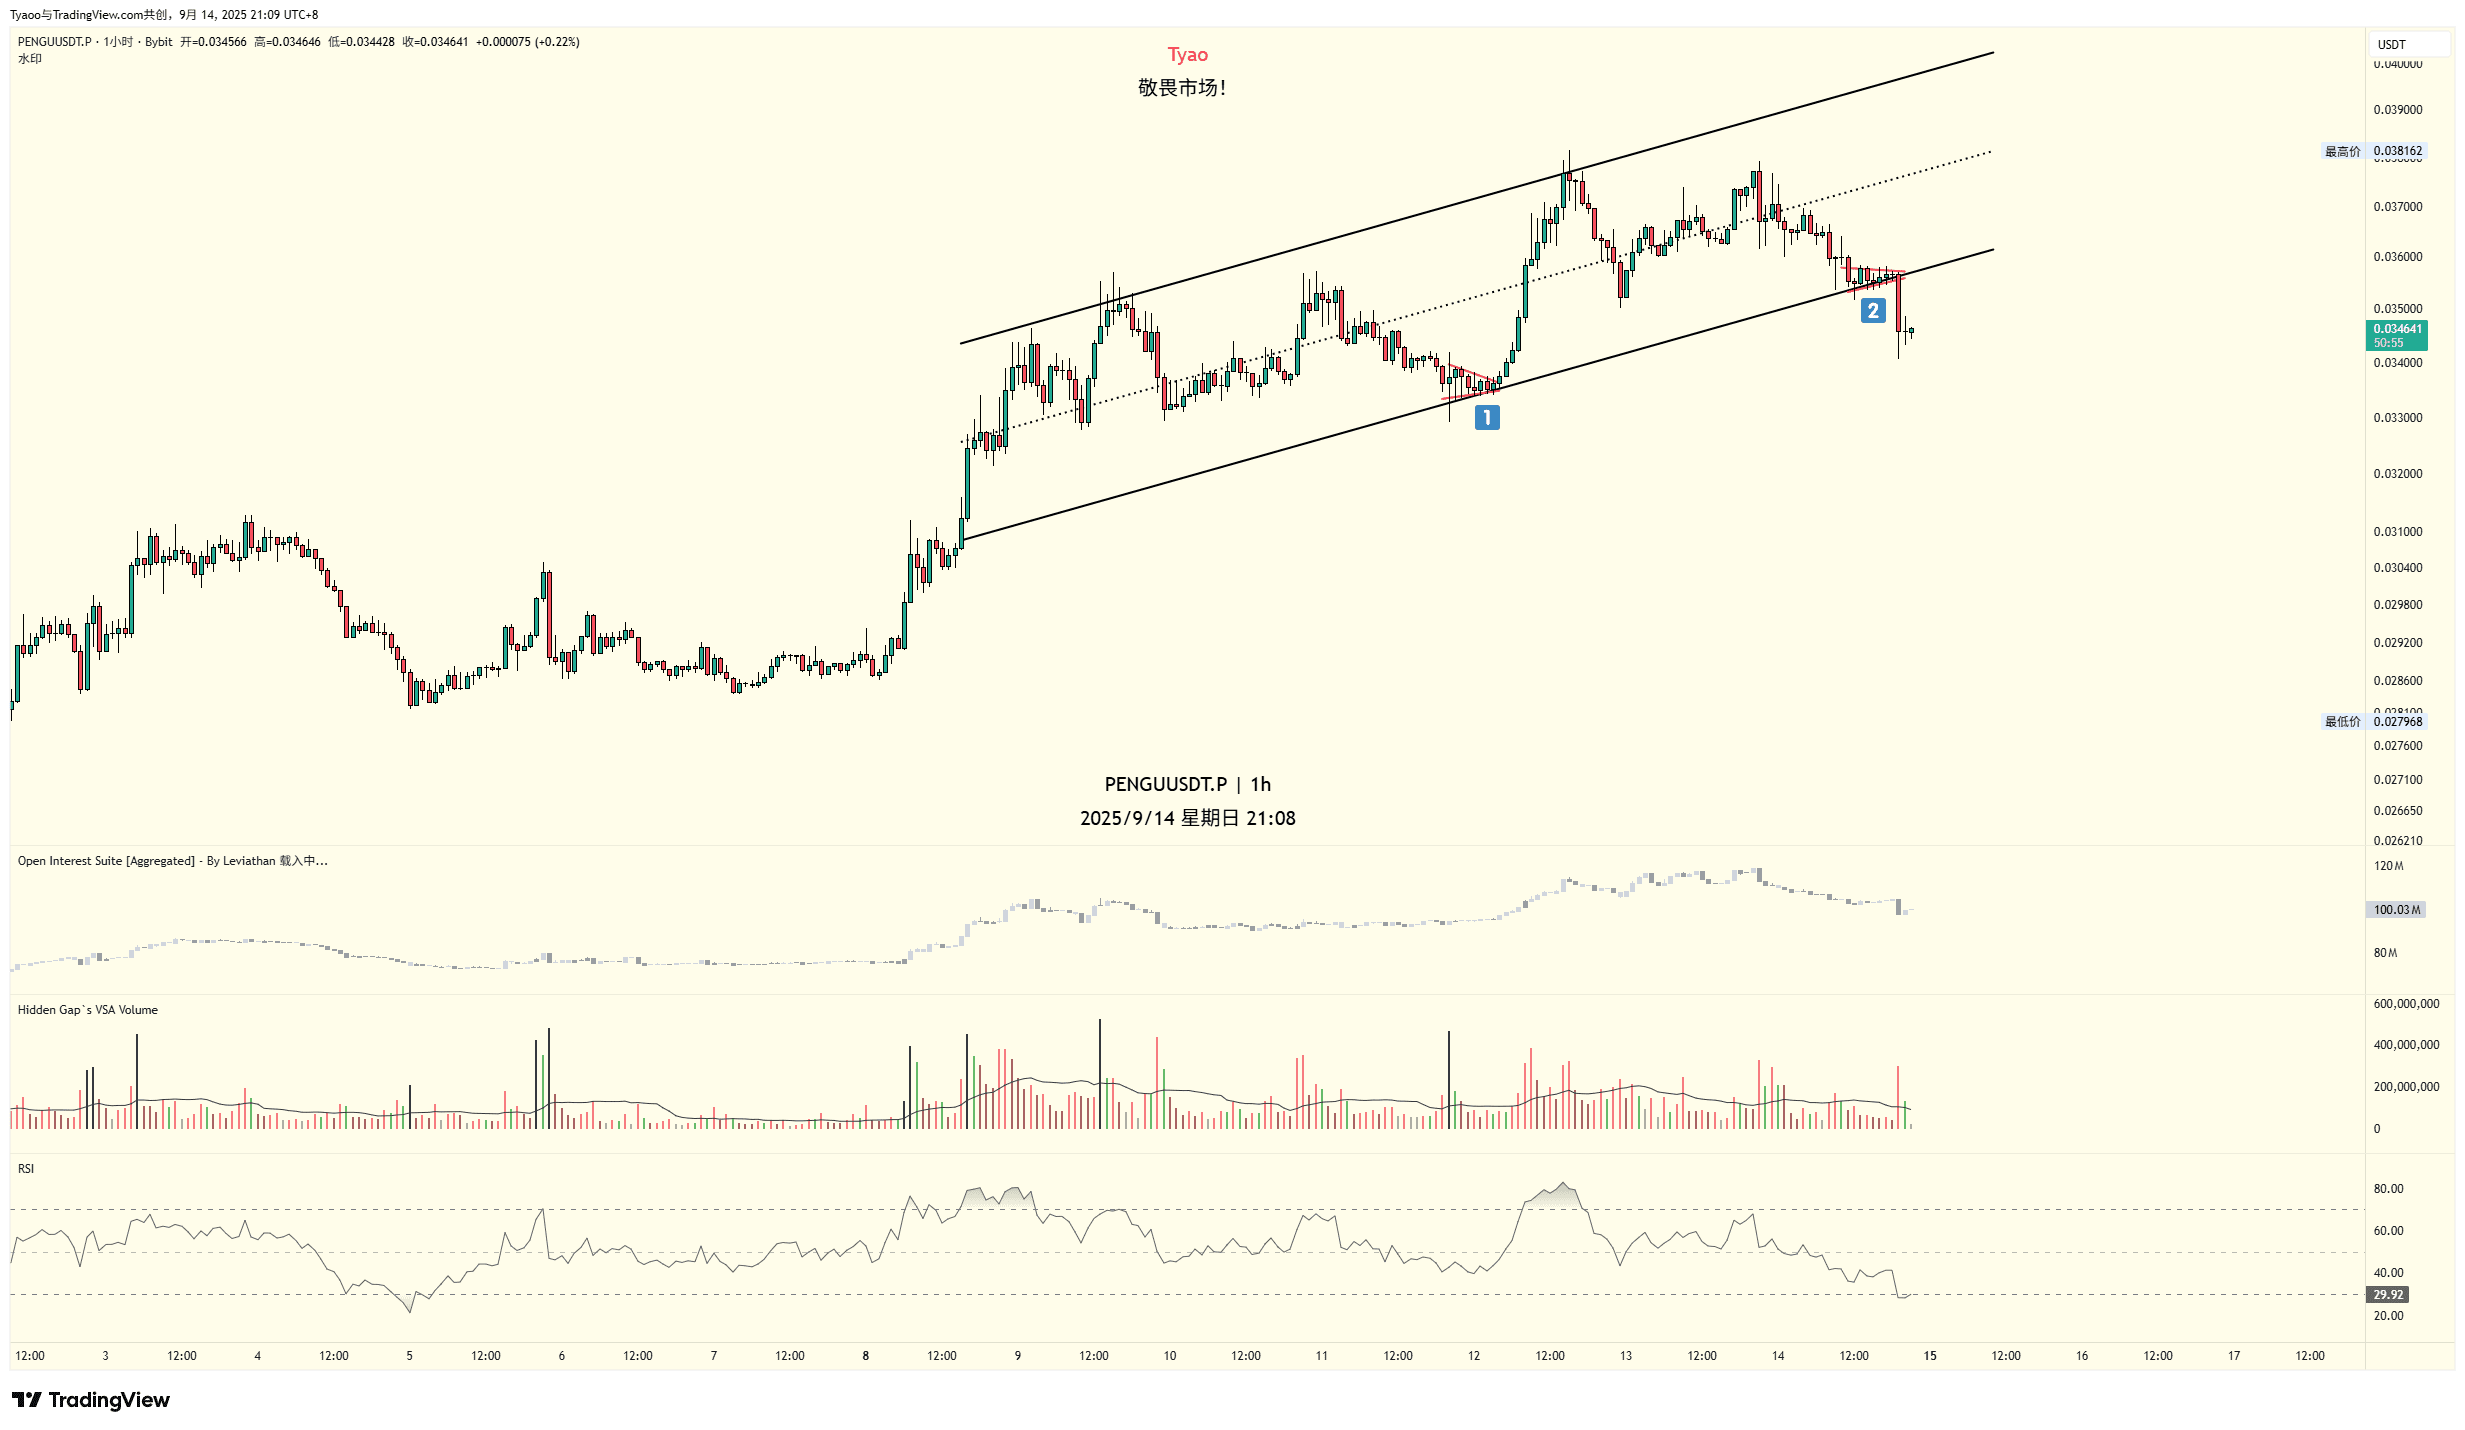
From another perspective, as follows. If we focus on horizontal support, we can find that position 2 is just located in the horizontal support area, and it just happens to fall on the lower boundary of the channel. Many times, this kind of horizontal support coincides with diagonal support. Therefore, going long at this position is not inappropriate.

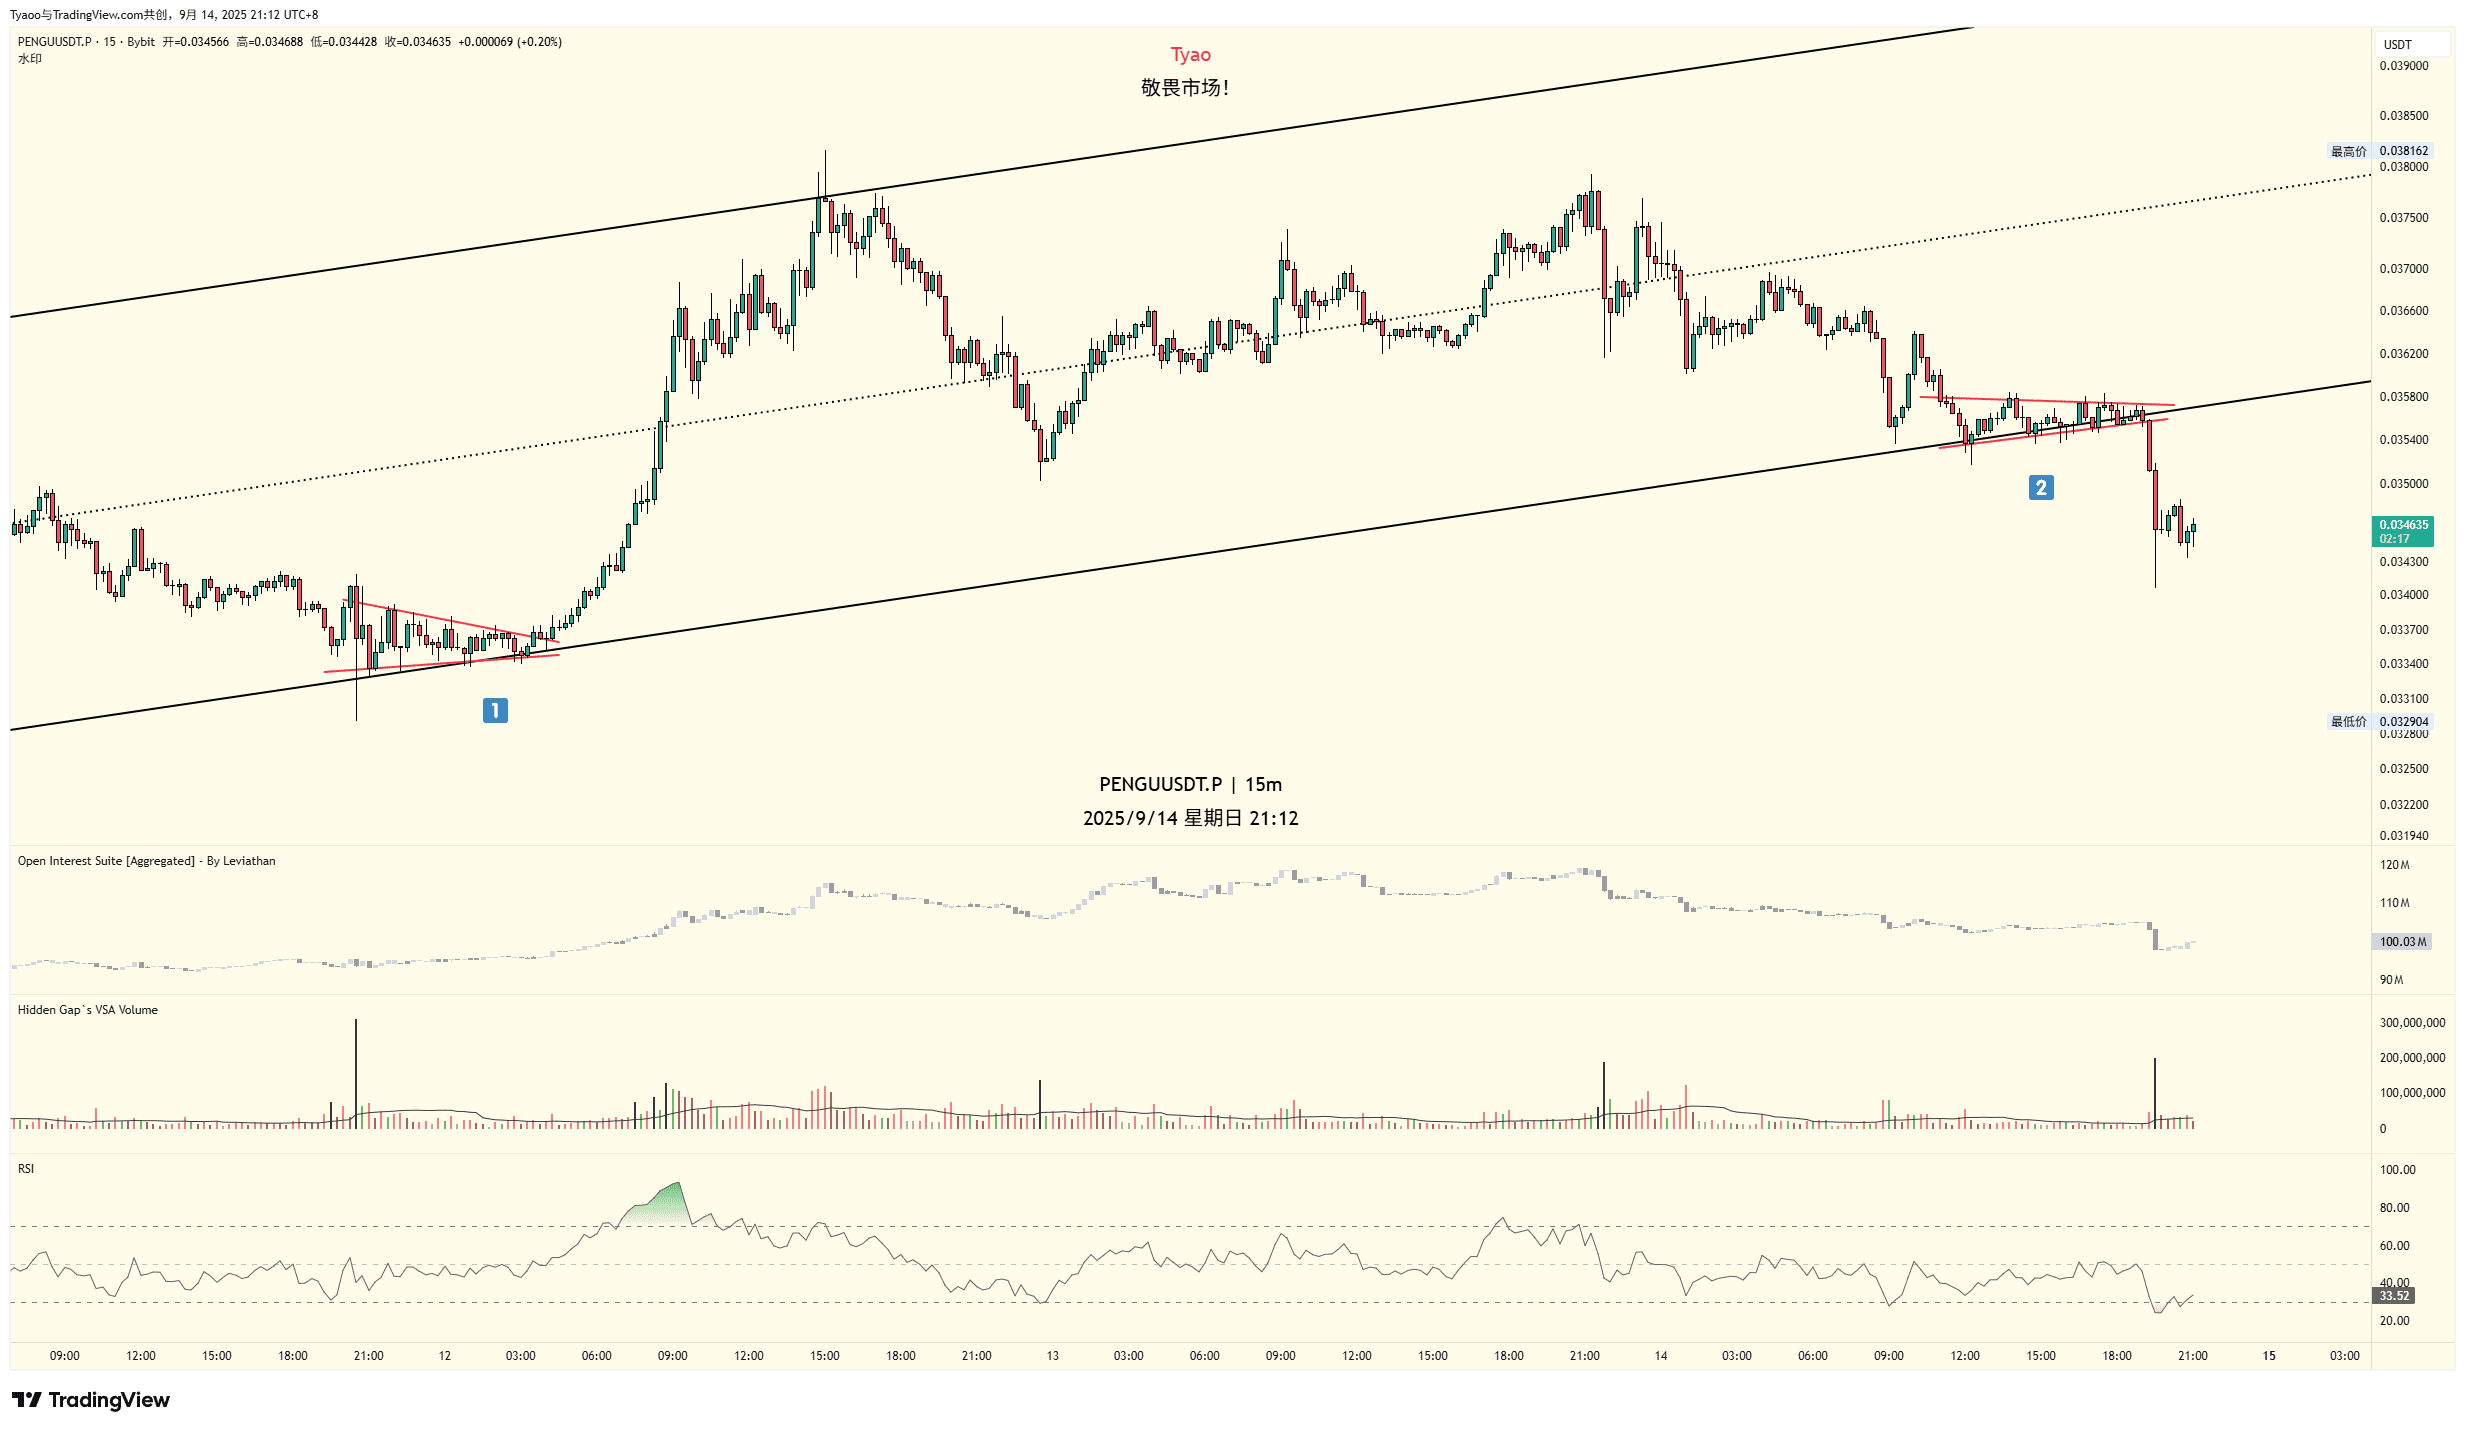
Here, the key point I want to emphasize is the price's performance at key positions. It can be seen that the chart marks positions ① and ②, both located in key support areas and both being triangular structures.
Generally speaking, a triangular structure indicates a continuation, which means that the price will continue to move along the original trend. The trend in the chart is downward. Therefore, after the triangular structure appears, we have reason to suspect that the price will continue to fall. Although both positions ① and ② are in key support areas, a continuation triangle that suggests the price will continue to fall has appeared. Therefore, in the face of these contradictory signals, the correct action at this time should be to stay out of the market. If a position has already been opened, it should be closed, waiting for the price to break out of the triangle area and appear in a clear direction before taking action.
In structural pattern trading, all structures are neutral; it is just that the probability of the original trend continuing is slightly higher. When analyzing the market, we should not only pay attention to the structural patterns but also to the position where the pattern appears. For example, in an upward trend, a triangle usually indicates a continuation, but if it is a high position triangle, the probability of it being a reversal structure will greatly increase.
On the way to pengu, both key support positions ① and ② showed the same triangular structure. Support indicates that the price may go up, while the triangle indicates that the price may continue to fall. At this time, our patience should play a role, waiting for the price to break out of the triangle and take a position in the direction of the breakout. For example, if ① breaks upwards, we will enter a long position after the breakout. If ② breaks downwards, we will enter a short position after it breaks down.
In a strong market, the price should bounce immediately after reaching a key position. If it hesitates, it indicates that the market is weak, and it could go up or down. In that case, we should reduce the level of focus and pay attention to the internal structure trends, patiently waiting for a clear direction before taking action.
