When investing in the crypto space, the biggest fear is encountering those scam coins that are designed to rip off investors, ultimately leading to a price drop to zero and losing everything. Today, I’ve compiled some relatively reliable coins that are not prone to sudden crashes, categorized into old mainstream coins and emerging potential coins, for everyone’s reference.
Let’s first talk about those old mainstream coins. These have been in the crypto space for many years, experiencing bull and bear markets, supported by strong teams and ecosystems, making the possibility of them running away very low.
BTC: Bitcoin doesn’t need much introduction; it’s the leader of the crypto world, equivalent to digital gold. No matter how the market changes, BTC will always be the big brother, and holding it for the long term won't lead to losses.
ETH: Ethereum ETH is the leader in smart contracts. Currently, 90% of blockchain projects are running on it. It will be even more powerful after future upgrades. It is a must-have currency for long-term holding.
BCH: Bitcoin Cash (BCH) is considered a scaled-down version of BTC, offering faster transactions and lower fees. While not as popular as BTC, it's a long-standing coin and won't fade away anytime soon.
LTC: Litecoin is Bitcoin's younger sibling, focusing on fast payments. It's faster than BTC in transfers. It sees significant price increases during every bull market, making it a great buy-low, sell-high opportunity.
ADA: ADA is an academic public chain with solid technology and a reliable team. Although it grows slowly, it is not prone to collapse and is suitable for conservative players.
SOL: Solana SOL is Wall Street's favorite high-performance public chain, with fast speed and low fees. Its ecosystem is second only to ETH and it is optimistic in the long term.
XRP: Ripple XRP specializes in cross-border payments and has cooperated with many banks. Although it is plagued by lawsuits, it will not die, so it is a good choice to bet on its turnaround.
DOGE: Dogecoin DOGE is Musk's favorite. It relies purely on the community and hype. It has high risks and high returns. It is suitable for short-term trading. Don't hold a large position.
MKR: A leader in decentralized lending, it's the creator of the DAI stablecoin. It's a robust DeFi coin, capable of generating profits even in bear markets.
AAVE: AAVE is a leader in the lending market, offering security, reliability, and stable returns. A must-have DeFi coin, holding it long-term is a surefire way to earn a profit.
BNB: Binance's favorite cryptocurrency, offering discounted fees and various benefits. As long as BN survives, BNB will thrive.
LINK: LINK is the leading oracle, providing data support for smart contracts and the infrastructure of the blockchain world, and is optimistic in the long term.
AVAX: A high-performance public blockchain with fast speed, low fees, and a strong ecosystem. A competitor to ETH with great potential.
ETC: Ethereum Classic is the original Ethereum. While not as popular as ETH, it still has its loyal fans. It's a good bet on its future success.
Let’s talk about those new mainstream coins. These are newer than the old coins and may rise more sharply but also carry greater risks.
SUI: A leading new public blockchain, with rapid growth and strong capital support. It could become the next SOL, but this depends on the ecosystem's development.
CRV: A leading stablecoin trading platform and a must-have for DeFi. Its stable returns are offset by high price volatility, making it a good investment for bargain hunting.
LDO: LDO is the leader in ETH staking, allowing you to earn interest without doing anything. As long as ETH rises, LDO will also be a winner.
TON: Telegram's favorite, with a large user base, aims to provide hundreds of millions of users around the world with an efficient, secure, and private decentralized social network and financial service platform, with a promising future.
TRX: Justin Sun's coin, while controversial, has a strong ecosystem. Suitable for short-term trading, not long-term holding.
Finally, I would like to give my brothers some basic advice: if you want to play it safe, choose old-fashioned coins such as BTC, ETH, and BNB; if you want to take a gamble, you can look at SOL, AVAX, SUI, etc.; if you just want to have fun, then go for DOGE, SHIB, etc., but don't be FOMO. Remember that the cryptocurrency circle is very risky, so don't go all in. The best way is to do research before you act.
Before the big bull market comes, you must be clear about the representative currencies of each major sector. If you are not sure what to buy, then buy one currency from the leading currency in each sector.
1, MEME币板块doge,shib,pepe,floki,doge,bonk
2. AI sector: agix, wld, fet, ai, nmr
3. Public chain sectors: ETH, BNB, SOL, MATI, FTM, ADA, AVAX, DOT, ATOM
4. Layer 2 sections: op, arb, metis, imx, manta, egld, mnt
5. 2024 halving plate BCH, BSV, ZEC, ZEN, BTG
6. Gamefi board sand, mana, gala, enj, ron, pixel, ace, ilv, magic
7. Oracle plate trb, link, api3, trb, band
8. Payment concept sector mob, ach, xlm, celo
9. Inscription plate ordi, sats, rats
10. Storage plates ar, fil, storj, blz
11. DeFi sector aave, comp, rdnt, crv, mkr, avax, dydx
12. NFT board blur, x2y2, looks, dego
13. Modular panels tia, manta, dym, alt,
14. Sports section chz, santos, por, city, og
Once you have made your choice, you must hold on to it. As long as you hold on to it, you will definitely get a return within a period, and no one can cut you off. Remember not to be indecisive.
Don’t doubt yourself when you see other coins soaring one after another. Believe in your original choice. Flowers cannot bloom overnight, and only grass that does not grow tall grows fast.
Those that do grow tall grow steadily and eventually become towering trees, growing taller each year.
From 300U to 100,000U with Rolling Compounding: How I Did It in 3 Months (with Real Strategy)
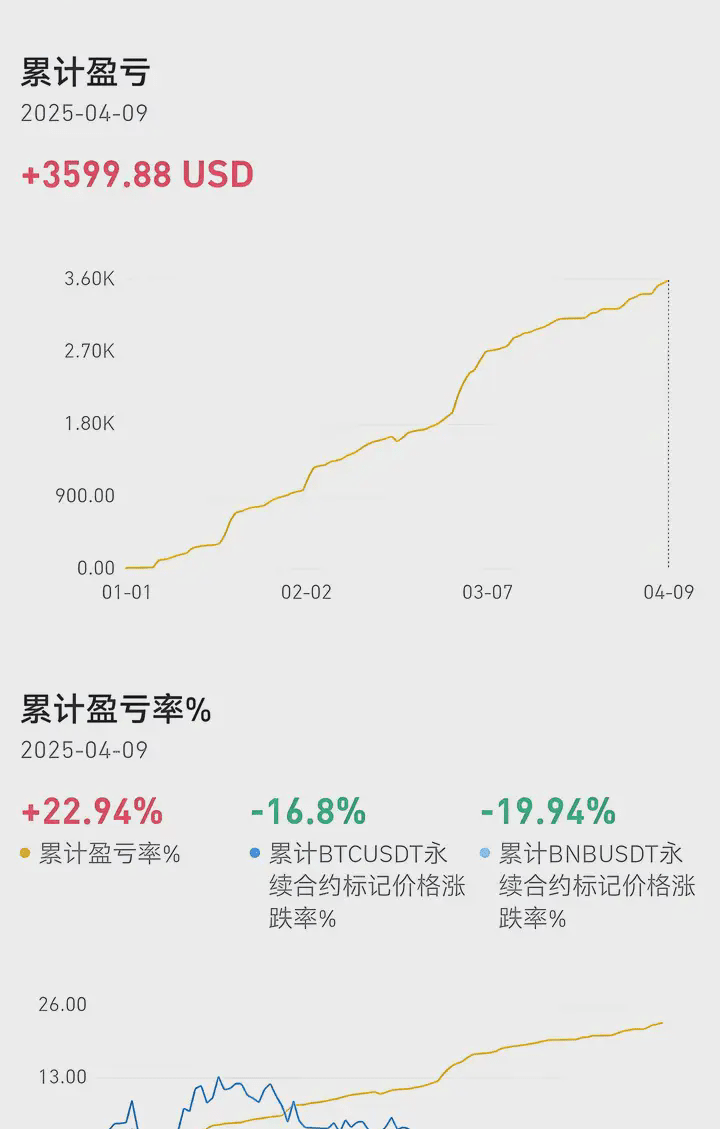
There is never a shortage of get-rich-quick myths in the cryptocurrency world, but most people are just bystanders.
Today, I'm going to share a practical path—how to grow 300U to 100,000U in 3 months. This isn't a theory, but a method I've personally tested. I've experienced pitfalls and blown out my positions along the way, but ultimately, I've found a strategy with a high win rate.
Step 1: Fund allocation (to avoid a one-time zero)
300U may not seem like a lot, but if you go all-in on one coin, there is a 99% chance that it will go to zero. My strategy is:
150U (50%): used for trend trading (BTC/ETH mainstream market)
100U (30%): Ambush low-market-cap potential coins (screened by key indicators)
50U (20%): Short-term contract sniping (high volatility market)
Step 2: Trend Trading - Seizing the Main Uptrend
In January 2024, I observed that BTC was trading sideways around 38,000, and on-chain data showed that whales were accumulating funds. So, I bought in batches around 38,500 and took profits at 42,000 and 45,000 respectively. This transaction alone turned 1500U into 2800U.
How to judge the trend? I mainly look at three indicators (one of which is on-chain data, the other two are @BitHuang
Step 3: Ambush low-market-cap coins (the key to a 10x jump)
MEME coins, new public chains, RWA tracks... low-market-cap coins have strong explosive power, but 99% of them are garbage. I use three screening criteria to find projects with real potential.
In March of this year, I used this method to increase my money 25 times in 5 days on a certain animal currency (for specific currency and purchase timing, please call me
Step 4: Short-term contract sniping (high risk, high return)
Short-term contracts are an accelerator, but they are also a "meat grinder." My strategy is:
Open trades only at key support/resistance levels (avoid frequent trading)
Strict stop loss (no more than 3% of principal)
Exploiting Funding Rate Arbitrage (a hidden trick used by some exchanges)
The last step: compound interest growth (the key to going from 10,000U to 100,000U)
When my funds exceeded 10,000 U, I began to use the "pyramiding method" to ensure maximum profit when a big market came. At the same time, I began to arrange cross-exchange arbitrage and use price differences to make stable profits.
There's a cryptocurrency trading technique that can outperform 99% of retail traders by accurately predicting trends and directions with just one candlestick pattern (the inverted hammer candlestick pattern). It's incredibly effective in both spot and futures trading, with a win rate of up to 90%. If you want to make money in the cryptocurrency world, master this single candlestick pattern!
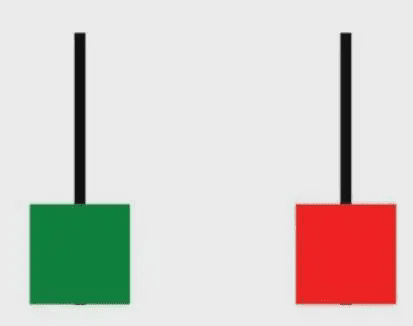
In technical analysis, there are many different types of candlestick patterns that can be used to predict future price movements. The most common and reliable is the inverted hammer, a candlestick pattern often used to identify trend reversals. An inverted hammer candlestick pattern forms on a chart when bulls (buyers) exert pressure to push up an asset's price. This pattern is often observed at the end of a downtrend, thus signaling a bullish reversal. The inverted hammer pattern is so called because it resembles an upside-down hammer.
Identified by its three main components: a long upper shadow, a short lower shadow, and a small real body.
Key points of the inverted hammer pattern
1. The shadow length is more than twice the length of the body
2. Almost no lower shadow (or very short lower shadow)
3. The color of the middle body K bar is not limited
4. Appears at the top of an uptrend or the bottom of a downtrend
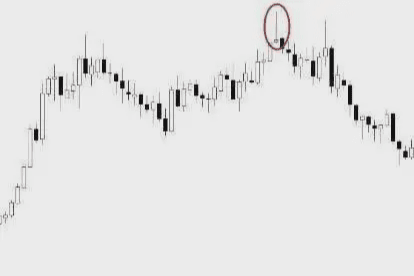
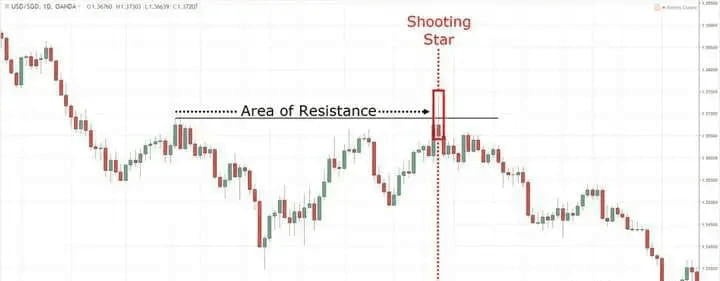
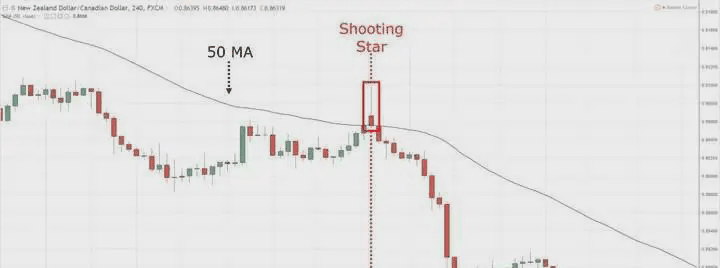
At the top of the trend, a red candlestick with an upper shadow appears at the upper end, also known as a bearish inverted hammer. It is a variation of the standard inverted hammer candlestick pattern and indicates that there may be pressure on the upper end. When an inverted hammer candlestick appears at the top of an uptrend, it may indicate that the trend is about to reverse and prices may start to fall. This is also called a "shooting star" because it resembles a shooting star with a bright trail. This is because the long upper shadow shows that although the bulls are strong, they are ultimately unable to maintain the upward momentum and the pressure from the bears begins to emerge. Investors may consider taking profits or setting a stop-loss to avoid the risk of a potential pullback.
The chart below shows that bulls attempted to push the price higher, but then bears stepped in and pulled the price back to the opening range of the candlestick. After the formation of the pattern, the price fell and reached a local bottom, and a bearish falling hammer pattern was formed.
Identification method
Appears after an uptrend: After several days or weeks of rising prices, the inverted hammer candlestick appears at a high level.
Long upper shadow line: This means that the price rose sharply on that day (or in that period), but eventually fell back at the close, indicating that there is greater pressure from above.
Small body: Usually the color is not important, but generally speaking, the smaller the body, the stronger the reversal signal.
Some classic technical analysis patterns work well together: support and resistance lines, double tops, head and shoulders
Or use indicators to identify: Moving Average (MA), Relative Strength Index (RSI), Moving Average Convergence Divergence (MACD), Fibonacci Retracement
Identification with support pressure
Identifying Trading Strategies with Moving Averages
Good entry point
The appearance of an inverted hammer candlestick pattern can be used as an indicator to enter a new short position, essentially triggering a downward price movement. A safer option is to wait for further confirmation from the next candlestick after the inverted hammer candlestick appears. If the next candlestick closes below the body of the inverted hammer candlestick, this strengthens the reversal signal.
Confirmation with other indicators
While the inverted hammer pattern indicates a possible trend reversal from bullish to bearish, it is important to confirm with other technical indicators before making a trading decision. For example, an increase in volume after the inverted candlestick formation can confirm the possibility of a downtrend.
Risk Management
As with any other trading strategy, appropriate risk management techniques must be employed with the inverted hammer pattern. For example, a stop-loss can be set above the high of the inverted hammer to limit potential losses.
Goal Setting
Set target price based on support level, trend line or previous low.
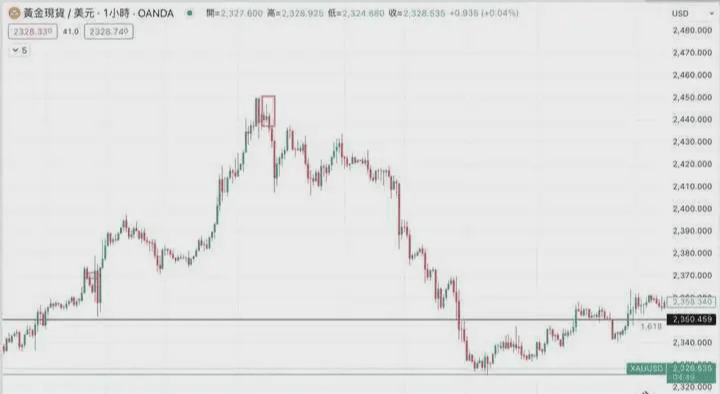
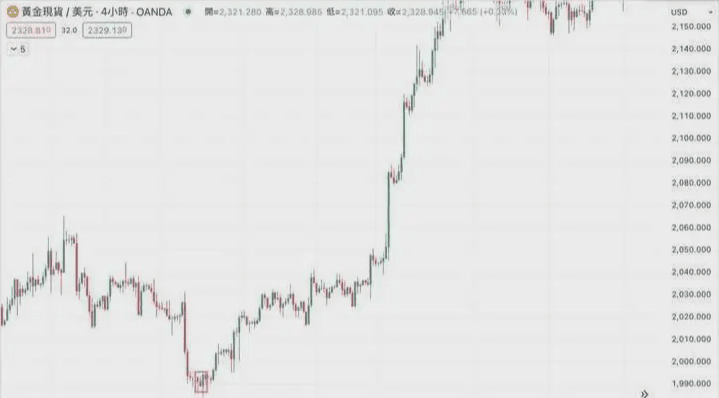
Identification of inverted hammer K-bar: The K-bar in the pink box has an opening price of 2440, a high point of 2447, and a closing price of 2441.
Waiting for confirmation: The next candlestick (right candlestick) closes below the body of the inverted hammer candlestick, confirming the reversal signal.
Setting an entry point: Set an entry point below the low of the inverted hammer candlestick.
Setting Stop Loss: The stop loss is set near the top of the upper shadow of the inverted hammer candlestick, which is 2450.
Set the target price: Set the target price based on the previous support level, such as the previous support level of 2350.459 in the figure.
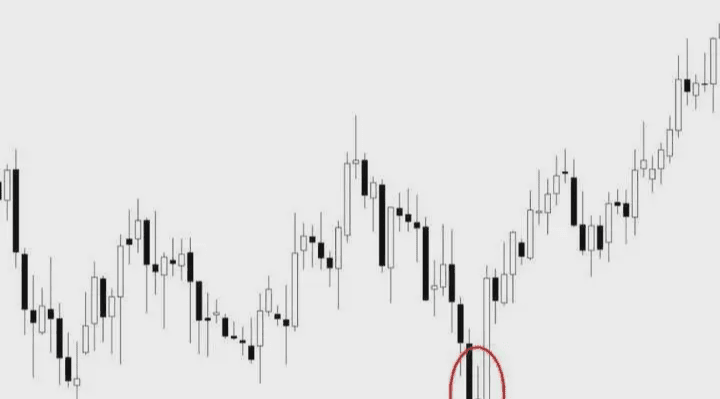
The appearance of an upper black K-bar at the bottom of the trend indicates a high probability of an upward trend in the future. When an inverted hammer K-bar appears at the bottom of a downtrend, it may indicate that the trend is about to reverse and prices may start to rise. This is because although the price failed to rebound on that day, it also shows that buyers began to enter the market, trying to prevent prices from falling further. Investors can consider this a potential buy signal, but it is best to wait for a confirmation signal, such as an upward trend in subsequent K-bars, to increase the success rate of the operation.
Identification method
Appears after a downtrend: After prices have fallen for several consecutive days or weeks, an inverted hammer candlestick appears at a low level.
Long upper shadow: This means that the price on that day (or current period) tried to rebound but failed.
Small body: Usually the color is not important, but generally speaking, the smaller the body, the stronger the reversal signal.
Some classic technical analysis patterns work well together: support and resistance lines, double bottom patterns, head and shoulders bottom patterns
Or use indicators to identify: Moving Average (MA), Relative Strength Index (RSI), Moving Average Convergence Divergence (MACD), Fibonacci Retracement Trading Strategy
Good entry point
The appearance of an inverted hammer candlestick pattern can be used as an indicator to enter new long positions. It can be seen as triggering a healthy upward price movement.
Confirmation with other indicators
While the inverted hammer pattern indicates a possible trend reversal from bearish to bullish, it is important to confirm with other technical indicators before making a trading decision. For example, an increase in volume after the inverted candlestick formation can confirm the possibility of an uptrend.
Risk Management
As with any other trading strategy, appropriate risk management techniques must be employed with the inverted hammer pattern. For example, a stop-loss can be set below the low of the inverted hammer to limit potential losses.
Goal Setting
Set target price based on support level, trend line or previous high.
Identification of inverted hammer K-bar: The K-bar in the pink box has an opening price of 1991, a low of 1988, and a closing price of 1989.
Waiting for confirmation: The next candlestick (the right candlestick) closes above the body of the inverted hammer candlestick, confirming the reversal signal.
Set the entry point: Set the entry point above the high point of the confirmed K-bar.
Setting Stop Loss: The stop loss is set at the low of the inverted hammer candlestick, which is 1988.0.
Set target price: The target price is set at the previous resistance level or trend line, such as 2020.0
The difference between an inverted hammer and a shooting star
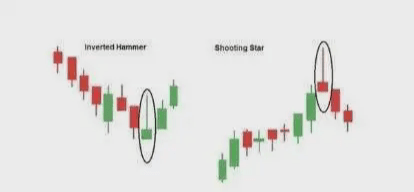
The two candlesticks have the same shape. A truly short candlestick has a long upper shadow and a thin lower shadow (or no lower shadow at all). Both can be considered possible trend reversal signals. The only difference between them is their location on the chart. An inverted hammer candlestick usually appears as the final element of a downtrend.
Conversely, a shooting star appears at the top of a trend, signaling a possible downside move in price. In short, both patterns have similar shapes. However, they offer different signals to traders.
What are the advantages of the inverted hammer?
Reversal Indicator: The Inverted Hammer pattern acts as a reversal indicator during a decline. It signals an impending bullish reversal as buyers begin to enter the market and selling pressure subsides. It provides early signs of a trend change, allowing traders to anticipate potential opportunities.
A change in market sentiment: An inverted hammer candlestick chart shows a shift in market sentiment from bearish to bullish. It suggests that buyers have successfully pushed prices higher, rejecting lower prices and potentially paving the way for higher prices. Trading decisions and assessing market dynamics can benefit from this information.
Confirmation with Other Indicators: The inverted hammer pattern is a valuable pattern that can be used in conjunction with other technical indicators or patterns to enhance their effectiveness. Traders often look for other positive signals, such as bullish candlestick patterns, trendline breakouts, or bullish momentum indicators, to support their trading decisions.
Applicable to multiple timeframes: The Inverted Hammer pattern can be observed on various timeframes, from intraday charts to longer-term charts (such as weekly or monthly charts). Therefore, it is used with a variety of trading methods and styles.
Entry and Exit Points: Trading professionals often use the Inverted Hammer pattern to identify their entry and exit points. Traders decide to enter a long position after the pattern is confirmed, anticipating a price reversal. Similarly, the pattern can serve as a potential entry point or a reminder to tighten stop-loss orders on open short positions.
Easy to Identify: The inverted hammer pattern is very easy to spot on a price chart due to its unique visual appearance. It stands out due to its distinctive long upper shadow, short real body, and minimal to no lower shadow, which helps traders spot possible bullish reversal opportunities.
What are the disadvantages of the inverted hammer?
The Inverted Hammer candlestick pattern does provide valuable insights into potential bullish reversals, but it also has some disadvantages that traders should be aware of. Traders should be aware of the four disadvantages of the Inverted Hammer candlestick pattern listed below.
False Signals: The Inverted Hammer pattern isn't entirely perfect; it does produce false signals, just like any other technical analysis tool. If traders base all their trade selections solely on this pattern, they risk losing money if the pattern forms but the expected bullish reversal doesn't occur. It's crucial to consider other variables and confirmation signals before making a trading decision.
Lack of clarity: The inverted hammer pattern doesn't offer clear entry or exit points, but it does give general indicators of a bullish reversal. Traders still need to apply additional technical analysis tools, such as trend lines, support and resistance levels, or oscillators, to find optimal entry and exit points and manage risk effectively.
Limited Timeframe Applicability: The reliability of the Inverted Hammer pattern varies depending on the selected timeframe. It can be more or less reliable depending on the market or timeframe. The timeframe used for analysis, along with other technical factors and the overall market trend, should all be considered.
Subjectivity and Interpretation: The inverted hammer candlestick pattern is one of those that requires some subjective interpretation. Due to varying interpretations and potential discrepancies in trading decisions, traders have varying opinions on the pattern's significance and reliability. The pattern's context within the larger technical analysis framework should be clearly understood.
in conclusion
Candlestick charts are an integral part of technical analysis. The chances of success depend largely on how well traders familiarize themselves with candlestick patterns and use them to trade, regardless of their preferred asset. Candlesticks cannot be used as trading signals in isolation. Instead, it's best to gain an accurate and precise holistic perspective when interpreting candlesticks. Market developments are based on a combination of factors, not just one, and this fact shouldn't be overlooked. The term "trend reversal" shouldn't be taken literally. The appearance of an inverted hammer candlestick on a chart doesn't necessarily mean the price will reverse and move in the opposite direction. It signifies a shift in market sentiment, so traders should be prepared to look for other indicators of recent trends. For those who can combine it with other signals, the inverted hammer candlestick is undoubtedly a useful tool.
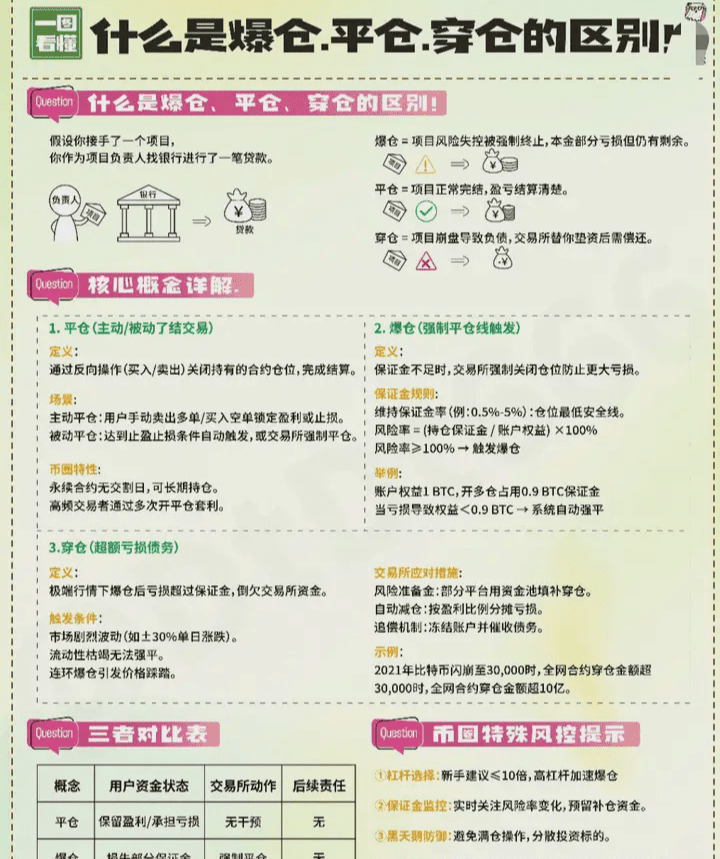
Understand the difference between margin call, position closing and position loss in one picture!
Some brothers actually asked, who made the money from the contract liquidation?
A brief introduction:
The funding rate of perpetual contracts belongs entirely to the counterparty.
The pre-liquidation loss of the main part of the margin (principal) is earned by the counterparty.
The additional losses from margin calls are borne by the platform. In a market with a sharp drop, the platform earns this profit; in a one-way market, the platform may lose even more, or even give the money back to the counterparty. However, platforms now have an ADL mechanism that forces liquidation of positions to avoid significant losses.
All transaction fees go to the platform, and the platform gives a portion to the market maker (in the form of a discount).
The exchange will not take the initiative to act as a counterparty, and the dealer has always been a market maker rather than a platform reserve.
The following is some basic scientific knowledge:
1. Funding Rate
Perpetual swaps are anchored to the corresponding spot price. To keep the contract price close to the spot price, the exchange adjusts the funding rate. The funding rate payment rules are as follows: if the funding rate is positive, long users pay short users; if it is negative, short users pay long users. Payments are typically made every 8 hours.
The specific payment amount is calculated as follows:
Payment amount = transaction amount (purchase principal × leverage) × funding rate
2. Leverage
Many novice traders are prone to margin calls when trading futures, and the most direct cause is leverage. Leverage amplifies both the returns and risks of a trade, thus fueling human greed. Leverage can be set between 1 and 125x. For example, 100x leverage means a single price fluctuation can double your profit. Consequently, many people, after incurring losses at low leverage, are tempted to increase leverage, ultimately leading to margin calls. Therefore, properly controlling leverage is key to avoiding margin calls.
3. Handling Fees
Taking a certain exchange as an example, without any discounts, the contract fee collection rules are as follows:
The handling fee for taking orders (i.e., directly executing an order) is 0.05%.
The handling fee for pending orders (i.e., orders placed in advance and awaiting execution) is 0.02%. The handling fee is charged in both directions, whether buying or selling.
The specific calculation formula is:
Transaction Fee = Transaction Amount (Principal × Leverage) × Transaction Fee Rate
Follow Aze's steps, believe first and then get, there is still room in the team, lead you out of confusion,
Again, follow the right people to make money, avatar → follow → is your code to get rich


