When investors trade Ethereum, the most important thing is to learn how to analyze the price trends of Ethereum. The candlestick chart, commonly referred to in the crypto community as the K-line chart, is the simplest method for investors to understand Ethereum's price trends. The K-line chart is also known as the candlestick chart, Japanese line, or yin-yang line. It is drawn based on the opening price, highest price, lowest price, and closing price of each analysis period. Through the K-line chart, investors can see the market conditions for every minute, day, or specific period. Therefore, the basic information such as Ethereum's price trends, trading volume, lowest point, highest point, etc., can also be reflected in the K-line chart. So how do we read the Ethereum K-line chart? Below, Brother Jun will provide a detailed introduction.
How to read the Ethereum K-line trend chart?
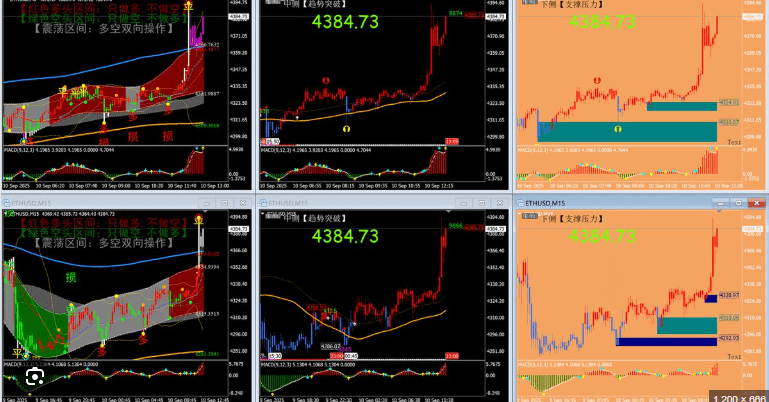
The Ethereum K-line chart trend is a chart formed by the changes in Ethereum price over time, which includes four different price data: opening price, closing price, highest price, and lowest price. Common K-line chart shapes have different meanings; for example, a large bearish line represents strong market bearish forces, while a large bullish line represents strong market bullish forces.
1. Look at the yin and yang, representing the trend direction.
Most analysis software in the cryptocurrency circle uses green to represent bullish lines and red to represent bearish lines. A bullish line indicates a continued upward trend, while a bearish line indicates a continued downward trend. Taking the bullish line as an example, after a period of struggle between bulls and bears, if the closing price is higher than the opening price, it indicates that the bulls have the upper hand; the bullish line indicates that the next phase will continue to rise, at least ensuring that the next phase can be driven by inertia. Conversely, the negative force is the same.
2. Look at the size of the body; the size of the body represents the internal motive.
The larger the body, the more obvious the motive for upward or downward movement; conversely, the motive is less obvious. Taking the bullish line as an example, its true body is the part where the closing price is higher than the opening price. The larger the bullish line's body, the greater the upward momentum. The larger the bullish line's body, the greater the internal upward momentum, which will be greater than that of a small bullish line. Conversely, the negative force is the same.
3. Based on the length of the shadow lines, the shadow lines represent turning point signals.
The longer the shadow line in one direction, the more unfavorable it is for the stock price to move in that direction. For example, the longer the upper shadow line, the more unfavorable for the stock price to rise; the longer the lower shadow line, the more unfavorable for the coin price to fall. Taking the upper shadow line as an example, after a period of struggle between bulls and bears, the bulls are defeated. Regardless of whether the K-line is bearish or bullish, the upper shadow line has already constituted the resistance for the next phase, making it more likely for the price to adjust downward.
1) The daily K-line is drawn based on the four price points formed during a day's price (index) movement: opening price, closing price, highest price, and lowest price.
When the closing price is higher than the opening price, the opening price is lower and the closing price is higher. The rectangular column between the two is drawn in red or hollow, known as a bullish line; the highest point of the upper shadow line is the highest price, and the lowest point of the lower shadow line is the lowest price.
When the closing price is lower than the opening price, the opening price is higher and the closing price is lower. The rectangular column between the two is drawn in black or solid, known as a bearish line; the highest point of the upper shadow line is the highest price, and the lowest point of the lower shadow line is the lowest price.
2) Based on the calculation period of the K-line, it can be divided into daily K-line, weekly K-line, monthly K-line, and yearly K-line.
The weekly K-line refers to the K-line chart drawn using the opening price on Monday, the closing price on Friday, the highest price of the week, and the lowest price of the week. The monthly K-line is drawn using the opening price on the first trading day of the month, the closing price on the last trading day of the month, the highest price of the month, and the lowest price of the month; similarly, the annual K-line can be defined.
Weekly K-line and monthly K-line are often used to analyze medium-term trends. For short-term traders, the 5-minute K-line, 15-minute K-line, 30-minute K-line, and 60-minute K-line provided by many analysis software also have important reference value.
I am (Jun Ge Crypto), with 6 years of deep cultivation in the cryptocurrency circle. Short-term games show the truth, and medium to long-term layouts are systematic. Accurately capturing the best trading opportunities, first-hand information empowers your investment decisions. Choose the right direction, find the right rhythm; here is the professional perspective you need.$BNB

