
SHIB forms a descending triangle, with support at $0.00001200 and a breakout target at $0.00001600.
RSI is 51.59, and MACD crossover indicates a mild bullish momentum for SHIB prices.
Futures open interest remains stable at $100 million to $200 million, indicating a reduction in excessive speculation.
The daily chart of Shiba Inu (SHIB) shows a bearish structure, and technical indicators suggest a potential breakout in the short term. The token has recently seen a slight increase and is still hovering between support and resistance levels, as traders weigh the next direction of movement.
The SHIB/USDT trading pair on Binance has formed a descending triangle pattern, with resistance being a downward sloping trend line and support located near $0.00001200. This boundary has been tested repeatedly, with buyers holding firm at lower levels while sellers suppress upward movements.
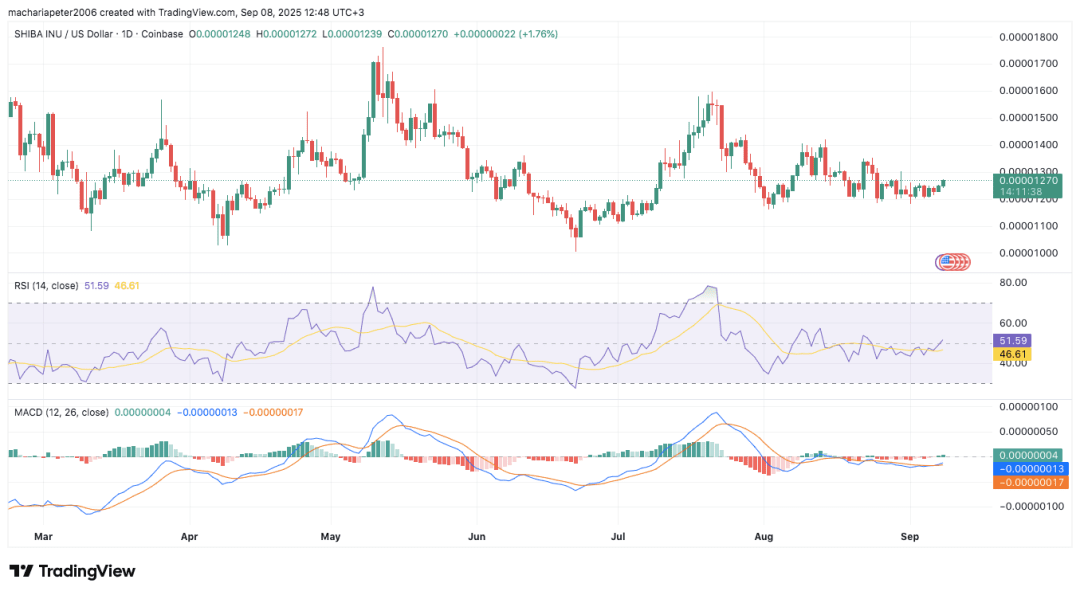
The price movement in this pattern indicates that a decision point is approaching. Chart predictions suggest that after confirming a breakout above the resistance level, prices are expected to rise by 34%, with a target price of $0.00001600. This prediction aligns with the triangle high, a commonly used method in technical analysis.
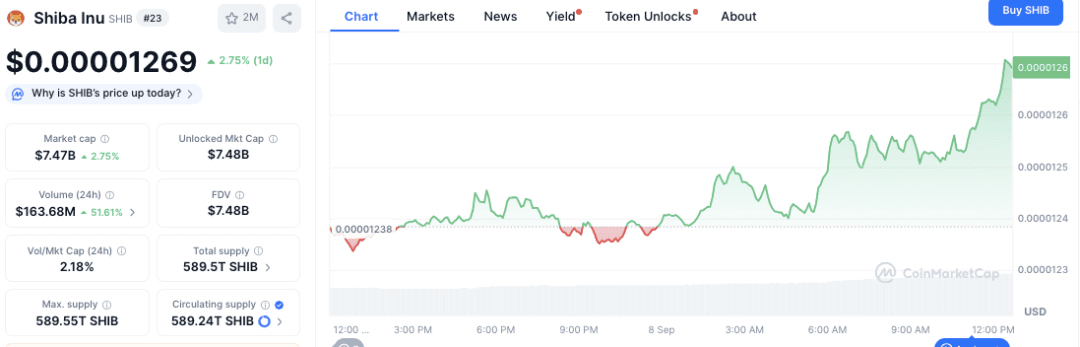
As of the time of writing, the trading price of SHIB is $0.00001270, with a daily increase of 1.76%. After a rise in the morning session, the token briefly touched $0.0000127. According to CoinMarketCap data, SHIB's 24-hour trading volume increased by 5.16%, reaching $163.68 million, with a market capitalization of $7.47 billion.
Market indicators show moderate bullishness
Technical indicators have turned to the buyers. The Relative Strength Index (RSI) is at 51.59, above the neutral midpoint, while its 46.61 moving average shows a recent upward trend. These indicators reflect moderate strength and have not pushed SHIB into overbought or oversold territory.
The Moving Average Convergence Divergence (MACD) indicator also presents positive signals. The MACD line is slightly above the signal line and is supported by green histogram bars. This crossover is typically interpreted as an early sign of bullish momentum.
Futures market data shows a change in sentiment
In addition to spot trading, the futures market for SHIB also shows a shift in participation. During the surge in February, open interest soared above $500 million, followed by a correction and liquidation events. Recently, open interest levels have stabilized between $100 million and $200 million, indicating a more balanced market compared to previous speculative peaks.
Historically, the simultaneous rise of open interest and prices often signals a strong bullish sentiment. Current data shows that market sentiment has eased, with traders holding a risk appetite while avoiding extreme leverage.


