$HBAR is showing some early signs of recovery, but momentum remains weak, and traders are now watching two key levels that could define the next big move. Let’s break it down.
📉 Current Market Situation
$HBAR recently reacted to upper micro support, but overall price action is still sluggish.
Momentum: Weak
Volume: Low
Trendline: Market is pressing against a smooth 45° descending trendline but has not yet broken through.
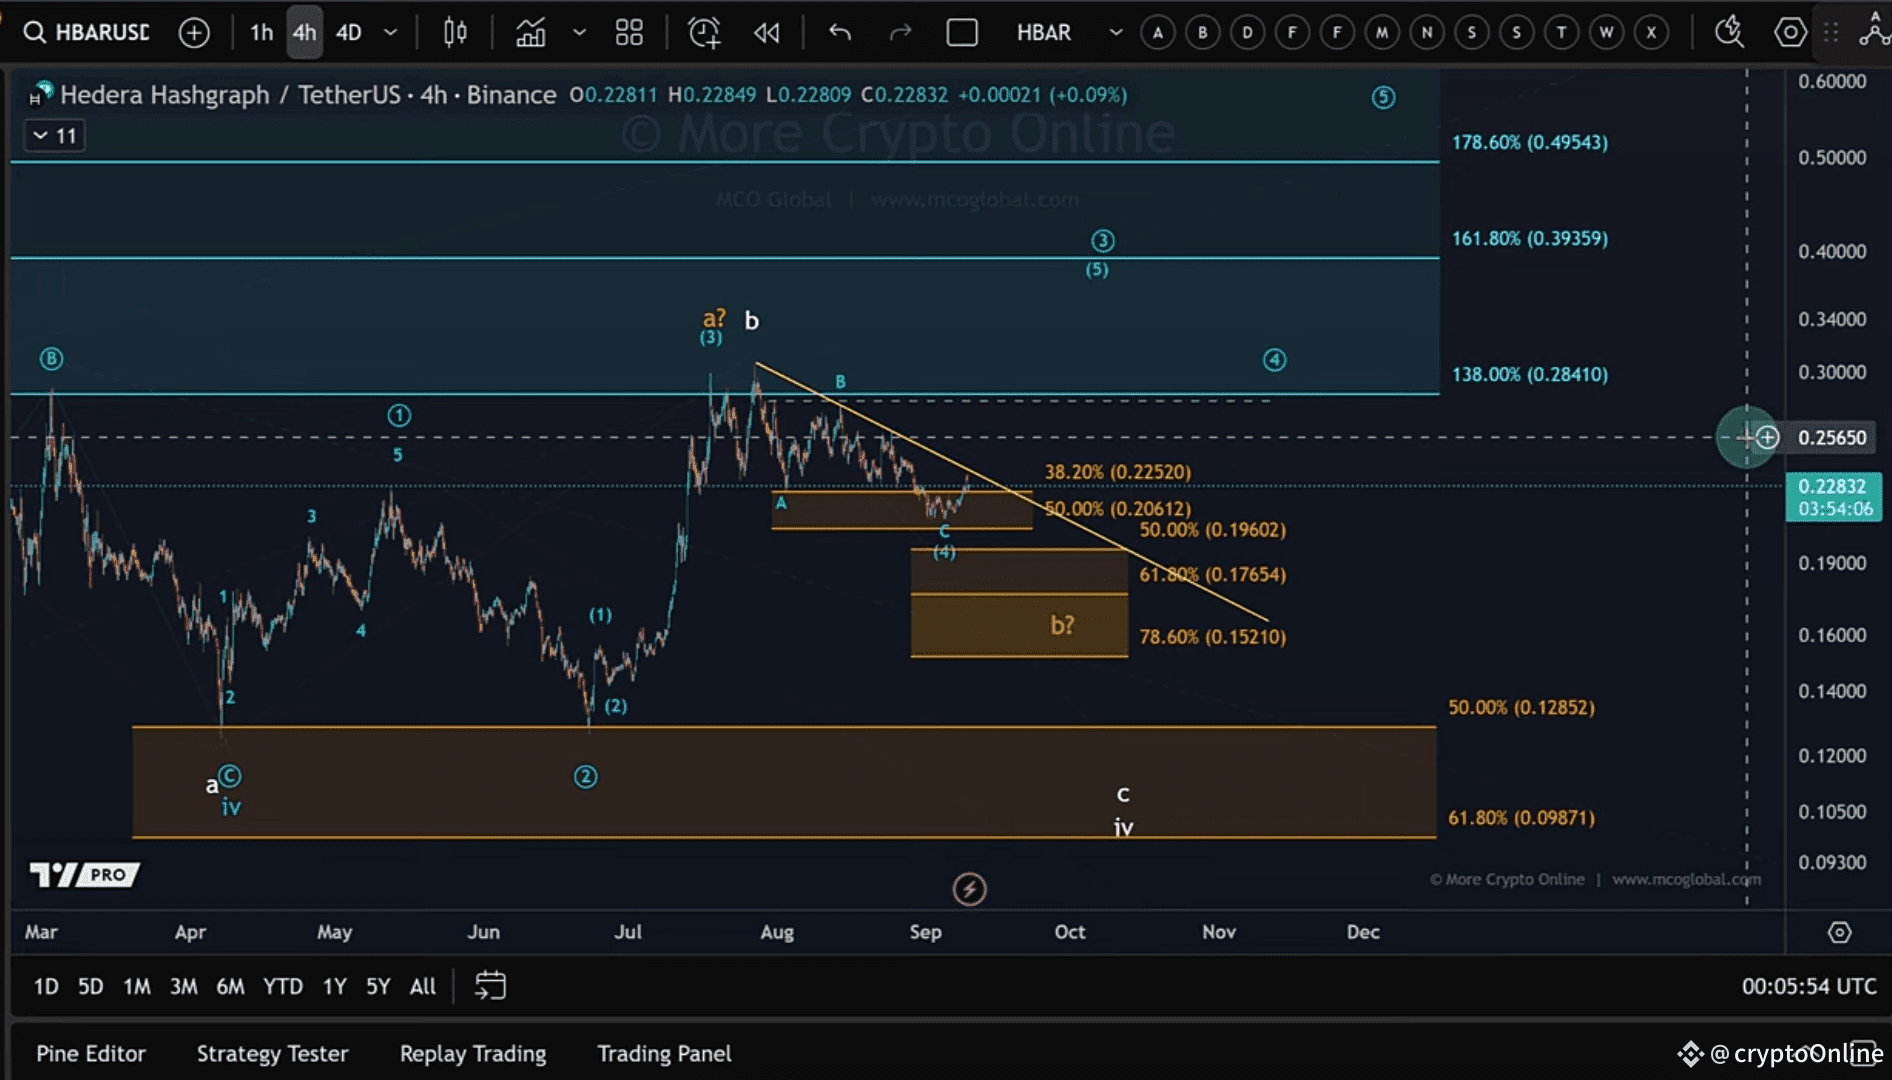
🟦 The Blue Scenario (Impulse Structure)
I’m currently tracking a wave count scenario:
Wave 1 → Wave 2 → Wave 3 → Wave 4 → Wave 5
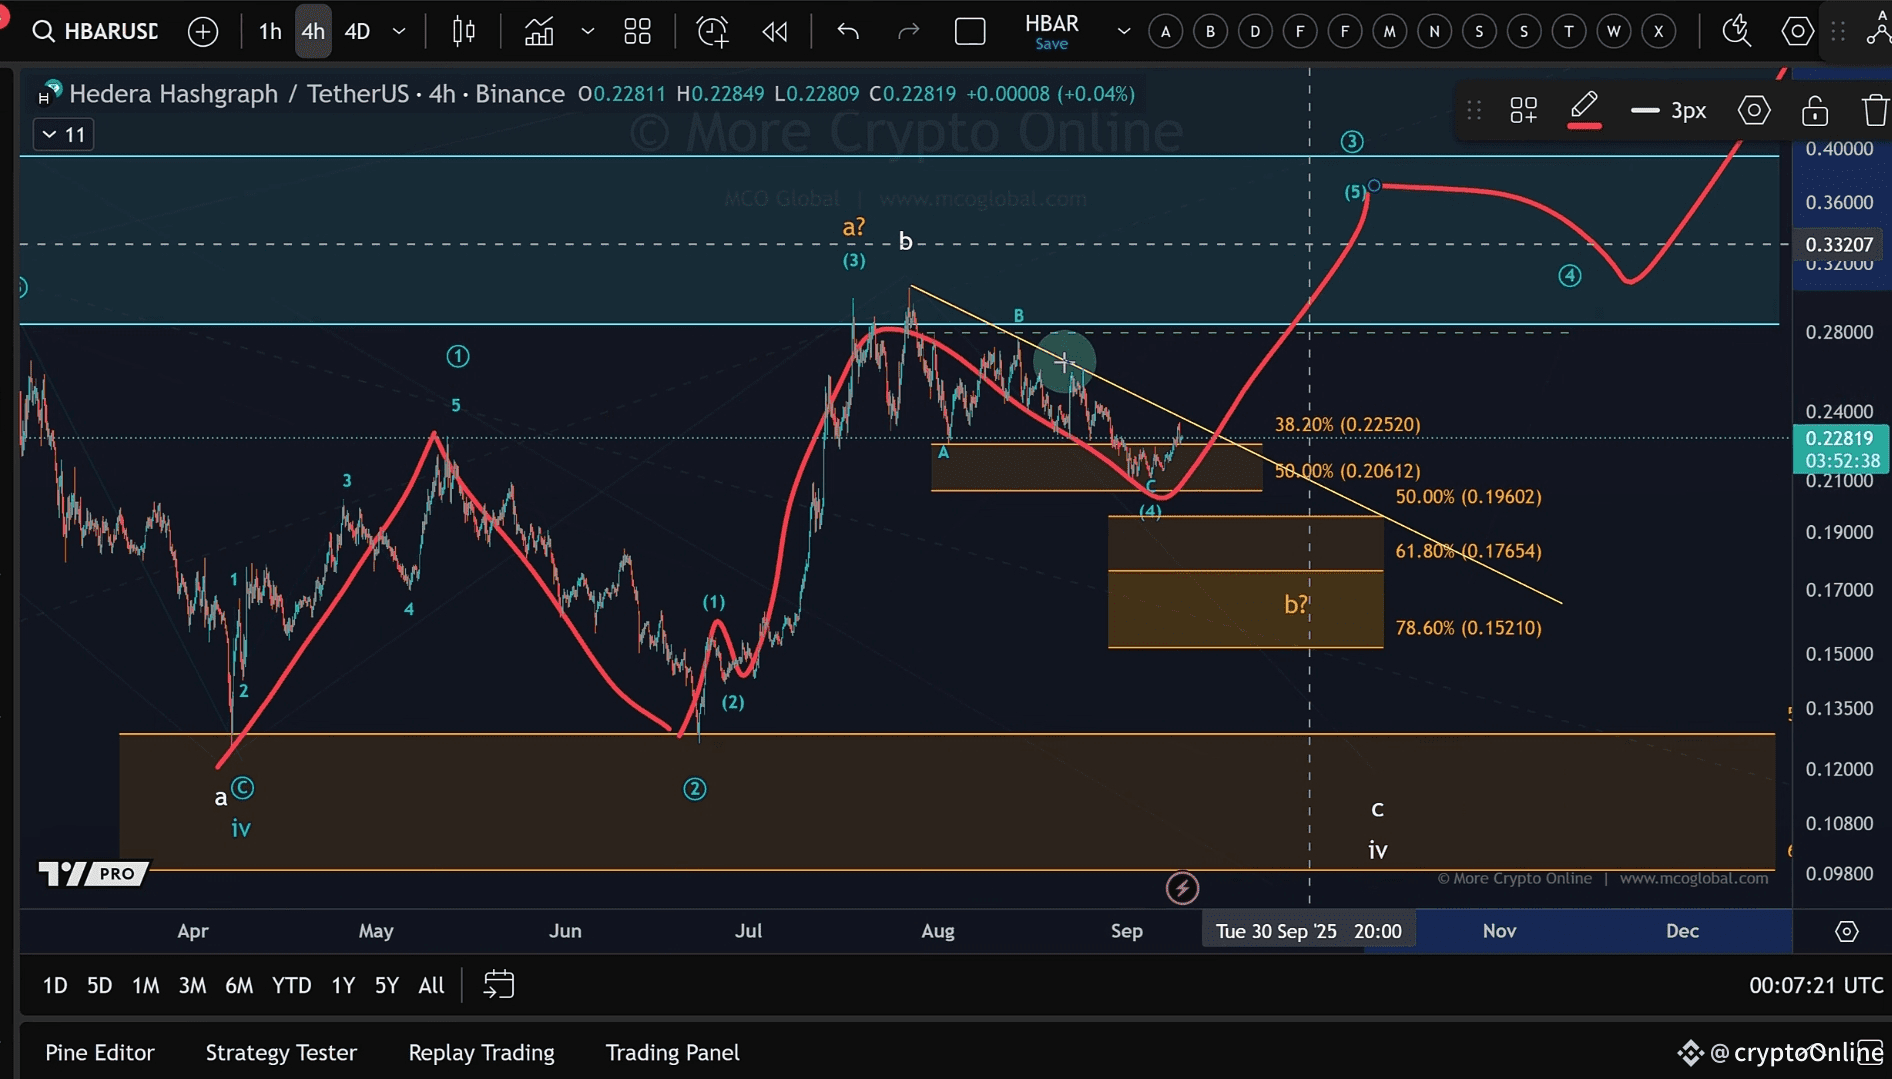
In this view, HBAR is still in wave 4 consolidation, with a potential wave 5 on deck if support holds.
The line in the sand is $0.206:
✅ Holding above → supports the bullish impulse count
❌ Breaking below → invalidates the impulse and shifts the structure into a larger diagonal pattern
🔄 Alternative Scenario (Diagonal Pattern)
If $HBAR loses $0.206, then the move up from April may no longer count as a clean 5-wave impulse. Instead, the structure shifts into a diagonal, where all subwaves are corrective.
Wave 3 would become a 3-wave move instead of 5
Pullbacks could be deeper and messier
Still possible to remain in an uptrend, but less clean and harder to track
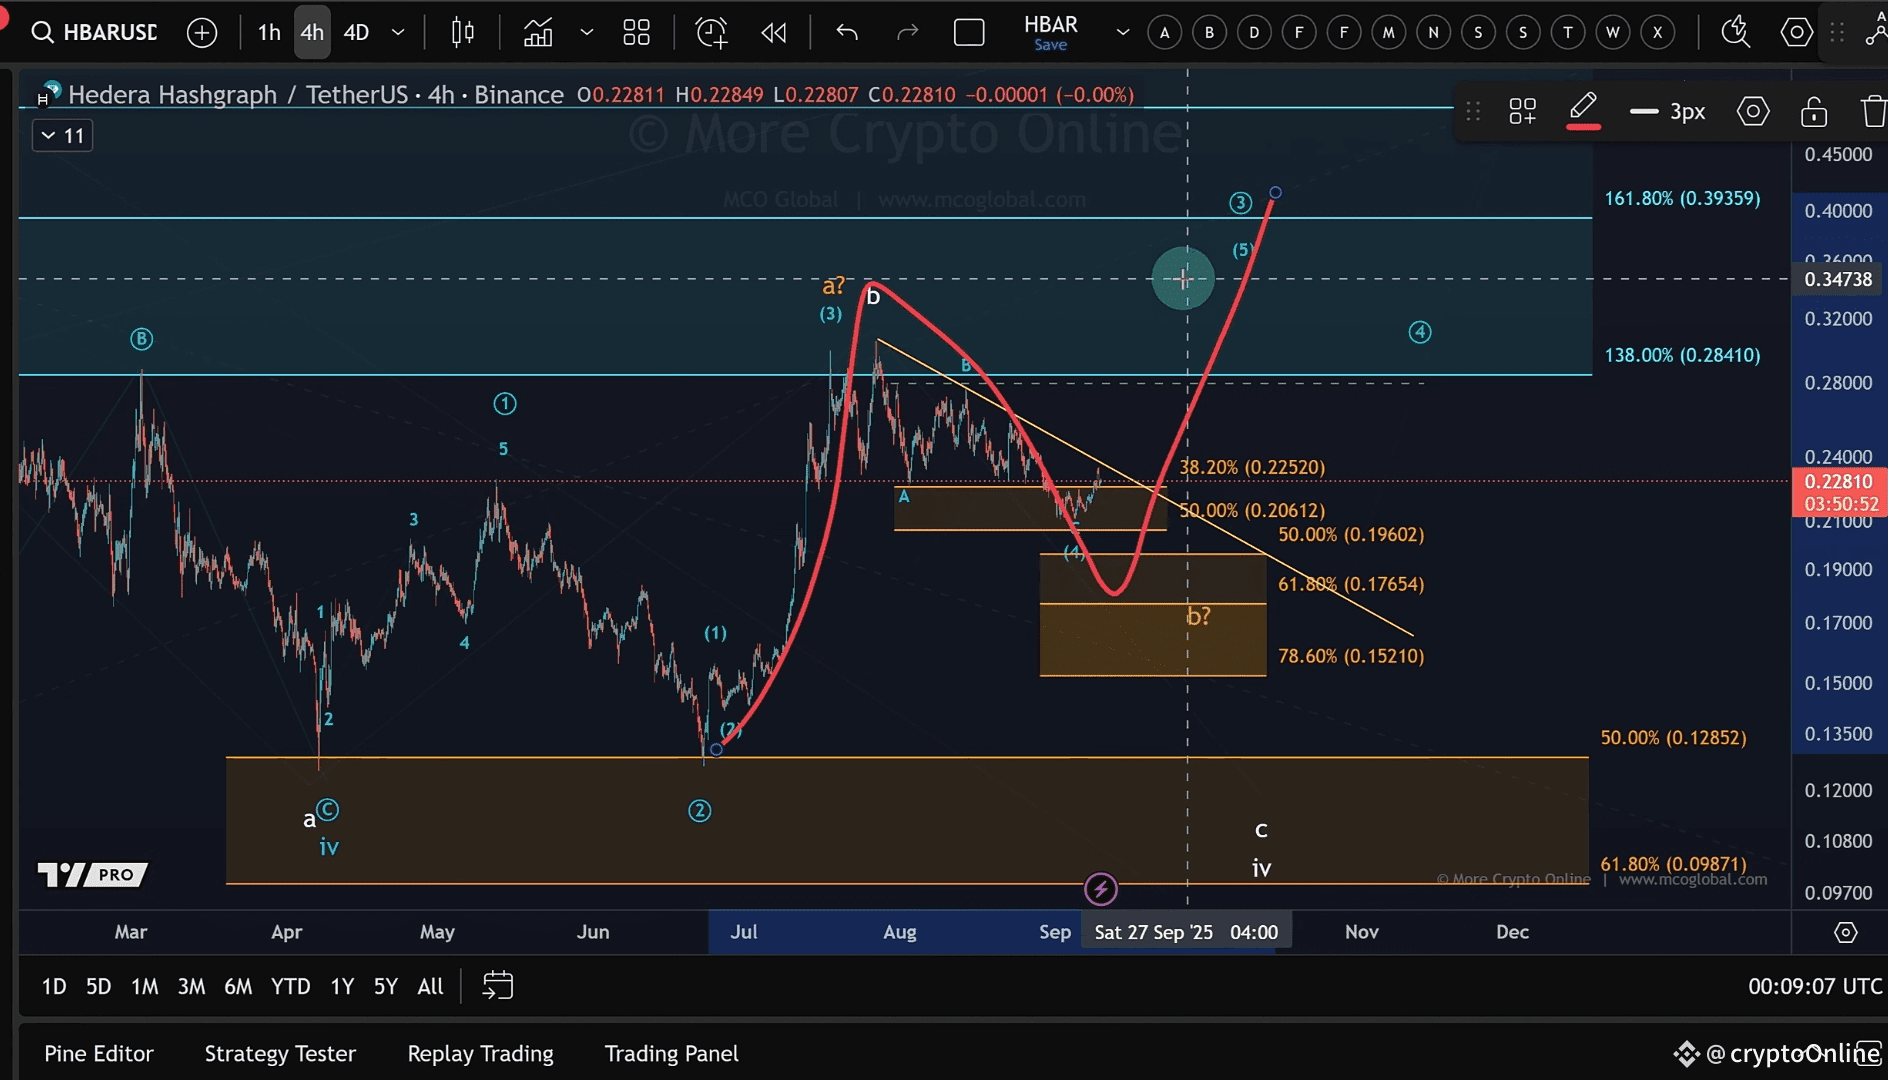
🚀 Bullish Trigger Levels
For confirmation that the next leg up has started:
Breakout above $0.24 trendline → signals wave 5 in play
Next resistance sits around $0.28, a strong barrier the bulls will need to overcome

