Cryptocurrencies are seeing a calm but upward start to the new week, with $BTC trading above USD 111,000 and Ethereum hovering around USD 4,300. The declines on Wall Street from the beginning of last week have subsided, index futures are gaining, and the US dollar is weakening. The biggest “pain point” for the cryptocurrency market is the ongoing Bitcoin sell-off from whale wallets. Their average $BTC holdings per address have fallen below 500 BTC, reaching the lowest level since 2018.
Bitcoin and $ETH are about 10% below their all-time highs, while sentiment around altcoins remains muted — after BTC rebounded from around USD 108,000 to above USD 111,000, the market is waiting for a clear momentum signal.
Whales sold about 115,000 BTC worth USD 12.7 billion in August, the most since 2022. The 7-day change indicator in the largest BTC addresses set a record since March 2021.
Whale selling is slowly easing — the weekly BTC supply change fell from 95,000 BTC in the week ending September 3 to 38,000 BTC between September 3 and 6.
The market awaits US CPI inflation data on Thursday — a lower-than-expected reading could serve as a major bullish trigger for the crypto market.
MicroStrategy (MSTR.US) remains outside the S&P 500 index — shares are down more than 2.5% in premarket trading.
New Nasdaq regulations hit the model of “treasury” companies that accumulated crypto via bond (debt) issuance — they do not prohibit it, but require shareholder approval and lengthen the process.
Bitcoin’s mining difficulty has reached a new record above 136 trillion, the fifth consecutive increase since June.
Miner revenues have dropped to the weakest level since June, putting pressure on BTC mining profitability.
The LTH NUPL indicator for ETH and a two-month high in the Coin Days Destroyed metric indicate profit-taking by investors.
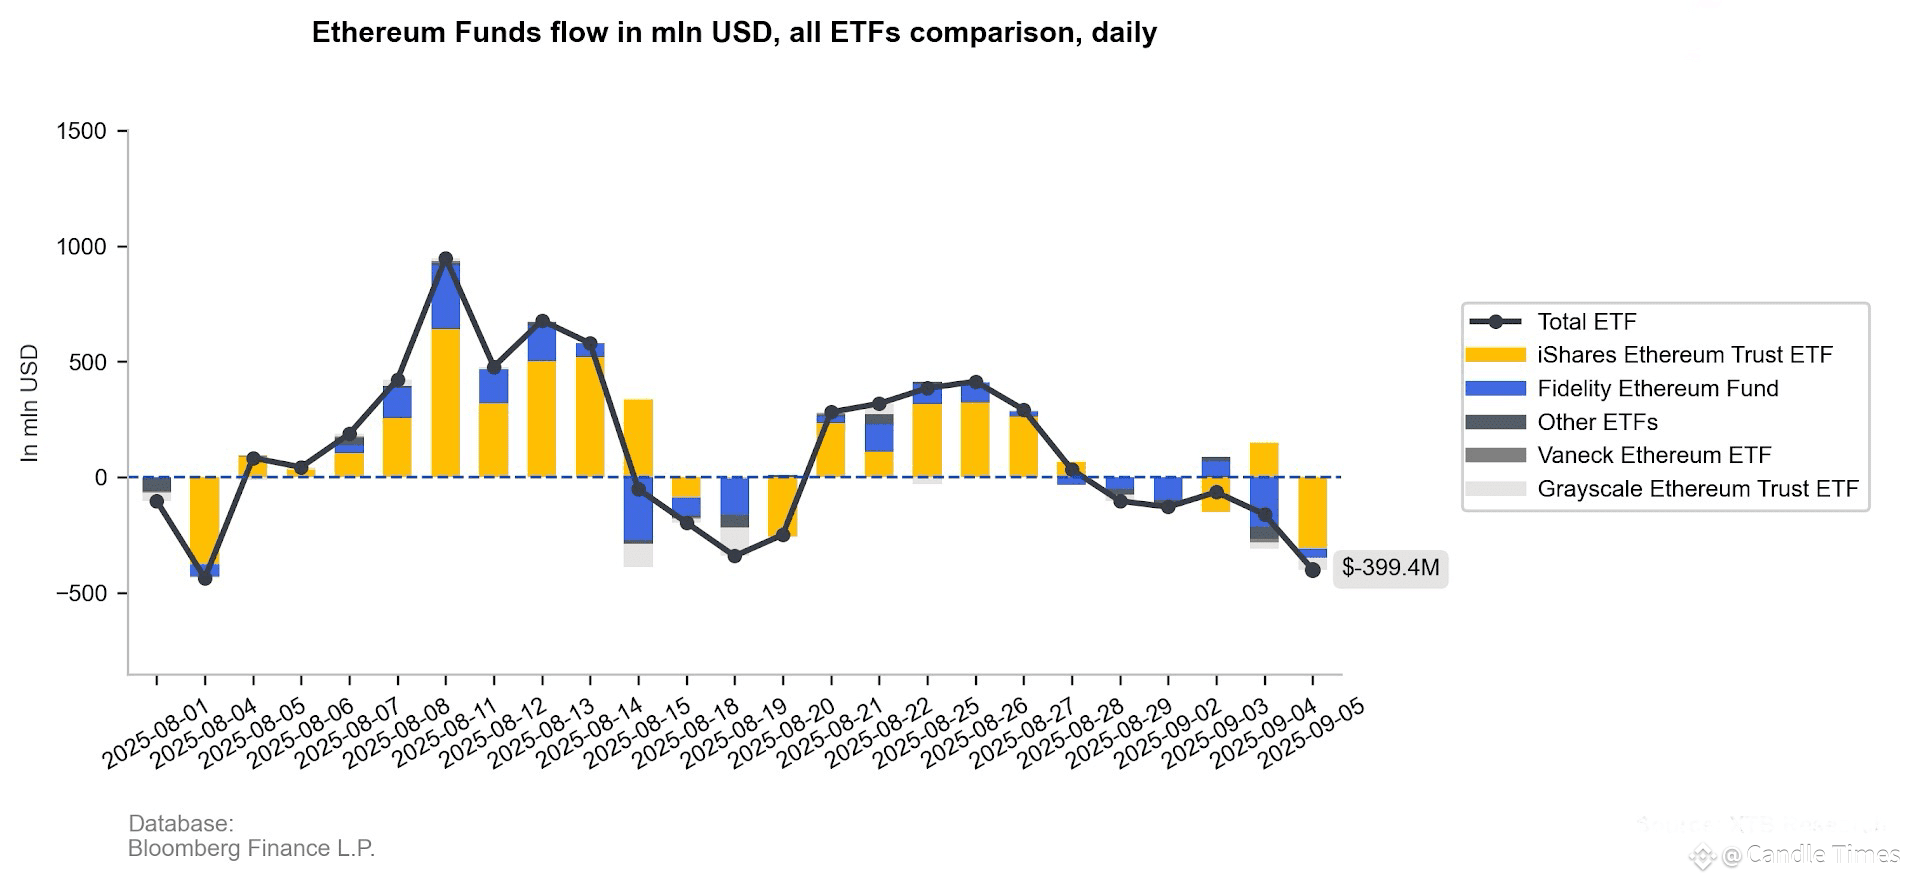
Ethereum-based ETFs have recorded five consecutive days of net outflows, signaling a shift in investor sentiment toward risk and the broader crypto market. The key question: will this change prove lasting?
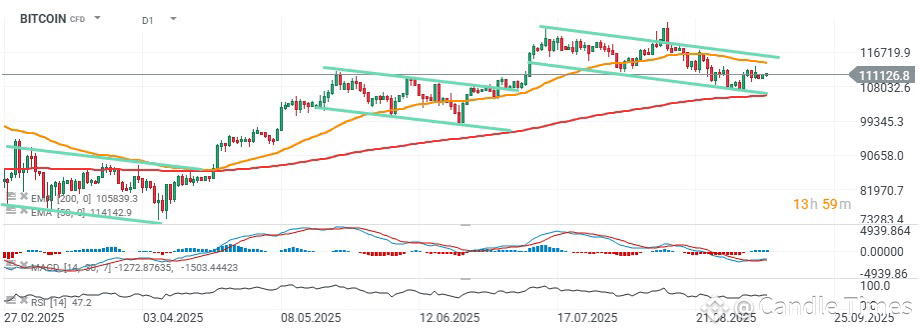
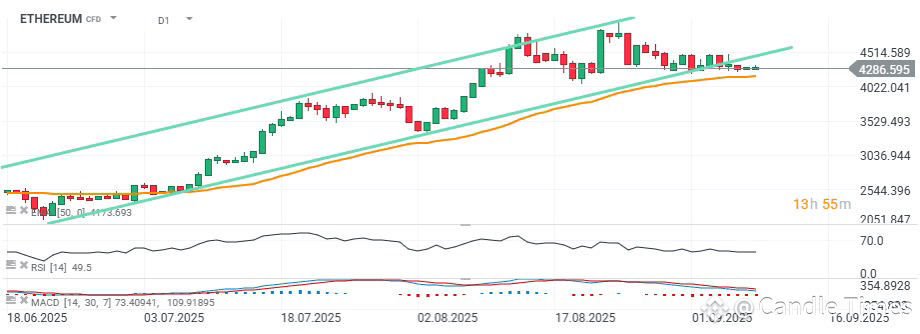
Bitcoin and Ethereum (D1 timeframe)
Looking at BTC, we see the price moving in a short-term downward channel. Since February 2025, BTC has repeatedly broken out of this channel to the upside. A breakout above USD 115,000 could push Bitcoin toward new all-time highs. A drop below USD 107,000 could drive the price toward the USD 95,000–100,000 range, where previous price reactions occurred. Importantly, the price rebounded from a key on-chain level — the STH Realized Price, which sits around USD 109,000 — suggesting that, on average, short-term holder wallets are once again showing “slight” unrealized gains. A return below USD 108,000 could trigger “capitulation” within this group.
Breaking above the USD 4,400 area could lead ETH to retest its ATH, this time around USD 5,000 per token.
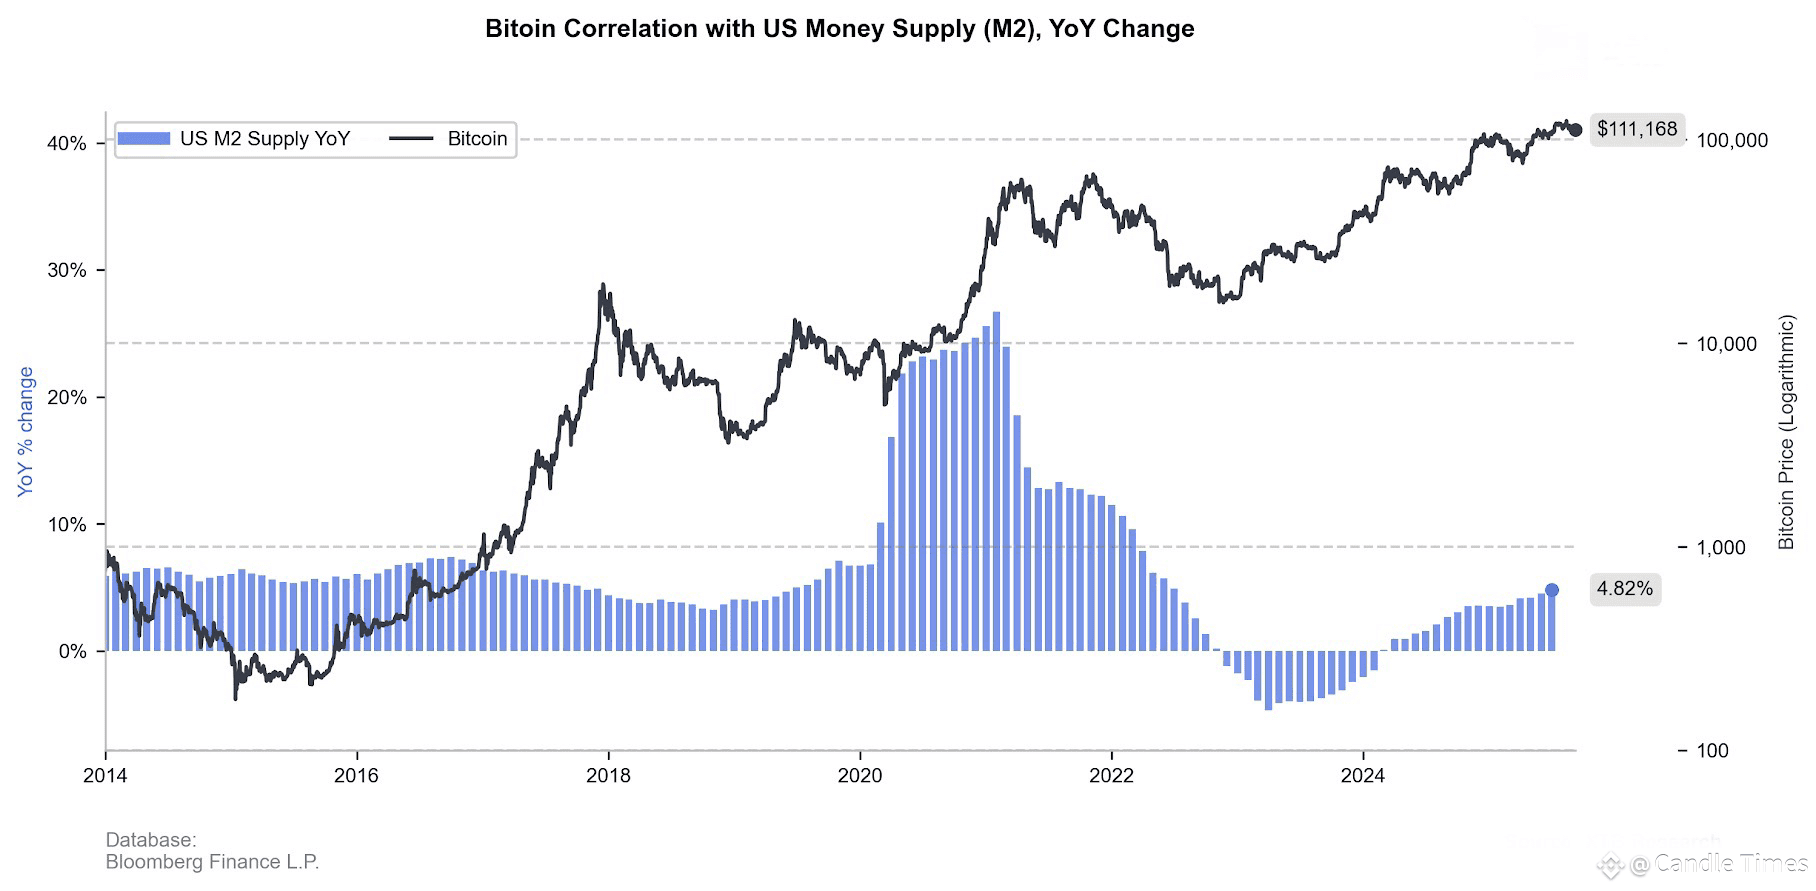
Money supply (M2) on the balance sheets of major central banks is growing, supporting gold and — with a slight lag — expected to support BTC as well.
ETF inflows have weakened
The situation in Bitcoin ETF flows points to some selling, but in relatively small amounts. Overall activity in this group of funds has weakened and currently does not have a decisive impact on prices — on the other hand, a strong increase in net inflows could help Bitcoin climb to new ATHs. Whale supply is not being sufficiently “absorbed.”
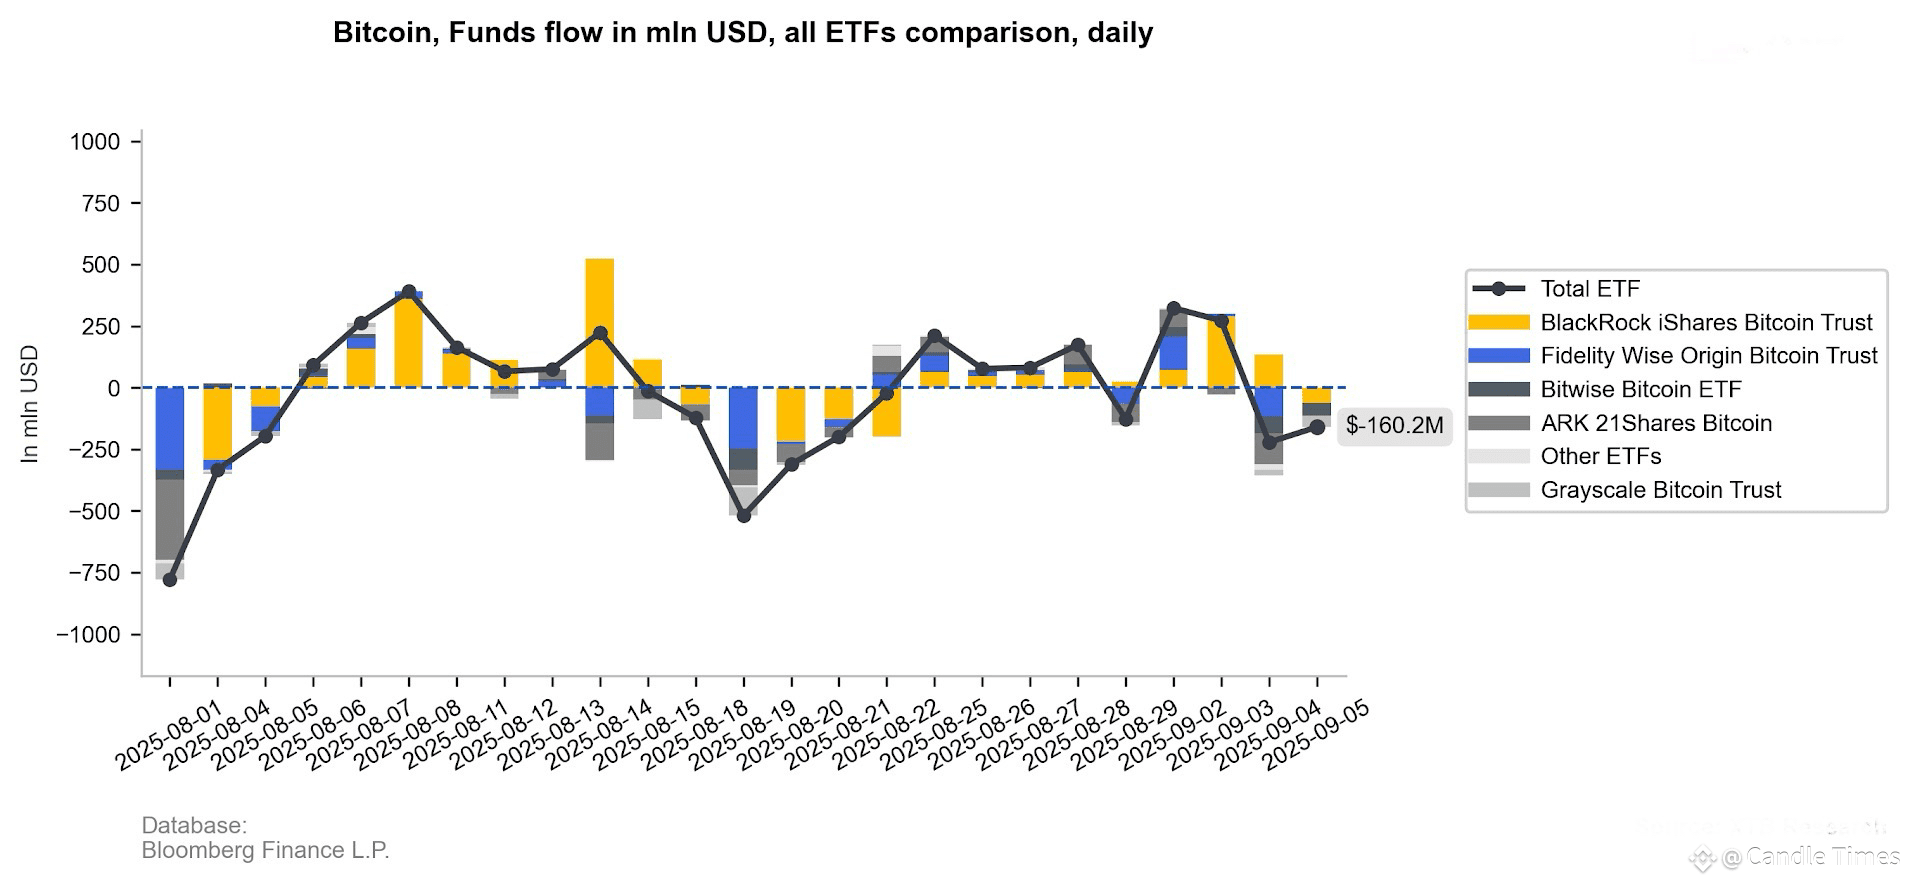
As for #Ethereum we see five consecutive net outflow sessions, though this should not be surprising given the scale of ETF accumulation in recent weeks. BlackRock’s ETF sold over USD 300 million worth of ETH, but even this is not necessarily a bearish price signal, since around August 20 we observed a similar situation, followed by several sessions of net inflows into Ethereum. All this leads to the conclusion that, at this stage, the cooling off is natural and does not yet indicate a strategic withdrawal of capital from crypto.
____
👉 Stay tuned for further updates as we track Bitcoin and Ethereum’s next moves. Follow #CandleTimes for daily insights and key technical levels.

