SOL at a crossroads: traders saw a "triangle", and Solana is already about to break a new record.
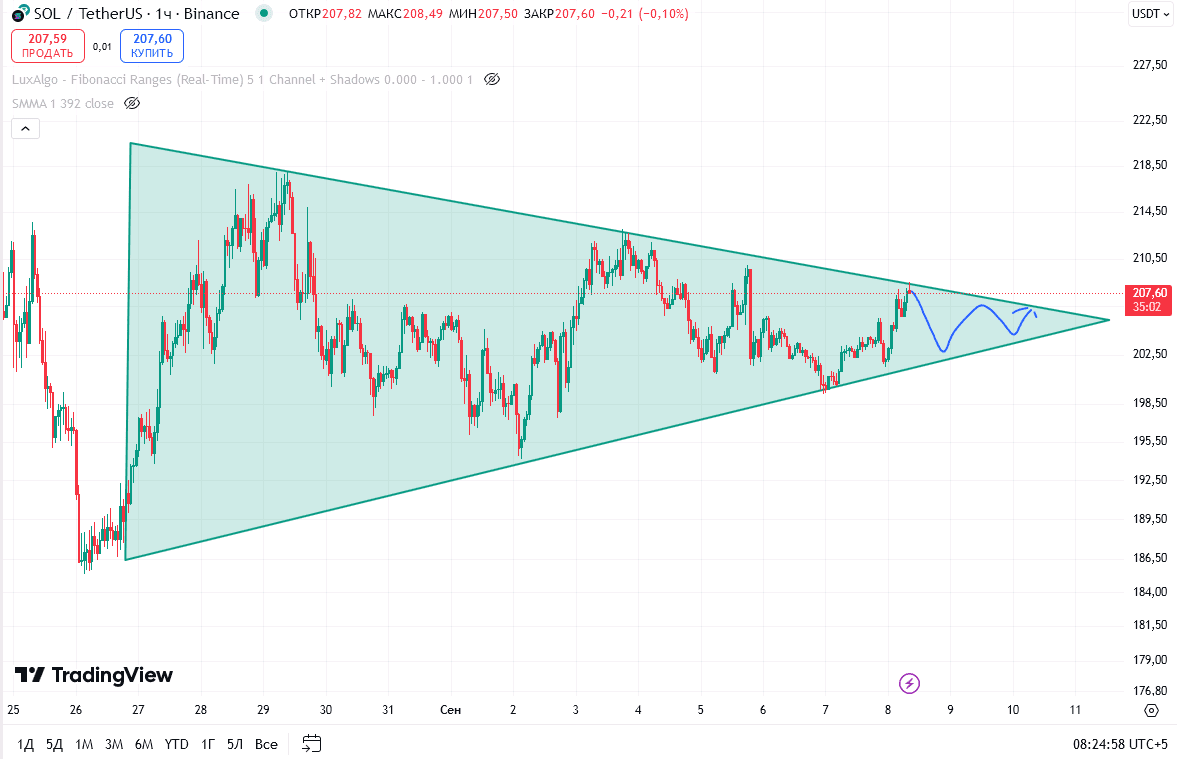
It seems like another Groundhog Day in the crypto world: Solana is trading around $208, and its chart has again drawn a mysterious "symmetrical triangle". For those who are not in the know, this is a figure that means buyers and sellers are standing and looking at each other, hesitant to make the first move. Everyone is tense, but no one is moving.
At the same time, if we look at the numbers, it's as usual:
$209 – this is the nearest resistance (50-SMA) that needs to be broken to go further.
$194.37 – strong support (200-SMA).
The RSI indicator is also in full neutrality — exactly at 52, which means that the market is neither overbought nor oversold. Everyone is just waiting for a miracle. And, judging by the article, this miracle is about to happen.
Where are we going?
Analysts, as always, have drawn two scenarios.
Scenario #1 (optimistic): Solana breaks $209 on good volumes and flies to $212.81 and $217.65. And then it might even reach $250, and who knows, a new historical maximum could be within reach. Just how we like it.
Scenario #2 (for pessimists): If the support at $199.25 cannot hold, we could see a drop to $194.22 and $189.91.
So, that's the whole story. While traders argue about where the price will go from this triangle, some see a new record in their minds, while others foresee a drop back to the bottom. After all, that's always how it is in crypto: either to the moon or into the minus. Meanwhile, the charts are just bored.


