The crypto world is unpredictable, but the real value is long-term! As someone born in the 90s, I went from 100,000 to ten million: I don’t greedily chase small profits and I don’t take reckless risks. Here are 4 strategies to steadily grow over ten years.
As a person born in the 90s, I have long passed the age of 'charging into the world with enthusiasm.' Having been in the crypto circle for nearly ten years, I can call myself an 'old hand'—half due to the experience I've gained and half due to my actual age. Now there are many young people in the crypto space; those born in the 95s and 00s are bold and unrestrained. However, when it comes to the storms I've weathered, I, born in the 90s, have a bit of confidence as someone who has been through it all—after all, we experienced the ICO frenzy of 2017, endured the crash and circuit breaker of March 12, 2020, and witnessed the myth of Bitcoin rising from a few thousand to sixty thousand dollars.
Haste makes waste.
Investing in cryptocurrencies is like gestation; it takes three months to see results and ten months to yield outcomes! Three years in the industry, five years to understand, ten years to become a king! Unfortunately, too many people can't even last two months before they 'abort.' So please keep repeating simple things and persistently do repetitive tasks. Every day you invest in waiting will eventually return to you multiples in due time. Remember, heaven loves the foolish child, and it won't treat you poorly for sticking to long-term value investing!
However, if your investment over ten years still results in losses, or if you have not figured out the so-called market rules, your own investment strategy, or trading system, then you should really ask yourself whether you have been learning how to trade cryptocurrencies or just following the crowd or even playing with cryptocurrencies.
Many people seem to have been trading in the market for a long time, but basically, they are all frequent speculators with short positions, fond of hearsay, even following others' opinions to trade cryptocurrencies, rather than practicing themselves. So, don't say ten years; even if you give you 20 years, 30 years, or 50 years, you will still be destined to lose!
Remember, learning to trade cryptocurrencies is like learning to swim; no matter how many grand principles are discussed, you must get into the water. Swimming is learned through choking on water, not just through theory. Therefore, investing must also involve practical experience. Only by trying and making mistakes can you gradually grow into an expert!
Today, I want to share the technology of the CCL indicator! You may be unfamiliar with this indicator, but it does have its effects!
First, the CCI indicator, in full Chinese, is called the 'Commodity Channel Index.' It is an oscillating indicator used to measure the strength of price trends. It was developed by Donald Lambert in the late 1970s, aimed at normalizing signal data in some engineering disciplines, and later transformed by K. Wood into a technical analysis method applied to trading markets.
Like most oscillating indicators, the CCI indicator is often used by traders to assess the deviation between the current market price and the historical average price, analyzing whether the current deviation exceeds the normal range, capturing signals for trend-following and counter-trend trading.
In trading, traders can find entry and exit points for trend-following and counter-trend trades by referencing the CCI indicator on charts of different time periods, suitable for short-term trading and long-term investment strategies.
The logic and calculation formula of the CCI indicator
Before we delve deeper into the characteristics and application methods of CCI, let's first understand the logic behind the CCI indicator, its calculation formulas, and methods in detail.
1. The Logic Behind
The goal of the CCI indicator is to analyze the comprehensive price trends over a certain period more comprehensively, better reflecting changes and fluctuations in price. In other words, CCI is more cautious, requiring more data than general oscillating indices.
To obtain a more comprehensive data set, the CCI indicator does not only reference the closing prices of candlesticks but also uses the average of the highest, lowest, and closing prices as the calculation basis. This method of calculation is also known as 'Typical Price,' which is the greatest difference between the CCI indicator and other oscillating indicators.
2. Calculation Formula
Step 1:
The first step in calculating the CCI indicator is to find the 'typical price' (TP) of all candlesticks in the specified time period.
The formula is as follows:
TP = (Highest Price + Lowest Price + Closing Price) / 3
Step 2:
The second step is to use the typical price to find the typical price moving average (TPSMA) for the specified time period.
TPSMA = (TP 1 + TP 2 + TP 3 + ... + TP n) / n
Step 3:
This is relatively challenging; finding the Mean Deviation also known as the Average Absolute Deviation. The purpose is to quantify the average distance between data points and the mean, providing information on the overall dispersion of the data.
MD = ( |TP 1 - TPSMA 1 | +...+ |TP n - TPSMA n | ) / n
The '||' in the formula is used to convert negative numbers into absolute values, preventing the analysis from being disrupted by the negative-negative rule.
After introducing the three required calculation methods above, we will enter the final calculation step of CCI, referencing the above data into the CCI formula.
CCI index = (TP t - TPSMA t) / (0.015 X MD t)
In the formula, t represents the data on the current candlestick, while 0.015 helps ensure that 70% to 80% of the CCI data is summarized within the +100 and -100 range.
Although the CCI formula looks quite complex, applying the CCI indicator to the charts is relatively simple and understandable. Generally, chart software that provides the CCI indicator will calculate it automatically, and traders do not need to calculate it themselves.
How to Read the CCI Indicator
After understanding the logic of the CCI indicator and its calculation methods, we will now delve into how to read the CCI indicator and how to apply it in trading.
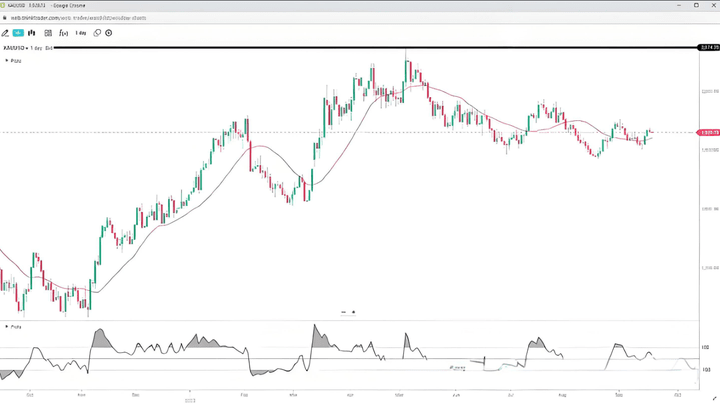
Figure 1
As shown in the upper part of Figure 1, the gray line displayed at the bottom of the chart is the CCI indicator (Commodity Channel Index).
The default reference setting is the typical price of 20 bars, and most of the resulting data will be summarized within +100 and -100. This type of data is defined as the normal range, with little difference between the current price and the margin.
When the CCI indicator data exceeds +100 or falls below -100, it indicates that the current price's distance from the average price has exceeded the normal range, resulting in overbought or oversold phenomena.
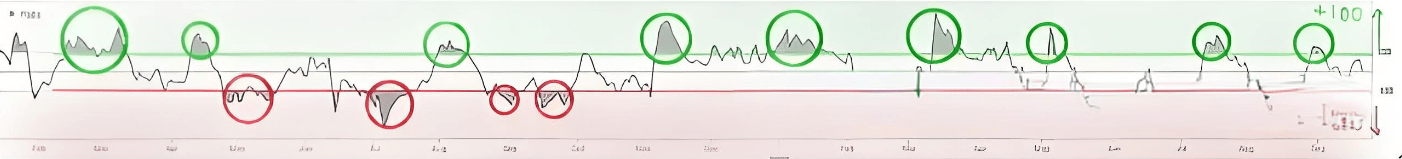
Figure 2
The above figure 2 serves as a sample illustration:
The cyan area is the overbought zone, while the area circled in cyan represents the overbought phenomenon. When the CCI index data exceeds +100, it indicates that the current price's distance from the average price has exceeded the normal range, leading to an overbought phenomenon.
Conversely, when the CCI indicator data falls below -100, it indicates that the current price's distance from the average price is below the normal range, resulting in an oversold phenomenon. The red area in Figure 2 is the oversold zone, with the area circled in red representing the oversold phenomenon.
Next, we will learn how to identify buy and sell points through this technical analysis.
How to Use the CCI Indicator
In this technical analysis, traders will focus their attention on the overbought zone (above +100) and the oversold zone (below -100).
This is because, for most of the time, CCI data usually has a 70% to 80% chance of being within the +100 and -100 range. The probability of activating buy and sell signals will only account for 20% to 30%.
Compared to other oscillating indicators, the signals from CCI are quite special. When the indicator enters the overbought zone, it signals to go long, while when the indicator enters the oversold zone, it signals to go short.#SECETF审批
Next, we will use this as a reference to find buy and sell points on the chart.
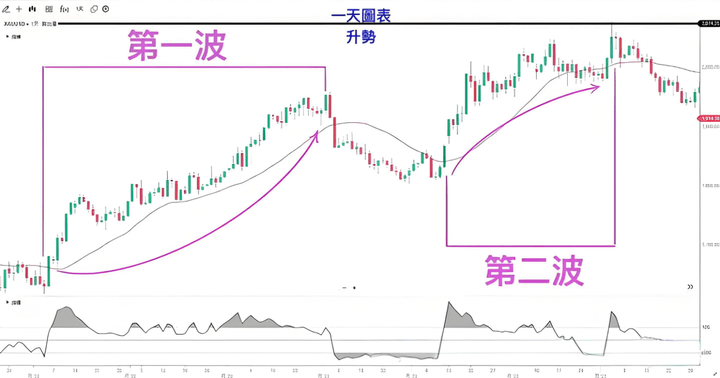
1. Go long through the overbought zone
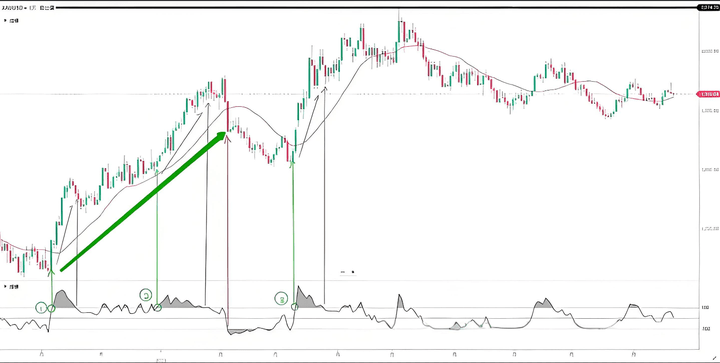
Figure 3
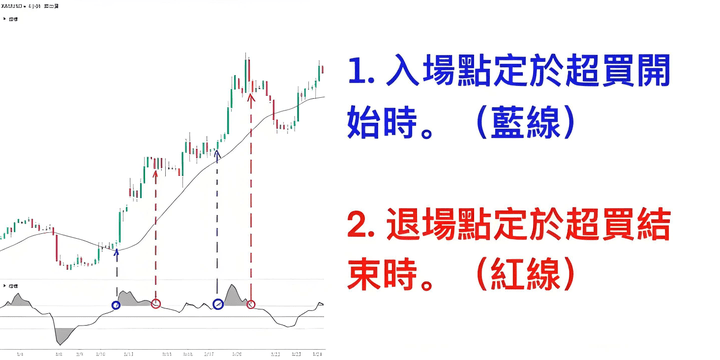
1. In the above figure 3, whenever the CCI indicator begins to enter the overbought zone (marks 1, 2, 3), traders can enter to go long. From the above figure, it can be seen that during an uptrend, each time the CCI indicator breaks into the overbought zone is a very good entry point.
2. After going long, traders can take profit when the indicator falls out of the +100 overbought zone (brown line) in the short term. If traders are confident, they can hold for the medium to long term until the CCI indicator enters the oversold zone (red vertical line) before taking profit.
3. Stop loss can be set at the point where the CCI index is 0. This is because when there is no profit support, and the CCI index has retraced to 0 in a short time, the gap between the current price and the average price has returned to zero, indicating that the momentum of this rise is no longer strong.
Traders should patiently wait for the next wave of rise before entering to go long.#美国当周失业金人数
2. Go short through the oversold zone
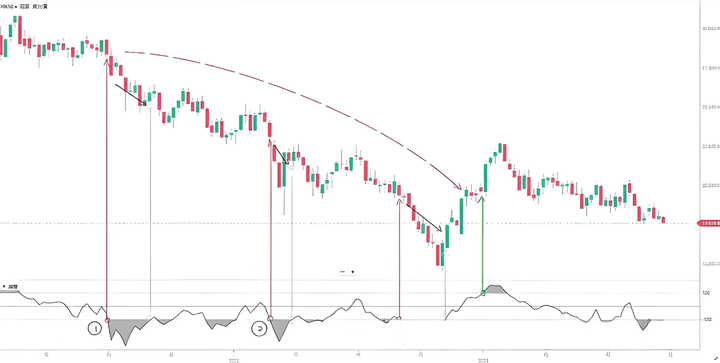
Figure 4
1. In Figure 4, whenever the CCI indicator begins to enter the oversold zone (marks 1, 2, 3), traders can enter to go short. From the above figure, it can be seen that during a downtrend, each time the CCI indicator breaks the oversold zone is also a good entry point.
2. After going short, traders can take profit when the CCI rises out of the -100 oversold zone (light blue line) in the short term. If traders are confident, they can hold for the medium to long term until the CCI indicator enters the overbought zone (dark blue line) before taking profit.
3. Stop loss can be set at the point where the CCI index is 0. This is because when there is no profit support, and the CCI index has retraced to 0 in a short time, the gap between the current price and the average price has returned to zero, indicating that this drop may have ended.
Traders should patiently wait for the next wave of decline signals before entering to go short.#币安HODLer空投OPEN
3. The Divergence Strategy of the CCI Indicator
In addition, traders can identify divergences between financial products and the CCI indicator to discover that the trend of the financial product is about to end, indicating a pullback or rebound.
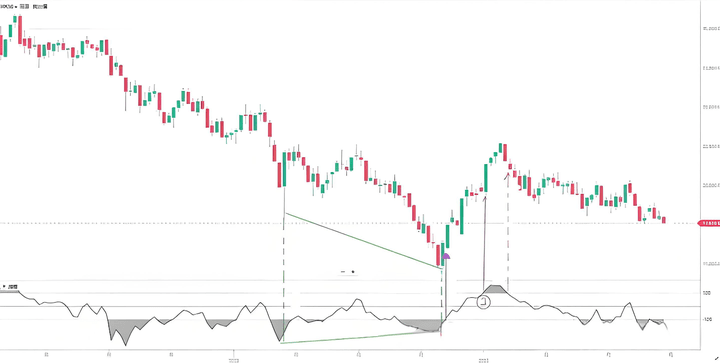
Figure 5
The definition of divergence is the discrepancy between the price trend and the CCI indicator's trend.
Bullish divergence indicates a strengthening price trend, but the CCI index's trend is weakening. This is a signal that a stock's upward trend is about to end; while bearish divergence represents a weakening price trend, but the CCI index does not appear to be as weak. This indicates that the stock may be about to end its downward trend and enter a rebound.
Figure 5 is the same as Figure 4. If traders can identify divergence signals from the chart, they can effectively grasp the profit-taking point for shorting at mark 1 and switch to going long. Compared to entering long at mark 2, the profit from long at mark 1 is at least doubled.
By discovering divergences, traders can seize opportunities before others react, capturing the chance for financial products to rebound from lows, gaining more profits and reducing loss risks.
How to Set the Parameters of the CCI Indicator
Due to the differing volatility, trading volume, and the purposes of traders across various financial products, the default parameters of the CCI indicator are not set for all financial products.
From the logic of CCI indicator calculations, we can see that the purpose of the CCI indicator is to identify the abnormal probabilities of 20% to 30% in product prices, and then decide whether to place an order. The remaining 70% to 80% of the time should show a normal trend, with little difference between the current price and the average price.
Then we should adjust the parameters based on this logic. There should not be too many signals of overbought or oversold, nor should there be no signals at all. This can be adjusted by changing the number of short lines included to adjust the probability of overbought or oversold signals.
When the set K-line parameters are fewer, the CCI indicator's fluctuations will be larger and will more frequently touch the overbought and oversold zones. When the number of K-lines is increased, the CCI indicator's fluctuations will be relatively stable, and the opportunities to touch the oversold and overbought zones will decrease.
Traders should first understand the characteristics of a financial product, such as:
Active trading time periods (the more active, the more K-lines);
Trading volume (the larger the volume, the more K-lines);
Traders' objectives (the shorter the line, the more K-lines);
News Sensitivity;
Most traders' areas and personalities.
Traders must understand that technical analysis is both a science and an art. One hundred people may draw one hundred different technical analyses, leading to many conclusions and strategies. By finding suitable trading perspectives, strategies, and parameters, success rates can be significantly improved.
How to Combine with Other Technical Analyses
In trading, traders should use at least two or more technical analyses to achieve mutual affirmation and reference.
The first: The simplest is the combination of the CCI index on two timeframes.
In analysis, traders can derive the larger direction and entry timing by comparing similar or different types of technical analyses in different time charts.
In larger time frame charts, find the major trend of financial products and decide to follow the trend. The CCI indicator serves as a reference for entry and exit points.
Using the CCI indicator as a reference, wait for entry points that align with larger time frame trends.
This method allows traders to better grasp the entire trend of a small trend wave, effectively avoiding the drawbacks of trend chasing.
Second: Combine the CCI index with the trend lines drawn on the chart, supporting assistance lines and other tools.
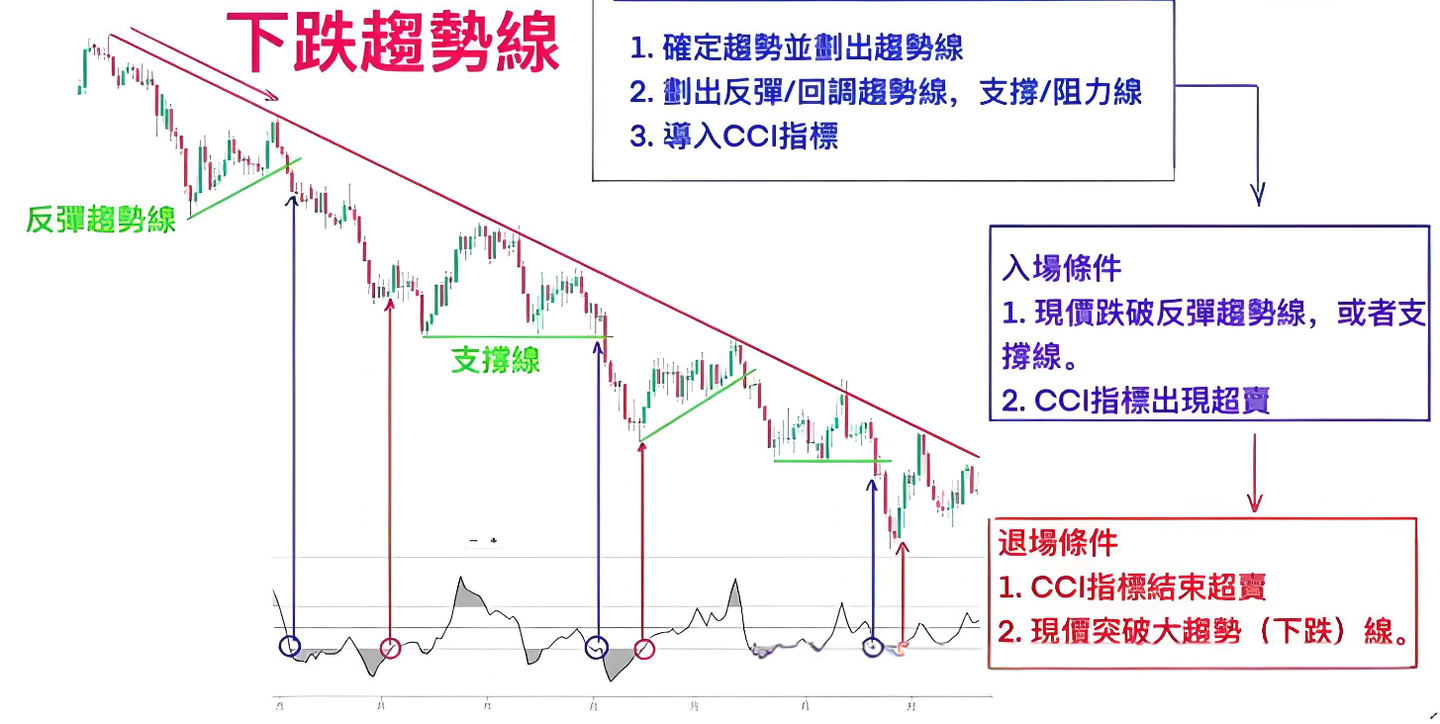
Draw trend lines, support lines, and resistance lines.
Go long when CCI enters the overbought zone and breaks the downward trend line or support line.
Go short when CCI enters the oversold zone and breaks the upward trend line or support line.
This method is relatively cautious; traders may enter the market a bit late, but the advantage of this strategy is that it has double confirmation, increasing the chances of profit.
There are many other technical analyses that can be combined with the CCI indicator. As long as traders understand that the ultimate goal of CCI is to identify abnormal price fluctuations of financial products, they can integrate it well with other technical analyses.
Notes on Using the CCI Indicator
If you understand in detail, traders will not find it difficult to discover that the CCI indicator is derived from analyzing past data. This indicates that the CCI indicator cannot fully represent the current market perspective. It can only be used as a reference indicator.
Traders must analyze based on existing conditions. Use this technical analysis under the premise that the CCI indicator does not conflict with the current situation.
As a member of oscillating indicators, the CCI indicator is more suitable for use in sideways trends. Traders can maximize profits in sideways markets through CCI indicator analysis.
Like every technical analysis, the CCI indicator will also have times when it fails. Traders should have good planning and self-control, do their homework and risk management to avoid being liquidated by the market and suffering losses they cannot bear.
What I want to share in the end are the six major rules for survival in the cryptocurrency world!
I. Capital Management: 1% Risk Rule Locks in the Bottom Line The single trade risk must never exceed 1% of the principal; this is a rule for survival. Algorithm: With a principal of 100K, the maximum loss per trade is 1,000, backtrack to position (e.g., BTC contract stop loss 3%, 10x leverage, each time can only open a 3,333 position). Split Funds: 5 parts of capital, 3 parts for trends, 2 parts for swings. Stop trend orders if one part is completely lost, pause if there are two consecutive losses in swing trades. Last year, students using this method with a capital of 50K earned 20K in a year, with a maximum drawdown of only 8%.
II. Double Insurance for Stop Loss: Technical + Capital Dual Lock Technical Stop Loss: Trend orders look at 4-hour MA20, cut if it breaks; swing orders use 2×ATR (e.g., ATR500 cuts at 1000). Capital Stop Loss: Cut immediately when losses reach 1% of total capital, regardless of technicals. Harsh Move: Use conditional orders to set stop losses in advance, set when placing orders, letting the system manage it.
III. Dynamic Position Balance: Keep 30% Cash in Bull and Bear Markets Bull Market Position = (Current Price ÷ Historical High) × 100% (e.g., BTC5W ÷ Previous High 69K ≈ 72% Position). Bear Market Position = (Historical Low ÷ Current Price) × 30% (e.g., BTC3W ÷ Previous Low 15K × 30% = 15% Position). Adjustment Signal: Weekly MACD golden cross increases by 10%, add 10% position; death cross decreases by 10%, reduce 10% position, mechanical operation to avoid emotions.
IV. Market Filtering: 90% of the market should be abandoned Only act on three-cycle resonance: Only go long when weekly MA5 is above MA20, otherwise short, with cash held during sideways markets. Trade volume must increase by more than 1.5 times, otherwise, it's a false market. Only enter at the beginning/mid-month of a bull market or quarter-end of a bear market, avoiding the three days before and after delivery.
V. Emotional Management: Mechanical execution replaces the brain Transform trading into a production line, standardizing decision-making with execution tables: Exit when profits reach 30%, cut losses at 1% immediately. A violation results in a 24-hour trading halt, using rules to counter human weaknesses.
VI. Bear Market Survival Anti-Common Sense Techniques Asset Reallocation: 80% Altcoins to BTC, the least drop rebounds the fastest. Options Insurance: For every 20% drop, spend 1% of capital to buy call options; in January 2023, $16K, 5,000 options earned $30K. Frequency Reduction: Trade once a month, saving 80% on fees.
Conclusion: The ultimate secret to survival is to acknowledge the ordinary. I rely on a simple method — strict capital management, mechanical execution, 90% of the time in cash, and steady annual growth in the account. The rules of the cryptocurrency world are not about offense but defense; endure until the bull market, and a 20% annual compound return is already a winner.
The above are some of Yan An's thoughts and insights. If you find them helpful, please like and save them. I am Yan An, experienced through three rounds of bull and bear markets, skilled in logical coin selection and technical timing, engaging only in trades within my cognitive range, with each direction confirmed by market performance!
No matter how diligent a fisherman is, he will not go out to sea to fish during a storm; rather, he will carefully protect his boat. This season will eventually pass, and a sunny day will surely come! Follow Yan An, and I will teach you both fishing and how to fish. The door to the cryptocurrency world is always open. Only by going with the trend can you have a life in sync with the trend. Save it, and keep it in mind!


