【3 Major Survival Rules】
One,
Capital Iron Rule: First survive, then talk about making money
Split Position Strategy: Use only 10,000 from a 100,000 principal to test the waters (Total position ≤ 20%)
Single Stop Loss: Loss exceeds 2,000 yuan (2% of total capital) immediately cut losses to survive
Leverage Forbidden Zone: Newbies are prohibited from using leverage / veterans ≤ 10% (Risk of liquidation reduced by 80%)
Two,
Core Strategy: Focus to win
One-way Sniping: Choose only one direction (Success rate increases by 60%)
Mechanical Operation: 3% stop loss line + 5% take profit point (Strict execution doubles survival rate)
Golden Time: The highest winning rate in the first 2 trades each day (Winning rate drops by 40% after 3 trades)
three,
Fatal taboos: 90% of the money lost is due to these
Adding to positions against the trend: Risk of liquidation for each additional position × 3
High-frequency trading: Fees eat up 50% of profits
Floating profits turn into losses: 93% of margin calls start with "waiting a little longer"
[Actual Case Analysis]
Blood and tears case: 100,000 yuan principal → 0 in 3 days
Day 1: Full position, 10x long order (wrong use of leverage)
Day 2: 5% drop to cover the position and close the position (violating the position splitting rule)
Day 3: Continue to hold the order until the position is liquidated (ignoring the stop loss)
Correct demonstration: 100,000 stable value-added
Strategy: 20,000 base position + 3% stop loss + 5% take profit
Operation: 2 deterministic transactions per week
Result: 8% monthly return (151% annualized compound interest)
[Master's Secret Formula]
Three Dos and Three Don'ts: Invest your spare money; Maintain ironclad discipline; Fight unilaterally, not all-in; Don't resist single sided actions; Don't block both ends.
Final warning: Contracts are not casinos! Those who use one year's living expenses to earn three years' worth of income will ultimately become the leeks that are harvested.
Remember: use your spare money, be disciplined, and survive!
From 100U to 10,000U! The best way to counterattack with a small amount of capital, with three strategies to help you break through:
Phase 1: 100U Bravely Pass Three Levels
In the initial stage, only 100U is used each time, aiming at hot currencies for gambling, and strictly setting the stop-profit and stop-loss points.
The goal is to achieve a triple jump: 100U → 200U → 400U → 800U
The maximum number of attempts is three! Because in the cryptocurrency world, luck is indispensable. Even if you can make a profit nine times in a stud-style game, a single liquidation may make all your efforts go to waste.
If you successfully pass the three levels and your principal rolls over from 400U to 1100U, you can enter the next stage.
The stop-loss and take-profit methods at this stage:
Take Profit: Set a fixed profit target ratio. When the price of the hot coin rises by 20%, decisively take profit and turn the principal of 100U into 120U.
Stop-loss: To control risk, set a strict stop-loss ratio. Once the price of a hot coin drops by 10%, stop-loss will be immediately issued, even if the price subsequently rises.
Phase 2: Three strategies implemented simultaneously
When the principal reaches 1100U, the following three strategies are used to comprehensively improve investment efficiency and security:
Ultra-short order (quick attack)
Trading level: 15 minutes
Trading Target: Only select Bitcoin (BTC) and Ethereum (ETH)
Advantages: Potentially higher returns.
Risk: High risk, suitable for small positions (10%-20% of the principal each time)
Strategy order (stable income)
Trading level: 4 hours
Leverage used: 10x leverage, each investment amount is controlled at around 15U
Investment strategy: Use the profit portion to invest in Bitcoin (BTC) with a fixed weekly investment
Advantages: Risk is within a controllable range, which helps to gradually accumulate capital trend orders (medium and long term)
Trading level: daily or weekly level.
Investment strategy: Patiently wait for the right entry point and set a high profit-loss ratio (e.g. 1:3)
Advantages: Once you seize the market, you will get huge returns, especially suitable for operations under big market conditions
Note: Be patient and wait for opportunities, avoid frequent operations
Finally, I will share the buying points of the "Seven Bottom Patterns"! ! ! Every sentence is essential, I recommend saving it! !
1. Double Peak Reversal
A double-peak reversal refers to two peaks formed at the top or bottom of the price, also known as a double top and double bottom. People often call it an "M" or "W" type reversal.
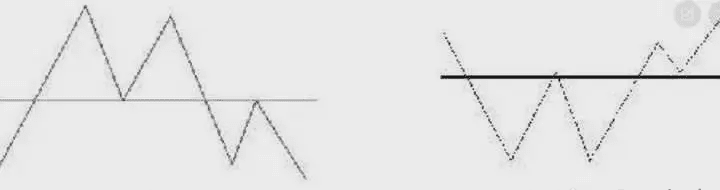
The double peak reversal pattern does not necessarily mean a price reversal. It is also possible that the price will rise in the process of falling back to the neckline and being supported by the support line. In this case, the price will move in the area between the support line and the previous two high points, forming various patterns such as triple tops and triangles, but this possibility is very small.
The greater the distance between the two peaks, that is, the longer it takes to form the two tops and bottoms, the greater the potential for a double top reversal in the future, and the more intense the fluctuations after the reversal.
The rise (fall) after the double peak pattern breaks out is 1-3 times the neck height of the pattern itself.
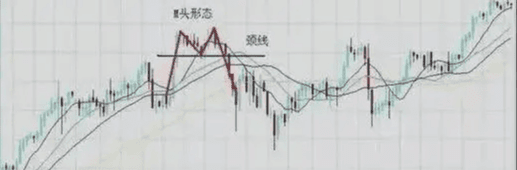
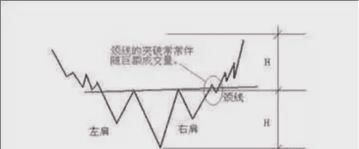
2. Head and Shoulders
This is a long-term trend reversal pattern that usually appears at the end of a bull market.
The head and shoulders reversal pattern has three peaks. The middle peak is higher than the other two, so it is called the head. The two peaks on the left and right are lower and are called the shoulders.
When the neckline of the head and shoulders top is broken, it is a real sell signal. Although the price has fallen considerably compared to the highest point, the decline has just begun, and investors who have not sold continue to sell.
When the neckline is broken, we can use the minimum drop measurement method of this pattern to predict the price level. This measurement method is to draw a vertical line from the highest point of the head to the neckline, and then measure down the same distance from the point where the right shoulder breaks through the neckline. The price thus measured is the minimum drop of the stock.
Examples:
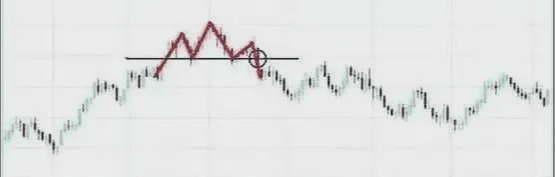
【Blue circle is a reference sell signal】
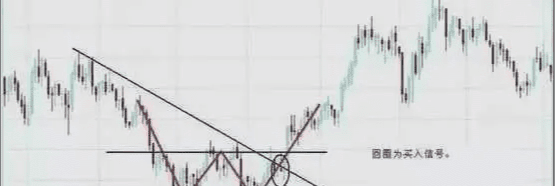
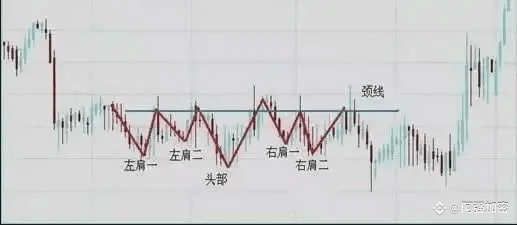
3. Head and Shoulders Bottom
(1) The shapes of the head and shoulders top and the head and shoulders bottom are similar.
(2) When the neckline of the head and shoulders bottom is broken, it is a real buy signal. Although the price has risen a certain distance compared to the lowest point, the upward trend has just begun, indicating that investors who have bought should continue to buy. The method of measuring the minimum increase is to draw a vertical line from the lowest point of the head to intersect the neckline, and then measure upward from the point where the right shoulder breaks through the neckline to the same height. The measured price is the minimum increase of the stock.
In addition, when the neckline resistance is broken, there must be a surge in trading volume, otherwise it may be a false breakthrough. However, if trading volume gradually increases after the breakthrough, the pattern can also be confirmed.
(3) Generally speaking, the head and shoulders bottom pattern is relatively flat, so it takes a longer time to complete.
(4) After breaking through the neckline, there may be a temporary pullback, but the pullback should not be below the neckline. If the pullback is below the neckline, or if the price falls back at the neckline level and fails to break through the neckline resistance and falls below the head, this may be a failed head and shoulders bottom pattern.
(5) The head and shoulders bottom is one of the most predictive patterns. Once confirmed, the increase will usually be greater than its minimum increase.
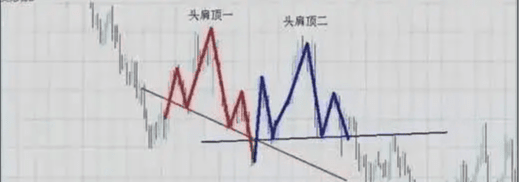
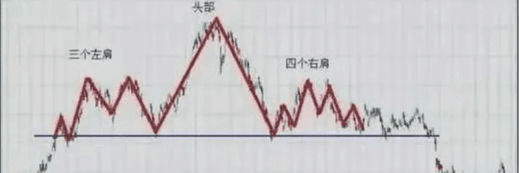
There are many special forms of the head and shoulders reversal pattern, namely the compound head and shoulders pattern. The analysis method is the same as that of the head and shoulders reversal pattern. Several common forms are listed below to help you deepen your impression.
4. Triple Top (Bottom)
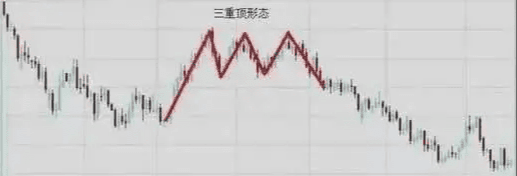
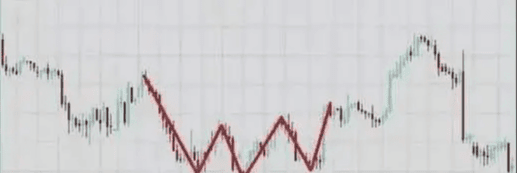
Any head and shoulders pattern, especially when the head doesn't extend far enough beyond the shoulders, can be called a triple top or bottom. A triple top is very similar to a double top, except it has an additional top, and the tops are much wider and deeper. A triple bottom is an inverted triple top, but with the same analytical implications.
5. Round bottom (top)
The price rises in a solitary pattern. That is, although it continues to rise, each high point is quickly followed by a decline. First, the new high point is higher than the previous one, and then the recovery point is slightly lower than the previous one. Connecting the short-term high points in this way forms a circular top. The trading volume also forms a circular shape.
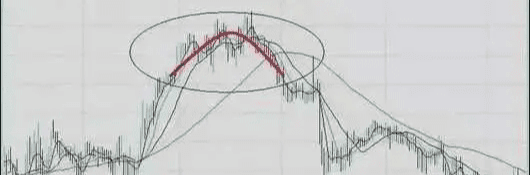
(1) Sometimes, after a round head forms, the price does not immediately fall, but instead moves sideways to form a range of fluctuations called a handle. Generally, the handle breaks through quickly, and the price continues its downward trend as expected.
(2) Circular reversals occur at both tops and bottoms of prices, with similar patterns but opposite meanings.
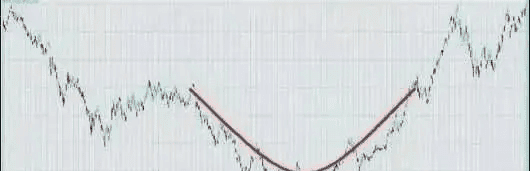
At the bottom, the price falls in a solitary shape. Initially, the pressure on the sellers gradually decreases, so the trading volume continues to decline, but the buying power is still hesitant. Although the price falls at this time, the range is slow and small, and its trend curve gradually approaches the horizontal.
At the bottom, buying and selling forces reach a state of equilibrium, so there is only very small trading volume. Then demand begins to increase, prices rise accordingly, and finally buyers completely control the market, prices rise sharply, and a breakthrough upward situation occurs.
Trading volume initially slowly decreases to a low level, then increases again, forming a rounding bottom. This pattern indicates the impending arrival of a significant market rally. Investors can buy in at the beginning of a sharp rise in the rounding bottom's upward trend.
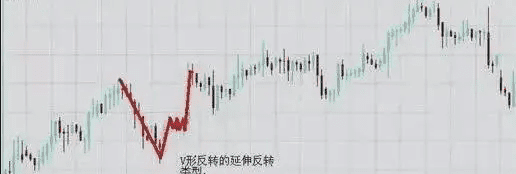
6. V-shaped reversal and extended V-shaped reversal
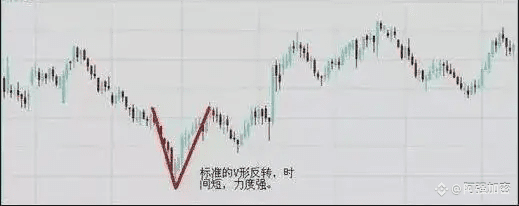
Downward phase: Usually the left side of the V-shaped decline is very steep and lasts for a short period of time.
Turning Point: The V-shaped bottom is very sharp. Generally, this turning point forms within just three or two trading days, and trading volume increases significantly at this low point. Sometimes, a turning point occurs during a panic trading day.
Recovery phase: Prices then recover from their lows, and trading volume also increases.
When the price breaks through the top of the extended V-shaped hovering zone, there must be an increase in trading volume. When it falls below the bottom of the inverted extended V-shaped hovering zone, there is no need for an increase in trading volume.
Morphological significance:
Due to the strong power of sellers in the market, prices have been falling steadily and continuously. When this selling force disappears, the power of buyers completely controls the entire market, causing prices to rebound dramatically, recovering all lost ground at almost the same speed as when they fell. Therefore, the price movement on the chart forms a V-shaped moving trajectory.
The inverted V-shaped pattern is just the opposite. Optimistic market sentiment drives prices higher, but a sudden factor reverses the trend, causing sellers to sell at the same speed as they rose, forming an inverted V-shaped movement. This pattern is usually caused by unexpected factors that even well-informed investors cannot foresee.
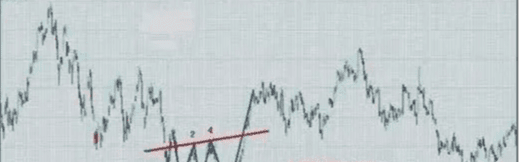
7. Expanded reversal type (horn type)
After a period of price increases, prices fall, then rise again and fall again. The highs of the rises are higher than the previous highs, and the lows of the falls are lower than the previous lows. The entire pattern begins with a narrow fluctuation and then expands both upward and downward. If we connect the highs and lows above and below, we can draw a triangle that is a mirror image. This is the trumpet shape.
In terms of trading volume, the trumpet-shaped pattern maintains high and irregular trading volume throughout the formation process. The trumpet-shaped pattern is divided into rising and falling types, and their meanings are the same.
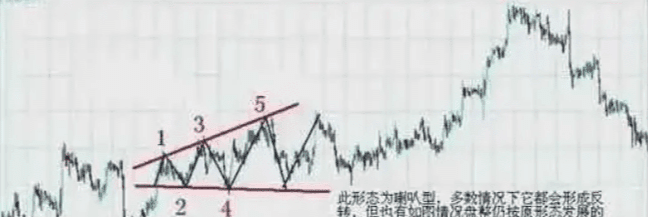
A typical trumpet pattern has three highs and two lows. These three highs are higher than the previous ones, while the two intermediate lows are lower than the previous ones. When the price declines from the third high, and the low is lower than the previous low, the pattern is considered established. Like the head and shoulders top, the trumpet pattern is a "five-point reversal" pattern. Therefore, a more gradual trumpet pattern can also be considered a head and shoulders pattern with a higher right shoulder and a downward-sloping neckline.
The trumpet-shaped pattern is caused by investors' impulsive and irrational emotions, so it rarely appears at the bottom of a falling market. The reason is that after prices have fallen for a period of time, investment willingness is weak, so it is impossible for this pattern to form in a depressed market atmosphere.
There is a saying that I strongly agree with: the boundaries of knowledge determine the boundaries of wealth, and people can only earn wealth within the boundaries of their knowledge.
You must have a good mentality when trading cryptocurrencies. Don't let your blood pressure soar when there is a big drop, and don't get carried away when there is a big rise. It is more important to lock in your profits.
For people without many resources, being down-to-earth is the irrefutable way of survival. Good luck!
I need fans, you need references. It's better to pay attention than to guess.
$ETH $XRP $BNB #美联储降息预期 #上市公司囤币潮 #币安HODLer空投SOMI
