🟢 Trend & Structure
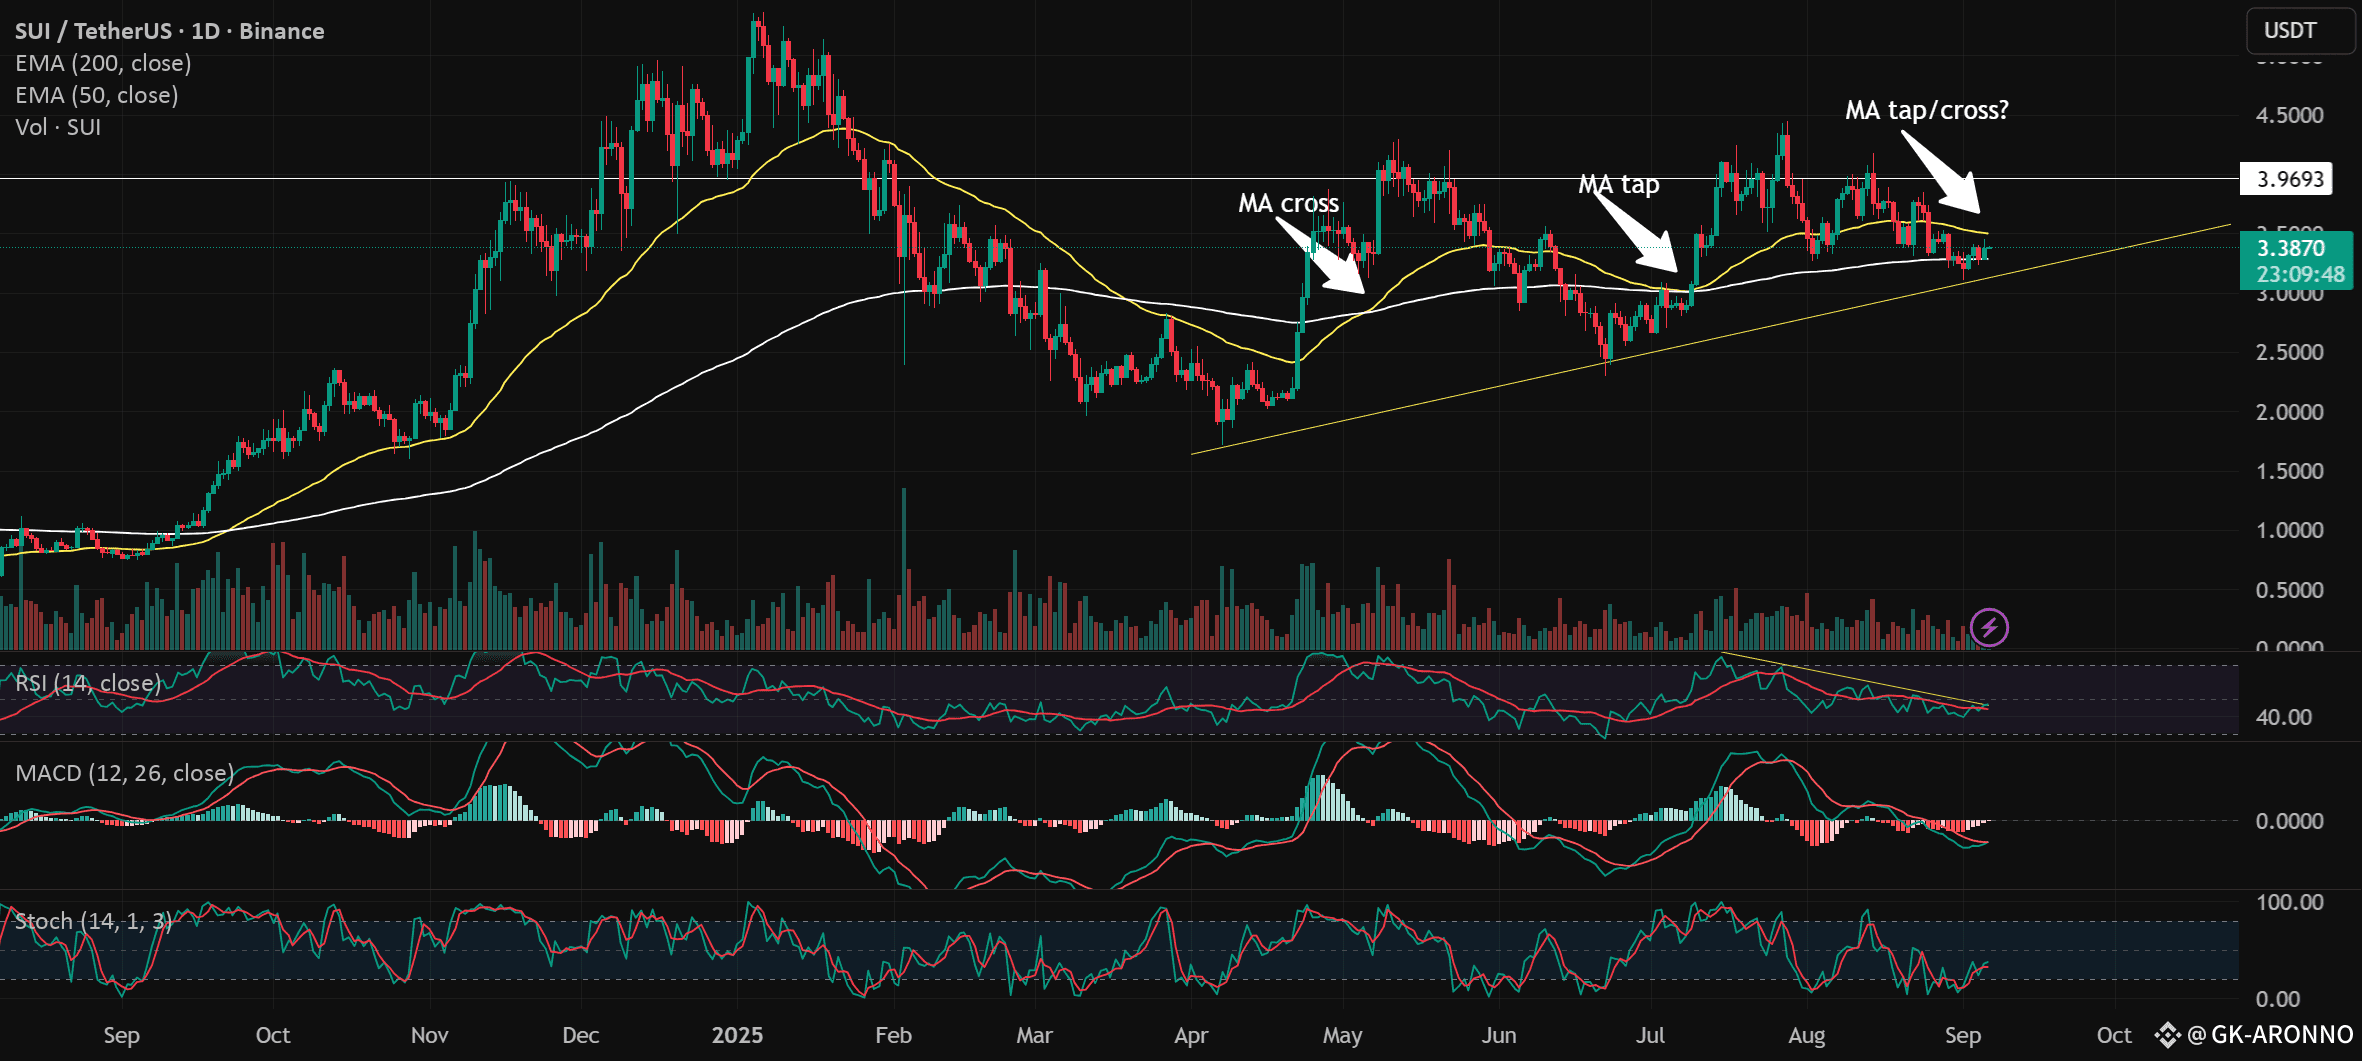
Since April, SUI has been respecting a clear upward support trendline, tapped 3 times and holding firmly. This validates the bullish structure and sets the stage for a potential ascending triangle pattern, with higher lows pressing against the $3.9 resistance zone.
Ascending triangles are typically continuation patterns, but they require volume expansion to confirm. Without that, they can just as easily break down.
📉 Moving Averages (MAs)
In May, we saw a golden cross (50 EMA crossing above 200 EMA) which shifted the broader bias to bullish.
In July, price retested the 200 EMA successfully, respecting long-term support.
Today, SUI trades above the 200 EMA (~$3.28) but remains below the 50 EMA (~$3.49).
This creates a squeeze zone between the two averages. A decisive move out of this range will set the next direction.
📊 Indicators
RSI (14): Currently around 44, sitting below 50. This shows bearish momentum bias, though not in oversold territory.
MACD: Both lines are below zero, histogram is red but fading. This hints at a potential bullish crossover, but not confirmed yet.
Stochastic: Rising from oversold levels but still in the bearish half of the range. Needs to break above 50 to show strength.
Overall, indicators lean bearish-to-neutral, with some early signs of possible reversal.
🔉 Volume Profile
Volume has been declining steadily since July, showing weakening demand. For any breakout above $3.9 to hold, we would need to see a clear surge in buying volume.
🎯 Key Levels to Watch
Support:
$3.28 (200 EMA).
If broken, downside targets $2.76 (Fib 0.618 golden ratio) as the next logical support.
Resistance:
$3.70 (Fib 0.236).
$3.90–$4.00 horizontal zone. A clean breakout above this on strong volume would confirm the ascending triangle pattern and likely extend the uptrend.
⚠️ Fundamental Catalyst – Token Unlock
On October 1st, 2025, 44M SUI tokens will be unlocked. Unlocks increase circulating supply and often add short-term selling pressure. Combined with SUI trading near key support/resistance levels, this event could act as the catalyst for a decisive move — either breaking down support or fueling a breakout if demand absorbs supply.
📈 Outlook & Scenarios
At this stage, SUI’s chart shows mixed signals:
Bullish case: If price continues to hold above the 200 EMA and demand returns, an attempt toward $3.7–$3.9 resistance is likely. A breakout above $3.9 would confirm continuation of the uptrend.
Bearish case: If $3.28 fails, a retrace toward the $2.76 Fib support becomes the higher-probability path.
Bottom Line:
SUI is at a decision point. Structure is bullish, but indicators lean bearish, and volume is weak. The October 1st unlock may be the trigger that decides whether this ascending triangle plays out to the upside or breaks down toward deeper support.

