Full Analysis
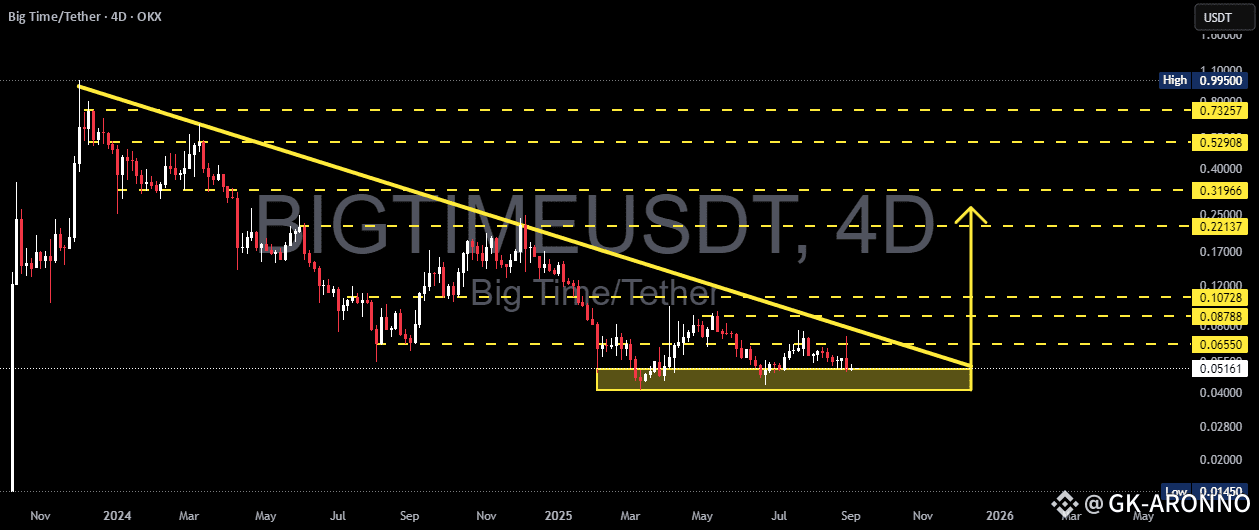
The BIGTIME/USDT chart on the 4D timeframe (OKX) shows a prolonged downtrend with consistent lower highs, capped by a strong descending trendline (yellow). At the same time, price has been holding within a major support zone between 0.038 – 0.055 USDT (yellow box).
This structure forms a Descending Triangle — a classic pattern that often signals bearish continuation, but in some cases, it can also mark the final stage before a strong bullish reversal. Price is now approaching the apex of the triangle, meaning a major breakout (up or down) could happen soon.
---
🔹 Bullish Scenario (Breakout Reversal)
If buyers manage to break the descending trendline with a strong 4D close and higher volume, momentum could quickly shift to the upside. Key resistance levels to watch:
0.0655 USDT → First breakout confirmation.
0.0879 USDT → Next target.
0.1073 USDT → Critical mid-term resistance.
With enough momentum, BIGTIME could extend toward 0.2213 USDT or even 0.3196 USDT in the longer run.
📌 Note: A valid breakout usually comes with a volume spike and a successful retest above the broken trendline.
---
🔻 Bearish Scenario (Breakdown Continuation)
If selling pressure dominates and price loses the major support box 0.038 – 0.055 USDT, the downtrend is likely to extend.
Breakdown below 0.038 USDT on strong volume → clear bearish confirmation.
Next support area: 0.028 – 0.030 USDT.
Extreme target: retesting the historical low at 0.0145 USDT.
📌 Note: Statistically, descending triangles have a higher probability of breaking down, but confirmation is key.
---
⚖️ Technical Summary
Critical Zone: 0.038 – 0.055 USDT (main support).
Bullish confirmation: Break and close above trendline + 0.0655 USDT.
Bearish confirmation: Breakdown and close below 0.038 USDT.
Current pattern: Descending Triangle nearing its apex → Expect a decisive move soon.
BIGTIME is entering a high-pressure zone. In the coming weeks, the market will reveal whether this is the bottom before a reversal, or the continuation of a deeper downtrend.