Trading doesn't have to be overwhelming. By leveraging straightforward chart analysis, you can execute targeted trades and steadily build your portfolio. The key instrument: the 5-minute candlestick chart.
Why 5-Minute Candles Stand Out 🕒
Unlike daily overviews, this timeframe refreshes every five minutes, offering granular insights. Each candlestick encapsulates a brief market narrative:
Green Candles: Indicate buyer dominance.
Red Candles: Signal seller control.
Interpreting these snapshots allows you to anticipate potential price movements with precision.
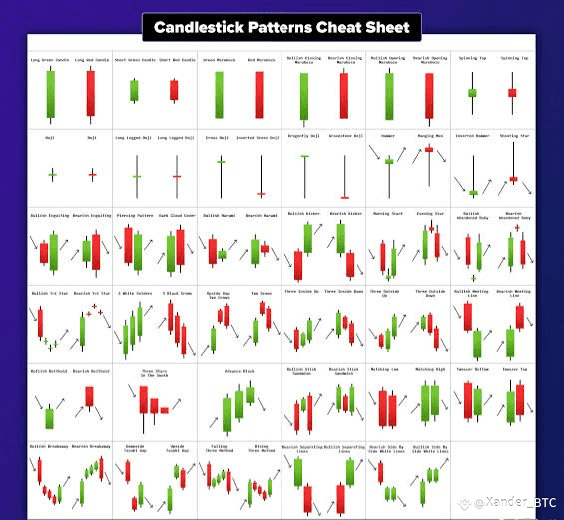
Three Proven Candlestick Patterns for Smart Trades ✨
🔄 The Equilibrium Pattern (Doji)
A cross-like formation signifying market indecision. It often precedes a reversal, alerting traders to shifting dynamics.
🔥 The Momentum Shift (Engulfing)
A larger candle fully encompasses the prior one.
- A substantial green engulfing a smaller red suggests bullish strength.
- A dominant red over a modest green implies bearish pressure.
📈 The Reversal Indicator (Hammer)
Features a long lower wick and compact body above, denoting a price dip followed by recovery—frequently forecasting upward momentum.
Execute Trades in Three Streamlined Steps 🎯
1. Access the 5-minute chart for a high-volume asset, such as a popular stock or forex pair.
2. Monitor for the emergence of a key pattern.
3. Enter the trade: Go long (buy) on bullish signals or short (sell) on bearish cues. Exit promptly to secure gains.
Building to $40: A Practical Breakdown 💰
- Identify a Hammer pattern → Enter long → Exit with +$12 profit.
- Detect a bearish Engulfing → Enter short → Exit with +$9 profit.
- Repeat across 3–4 opportunities → Achieve $40 in daily returns.
Note: Results vary based on market conditions and risk management. Trading involves inherent risks, including potential losses.
Ideal for Novice Traders 🌟
- Requires minimal advanced tools or software.
- Delivers rapid feedback within minutes.
- Relies on intuitive patterns accessible to all skill levels.
- Start with conservative position sizes to mitigate risks.
- Focus on peak liquidity periods, like market openings or closings.
- Rely on candlestick data to gauge real-time market sentiment.
Embrace this approach as a modern side hustle: consistent practice with these patterns can transform modest gains into sustainable income. Stay disciplined, educate yourself continuously, and watch your trading evolve. 🚀
