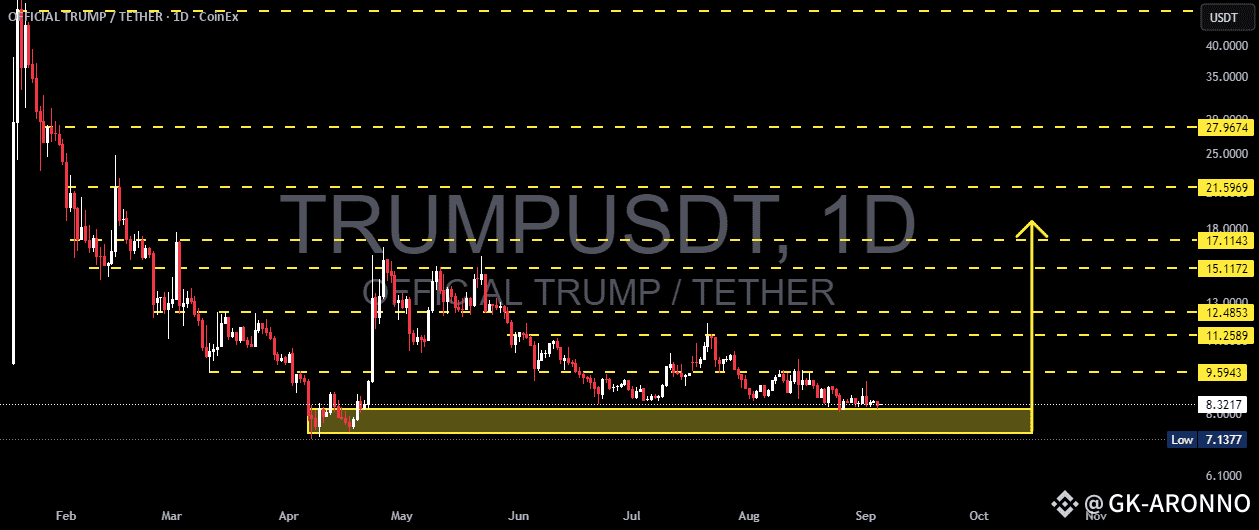
Currently, TRUMPUSDT is trading within the critical support range of $8.33 – $7.13, which has repeatedly acted as a strong demand zone since May. After a prolonged downtrend from its peak earlier this year, the market is now moving sideways, signaling a potential accumulation phase or preparation for the next major move.
---
🔎 Chart Structure & Pattern
Main trend: Long-term bearish since the peak.
Current phase: Sideways consolidation near a strong support zone.
Key support: $8.33 → $7.13 (demand zone).
Layered resistance levels: $9.59 → $11.25 → $12.48 → $15.11 → $17.11.
Major psychological targets: $21.59 and $27.96 if a strong reversal takes place.
---
✅ Bullish Scenario
1. If the price holds above $7.13 and forms a bullish reversal candle (pinbar, engulfing, or volume spike), a rebound is likely.
2. Short-term upside targets: $9.59 – $11.25.
3. A breakout above $12.48 with strong volume may push price toward $15.11 – $17.11.
4. A decisive breakout above $21.59 would confirm a long-term trend reversal with potential to reach $27.96+.
---
❌ Bearish Scenario
1. If the $7.13 support fails, selling pressure could intensify.
2. Next bearish target would be around $6.10 as a psychological support.
3. A breakdown below this zone may create a new lower low, extending the bearish trend.
---
📝 Conclusion
TRUMPUSDT is currently at a make-or-break zone.
As long as $7.13 holds, the possibility of a rebound toward key resistance levels remains strong.
However, a breakdown below this support would likely extend the bearish continuation.
📌 The best approach now is to wait for confirmation from price action at this crucial support level before positioning.
---