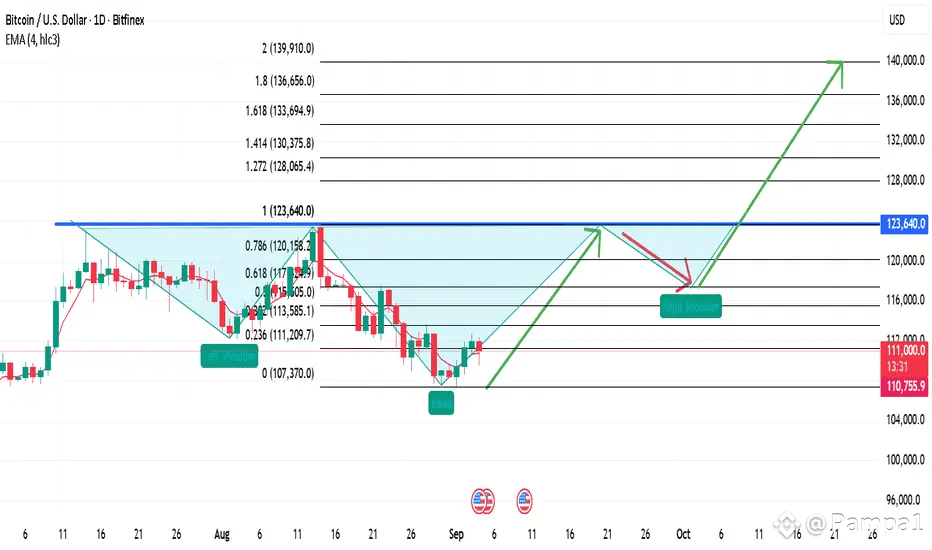
You’ll want to notice this right away: a TradingView chart has flagged an inverse head-and-shoulders pattern on BTC/USD and set a target between $139,000 and $140,000 . That setup usually signals a trend reversal, and seeing it at this scale gets your attention fast.
The formation—shoulder, head, shoulder—shows a dip followed by a deeper dip, and then a higher low. That structure often precedes a breakout. If Bitcoin clears the neckline (not shown on the snippet, but implied by the pattern), the path toward $140K opens. It’s not guaranteed. Patterns fail. Still, the symmetry here feels convincing. Momentum will need volume behind it to make a sustained push.
So here’s the point: Bitcoin might be shifting gears from consolidation to acceleration. Watch the next move. Will it turn into a real rally—or fizzle out before the neckline?