
Ethereum is trading at $4,385 as the heatmap indicates a range of $4,500, drawing the price towards bullish liquidity targets.
The buy/sell ratio at 1.01 indicates a bullish bias in futures, with traders watching for a breakout above the resistance area at $4,664.
ETH faces the risk of dropping to $3,626 if support fails at $4,211, although sustained demand could push the price near $4,957 ATH.
The leading alternative currency Ethereum has been trapped in a horizontal channel since August 12. Its price has fluctuated between resistance at $4,664 and support at $4,211, with traders waiting for a decisive breakout.
Now, with a liquidity pool building above its current price and an increase in concentration of futures traders leaning bullish, ETH appears set for a potential breakout in the near term.
ETH bulls hover around $4,500
According to Coinglass, the liquidation map $ETH shows a concentration of liquidity at the price area $4,520. For context, the alternative currency is currently trading at $4,385.
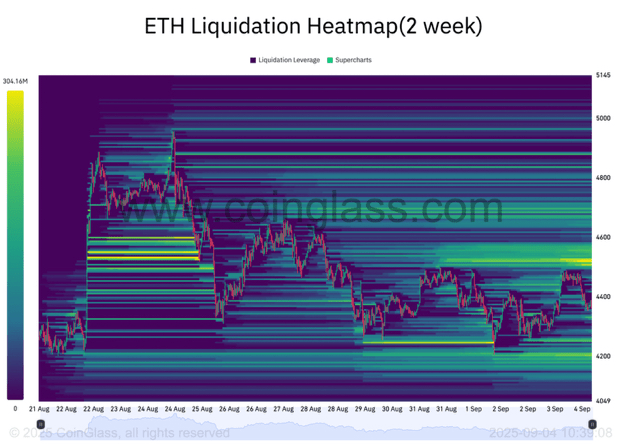
ETH Liquidation Map. Source: Coinglass
Liquidation maps are visual tools used by traders to identify price levels where large positions are likely to be liquidated. These maps highlight high liquidity areas, often color-coded to show density, with brighter areas representing greater potential for liquidation.
These price areas often act as magnets for price movement, as the market tends to move towards these areas to trigger liquidation and open new positions.
Therefore, for $ETH , the liquidity pool around the price area $4,500 suggests that its price may be pulled toward this level in the short term.
Furthermore, Coinglass data shows an increase in the ETH buy/sell ratio, indicating a stronger bullish sentiment among futures traders. At the time of publication, this ratio stands at 1.01.
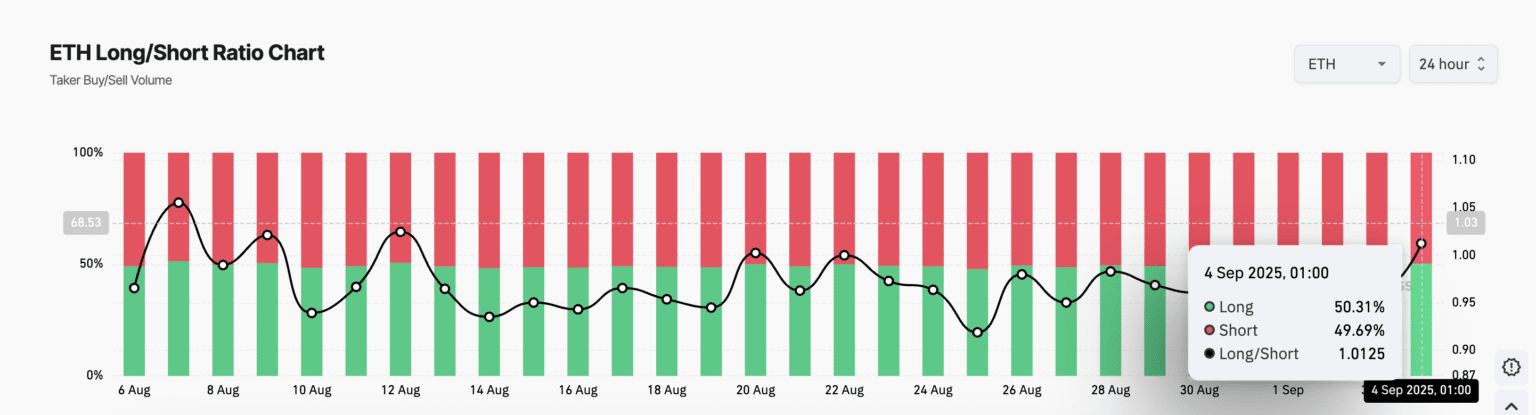
ETH Buy/Sell Ratio. Source: Coinglass
The buy/sell ratio measures the balance between traders holding bullish positions (buy) and bearish positions (sell) in the futures market. A reading above 1 indicates that more traders are betting on price increases, while a value below 1 suggests a stronger presence of bearish bets.
With the current $ETH ratio at 1.01, the market shows a slight but noticeable bias towards bullish expectations. This further confirms the potential for upward movement.
All-time high on the horizon if the bulls win this battle
If the upward momentum continues, Ethereum could break through the upper line of the horizontal channel, which forms resistance at $4,664. A breakout of this level could lead the currency to revisit its all-time high of $4,957.
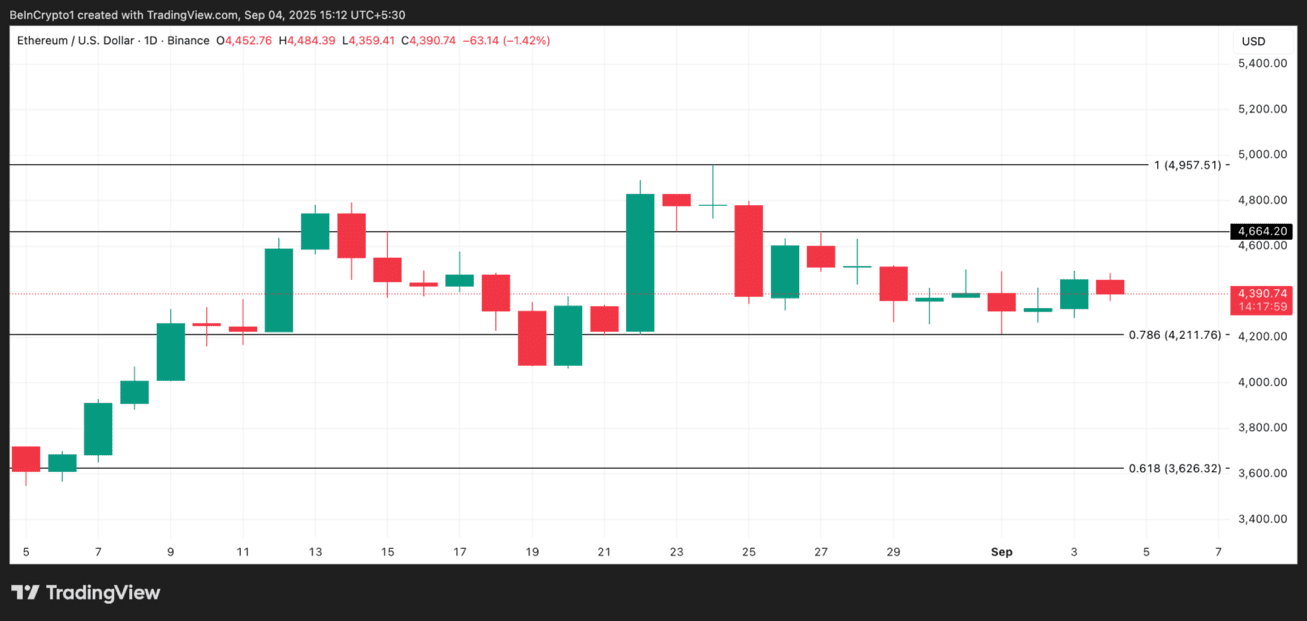
Ethereum Price Analysis. Source: TradingView
On the other hand, if demand drops and Ethereum falls below the support at $4,211, it could decline further to $3,626.
#ETH🔥🔥🔥🔥🔥🔥 #Ethereum #BinanceSquare #BinanceSquareFamily #Write2Earn