
Bitcoin is looking to retest the support of the downtrend line as Bitcoin's vaults absorb the selling pressure.
Ethereum is extending in a consolidation phase as open interest in futures cools amid declining retail demand.
XRP is currently holding its position between the support of the 100-day exponential moving average and the resistance of the 50-day exponential moving average, as risk-averse sentiment continues.
Bitcoin settles ($BTC ) above $110,000 on Thursday after its recovery was rejected mid-week at around $112,500. Ethereum (ETH) and Ripple (XRP) remain close to key support levels, extending the consolidation phase amid declining retail demand.
Data highlights: Bitcoin vaults accumulate despite volatility
Bitcoin vault balances have continued to grow month-over-month (MoM) this year, indicating steady demand despite price volatility. In total, Bitcoin vaults hold approximately 847,330 BTC valued at $93.9 billion. SoSoValue data indicates a weekly net flow of 1,100 BTC, worth about $122 million.
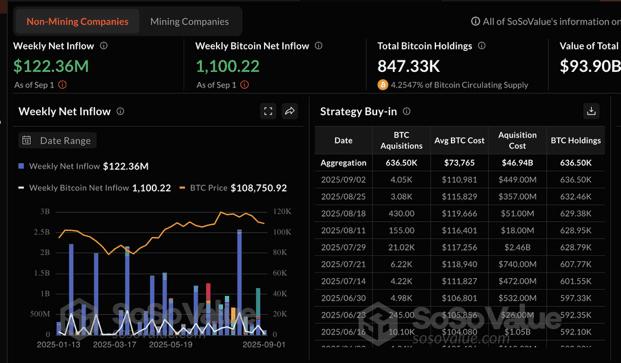
Bitcoin vaults | Source: CoinGlass
According to Sentora, "Stable accumulations indicate a persistent institutional conviction despite volatile market conditions."
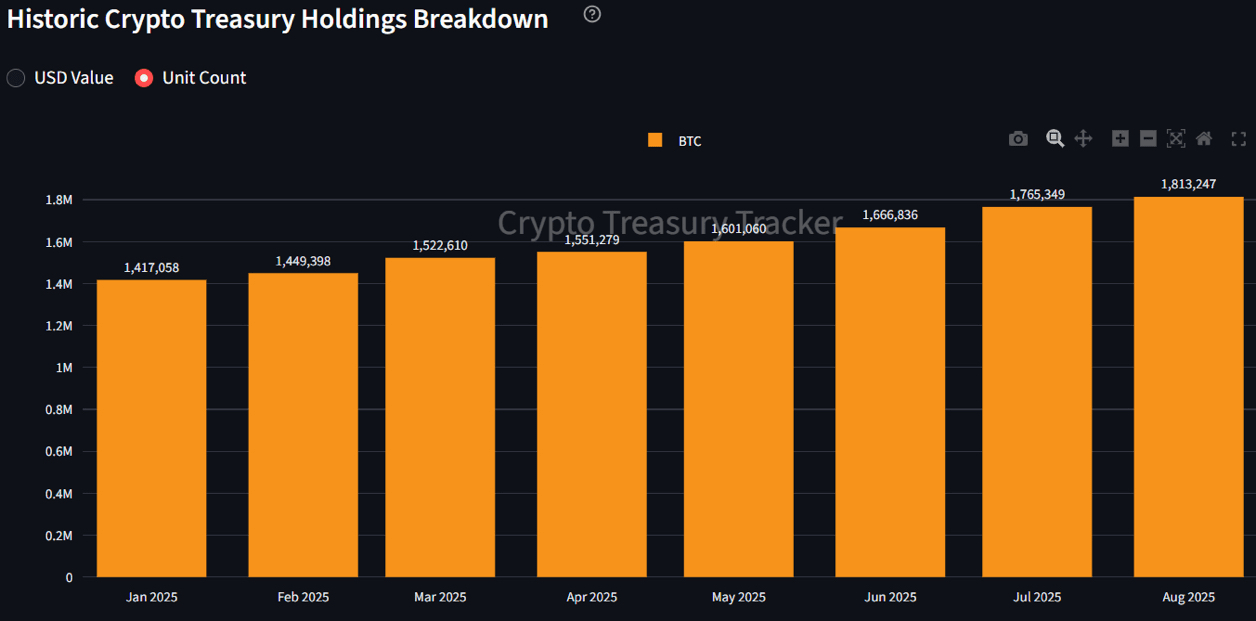
Monthly Bitcoin vault holdings | Source: Sentora
Glassnode data indicates that investors are increasingly seeking exposure during downturns, with support at $104,000 and resistance at $116,000. However, the decline in futures and demand for ETFs limits upward price movement.
A breakout above the resistance level could revive the upward trend, increasing the likelihood of Bitcoin price exceeding $120,000. However, a break below support at $104,000 could confirm the risks of a collapse towards the demand zone between $93,000 and $95,000.
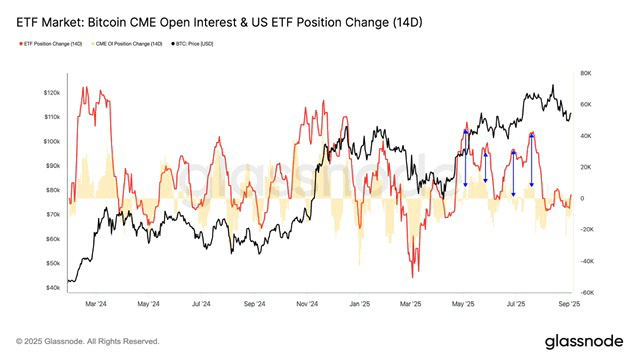
Bitcoin ETF market | Source: Glassnode
On the other hand, $ETH faces a significant decline in open interest for futures (OI), which, according to CoinGlass data, stands at $59 billion after peaking at a record $70 billion on August 24.
OI represents the nominal value of outstanding futures contracts. If the downward trend continues, it would imply declining retail demand due to a lack of conviction in resuming the upward trend towards its all-time high of $4,956.
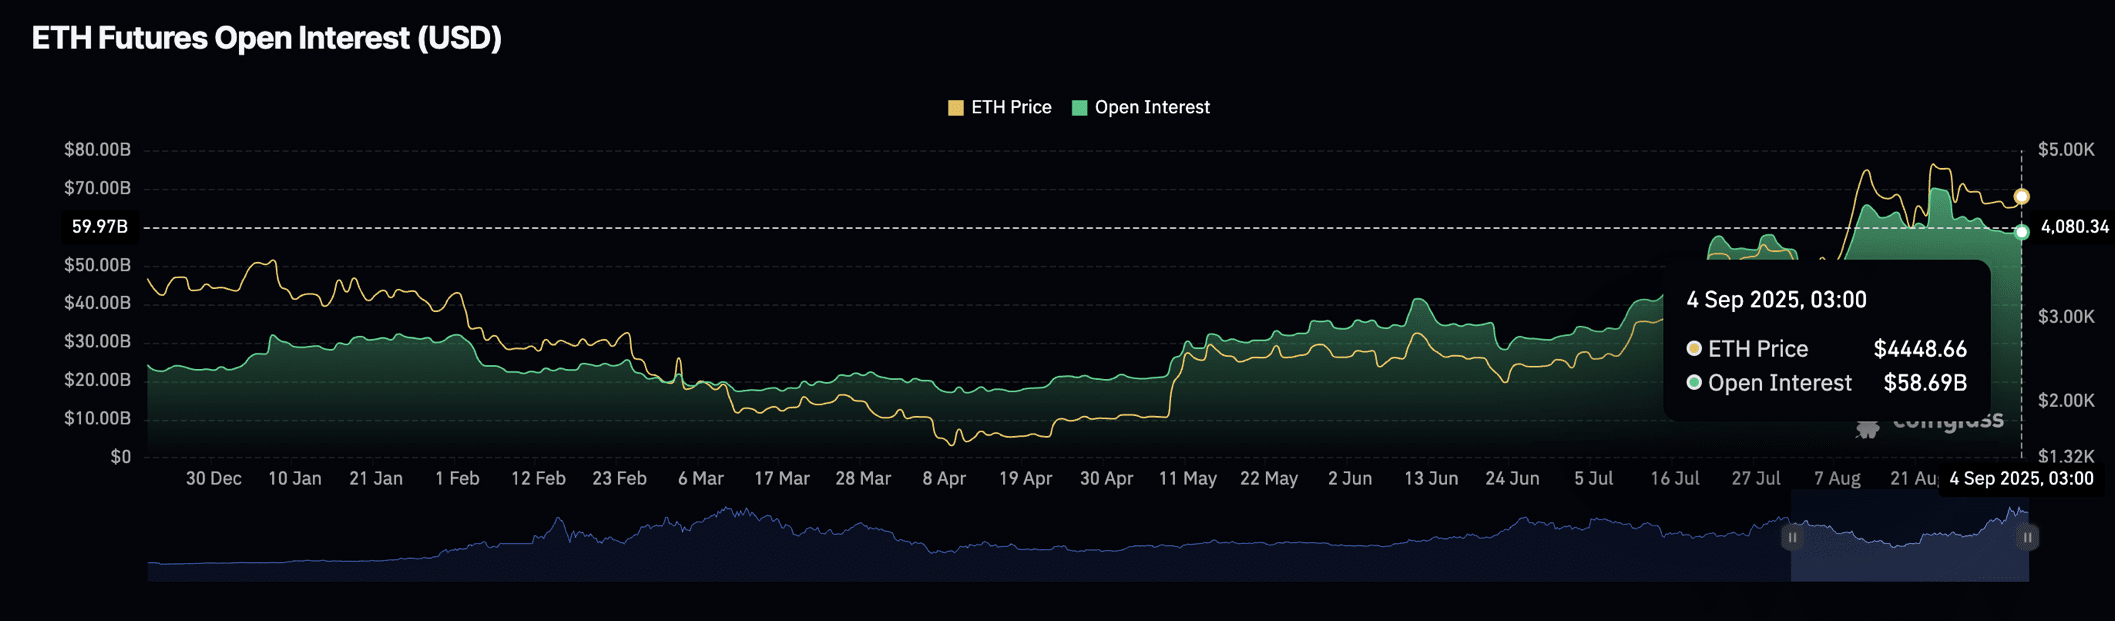
Open interest for Ethereum futures | Source: CoinGlass
XRP faces a similar situation with declining OI for futures at $7.61 billion after peaking at $10.94 billion on July 22. It will become increasingly difficult for XRP to maintain recovery amid declining retail demand. As a result, price volatility may persist longer than expected.
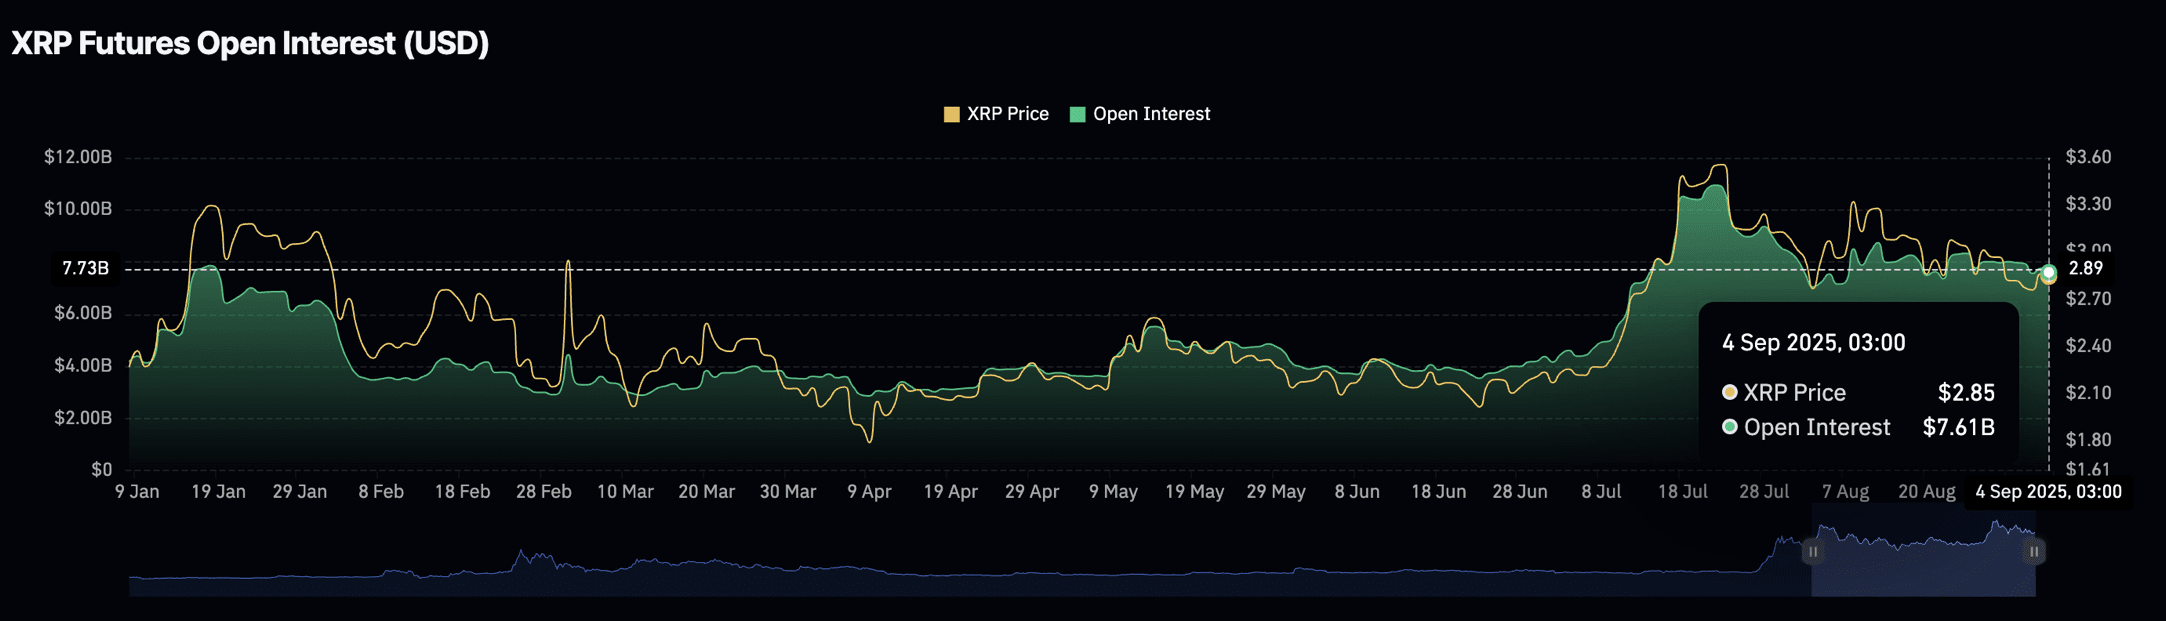
Open interest for XRP futures | Source: CoinGlass
Daily chart: Bitcoin looking to retest trendline
Bitcoin prices recently broke above trendline resistance but were rejected at around $112,500 on Wednesday. Currently, the price is positioned above support at the 100-day exponential moving average of $110,736.
A correction below the moving average could see Bitcoin retesting trendline support, which may confirm a breakout towards the round target at $116,000 and the critical level at $120,000.
The Relative Strength Index (RSI) at 44 supports declining demand. As the RSI decreases, buying pressure diminishes, making Bitcoin susceptible to further declines. A continued drop may lead traders to shift their attention to the 200-day exponential moving average at $104,314 as a potential support level.
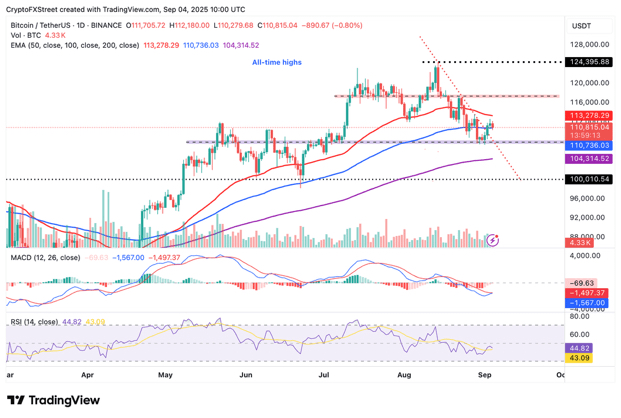
Daily chart for BTC/USDT
Altcoin update$: Ethereum and XRP extend consolidation
Ethereum stabilizes above $4,300 after bulls lost momentum below the $4,500 level on Wednesday. Based on the prevailing technical picture, the path of least resistance remains downward, reflecting risk-averse sentiment in the derivatives market.
The MACD indicator has maintained a sell signal since August 25, encouraging traders to reduce risk, with expectations of further price declines before gaining momentum for a stable recovery towards its all-time high of $4,956.
Traders should monitor Ethereum's price reaction to the ascending trendline illustrated in the daily chart below. Since then, the price has bounced off this line in early July, indicating a potential reversal if tested. Other key support levels include the 50-day exponential moving average at $4,044 and the 100-day exponential moving average at $3,566.
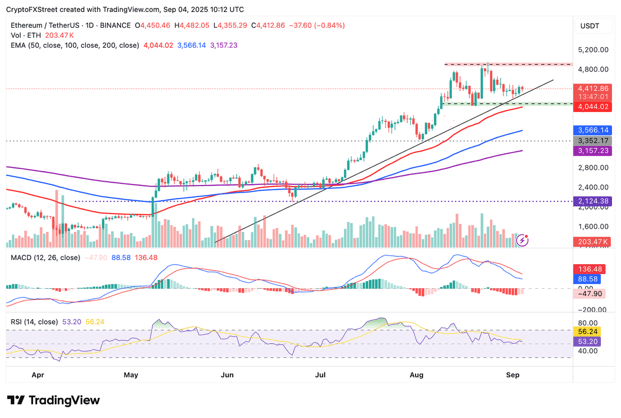
Daily chart for ETH/USDT
As for $XRP , its current position between support at the 100-day exponential moving average of $2.77 and resistance at the 50-day exponential moving average of $2.91 suggests an extended consolidation period before the next breakout. A sell signal from the MACD indicator since July 25 indicates a continued downward trend towards support at the 200-day exponential moving average of $2.51.
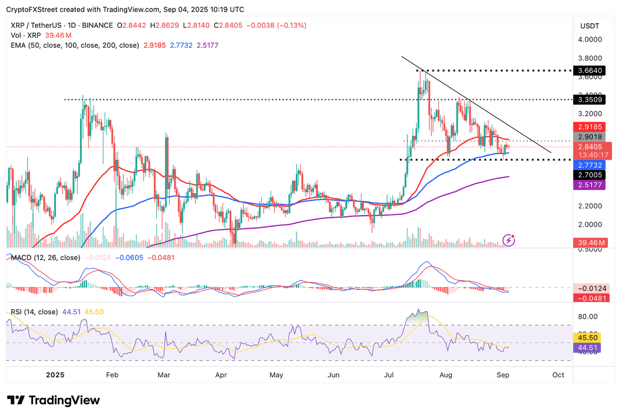
Daily chart for XRP/USDT
However, the stability of the Relative Strength Index (RSI) at 44 reflects the struggle between bulls and bears. If the RSI rises above the midpoint, buying pressure will increase, enhancing the chances of XRP reclaiming support at $3.00.
#BTC🔥🔥🔥🔥🔥 #ETH🔥🔥🔥🔥🔥🔥 #Xrp🔥🔥 #BinanceSquare #BinanceSquareFamily