---
🚀 Trader’s Eye on DOLO/USDT – 4H Chart Analysis 🚀
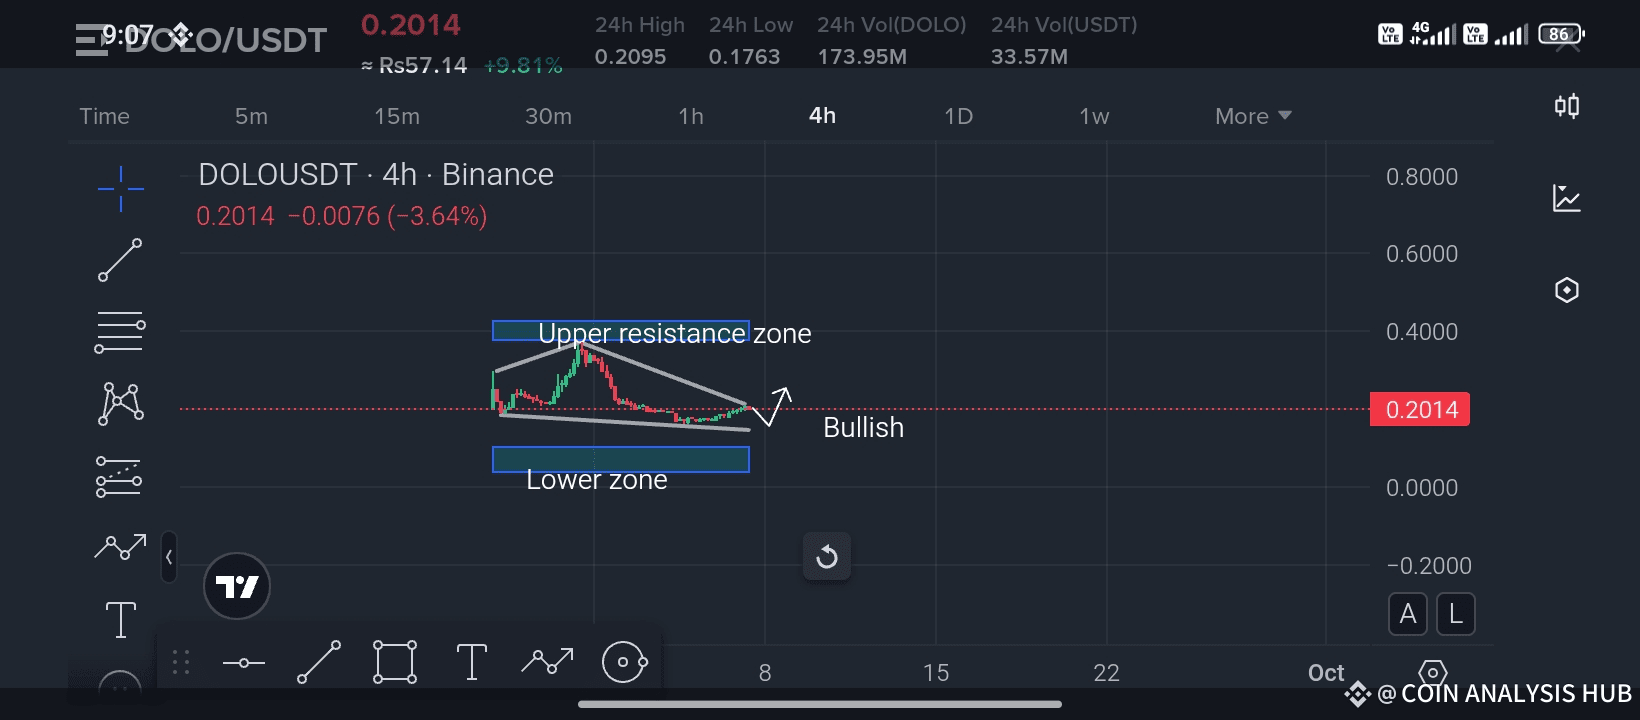
Currently, DOLO is trading around 0.2014, showing a small decline of -3.64% in the last 24 hours. However, when we look deeper into the chart structure, an interesting setup is forming that every trader should keep an eye on.
🔎 On the 4H timeframe, we can clearly see price consolidating between the Upper Resistance Zone and the Lower Zone. The market has been squeezing into a wedge-like structure, which often signals a potential breakout move.
✅ Bullish Outlook:
The recent candles show some buying pressure building near the lower zone.
Price action suggests that DOLO is trying to form a base before moving upward.
If the breakout happens above the upper resistance trendline, we could see momentum picking up strongly toward higher levels.
⚠️ Key Levels to Watch:
Support (Lower Zone): If DOLO holds above this zone, bullish sentiment remains intact.
Resistance (Upper Zone): A breakout above this level could trigger fresh buying interest.
📊 Trader’s Eyes View:
This pattern indicates accumulation, and if bulls manage to defend current levels, the next impulse could be bullish. Patience is key – waiting for confirmation on the breakout will be the safest strategy.
💡 Pro Tip for Traders:
Always remember – markets move in phases. Accumulation leads to breakout, and breakout leads to trend. Don’t chase candles blindly; wait for levels to confirm.
---
✨ If you find my analysis useful, don’t forget to LIKE, COMMENT, and SHARE this post with fellow traders.
📌 The more you interact, the more motivation I get to bring you timely updates and in-depth chart breakdowns.
✅ Also, FOLLOW my channel to stay updated with real-time technical insights and never miss a trading opportunity!
#ListedCompaniesAltcoinTreasury
Best of luck 🤞 🍀 🤞
