Last night, I casually threw my student notes into the group, and unexpectedly it went viral in half an hour! This made me realize that many new friends are still focused on the red and green fluctuations of candlesticks, but have not understood the underlying 'subtext'.
It's like watching a movie; if you don’t understand the visual language, you can only enjoy the spectacle. Candlesticks themselves do not 'predict the future'; they are more like a screen projecting the market maker's thoughts. Want to predict ups and downs based on a few candlesticks? Basically impossible. But as long as you can understand their 'codewords', you can avoid at least 80% of the pitfalls.
I have broken down the three most practical codewords, combined with painful lessons, for you:
Codeword One: False drop (false breakout, real washout)
This is the market maker's most insidious 'intimidation tactic'. The price suddenly crashes through a key support level, and the comments section explodes: 'It's broken! Run fast!' Retail investors panic and cut losses, while the market maker waits below to pick up cheap shares, pulling the price back up before the close, leaving those who cut losses behind.
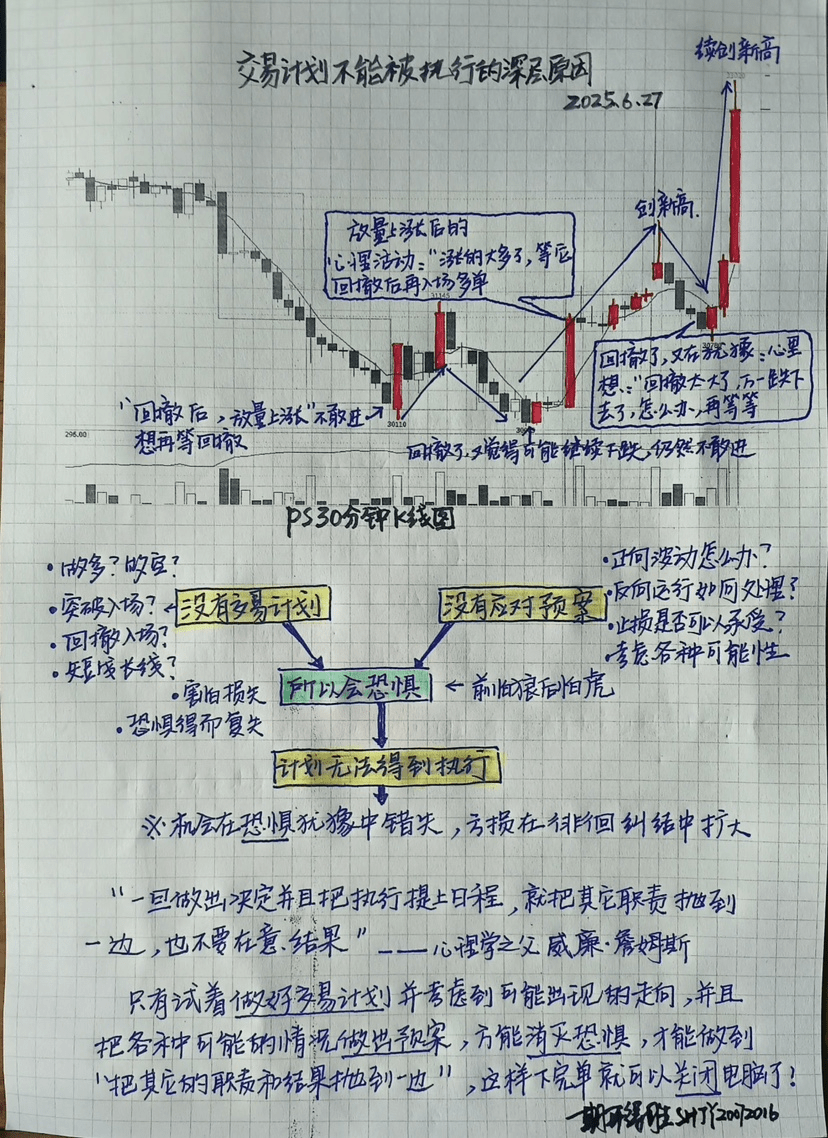
How to judge if it is a 'false drop'?
• Watch the closing: A temporary drop doesn't count; the key is whether the closing can return above the support level.
• Watch the trading volume: Increased volume when breaking down (creating panic), decreased volume during rebounds (market maker's self-directed performance).
Codeword Two: Divergence between price and volume (alarm bells ringing)
Price and trading volume are 'out of sync', indicating that the market is sending you a signal.
• New price high, new volume low: A typical 'false prosperity', without funds following, likely to drop later.
• Price is consolidating while volume is increasing: It is highly likely that the market maker is quietly accumulating shares, preparing for a rally.
My painful lessons: I once focused on a cryptocurrency that kept hitting new highs, but the volume kept shrinking. I held on out of hope and didn’t reduce my position, only to see a big bearish candlestick three days later, losing all my profits.
Codeword Three: High-level consolidation (not resting, but distributing shares)
Many people think consolidation is a 'halftime break', but in fact, the market maker is secretly 'dividing the spoils'.
• Bottom consolidation: Market maker accumulating shares, volume gently increasing, bearish candlestick is quickly swallowed by a bullish candlestick.
• High-level consolidation: Market maker distributing shares, volume gradually shrinking, bearish candlestick starts to 'reverse roles'. Once the holding volume surges, it indicates rapid turnover, and a significant drop may be imminent.
Remember, when looking at candlesticks, don’t just look at the ups and downs; you need to read the underlying intentions.
Next Step Recommendation:
• Review: Open your trading software and look for historical cases that match these three codewords.
• Practical: Next time you encounter a similar pattern, don’t act impulsively; calmly analyze against the checklist.
If you don’t want to keep going in circles in the market, often check my homepage where I will periodically break down the market maker's logic. Let’s open the subtitles of the candlesticks together, avoid pitfalls, and seize real opportunities.