What is MACD? Introduction to the three core components
MACD stands for Moving Average Convergence Divergence. It is primarily composed of three components: the fast line DIF, the slow line DEA, and the histogram. It helps investors capture changes in stock prices or asset prices, momentum strength, and potential buy/sell signals.
The MACD indicator is mainly composed of three core components, each with its own significance, allowing investors to clearly understand market dynamics.
Fast Line DIF (DIFferential Line) - Difference Value
DIF is the core fast line of MACD, primarily used to judge market short-term and long-term trend differences. The fast fluctuations of DIF also allow investors to capture more sensitive short-term changes. When DIF rises, it indicates that short-term momentum is strengthening; conversely, it indicates weakening.
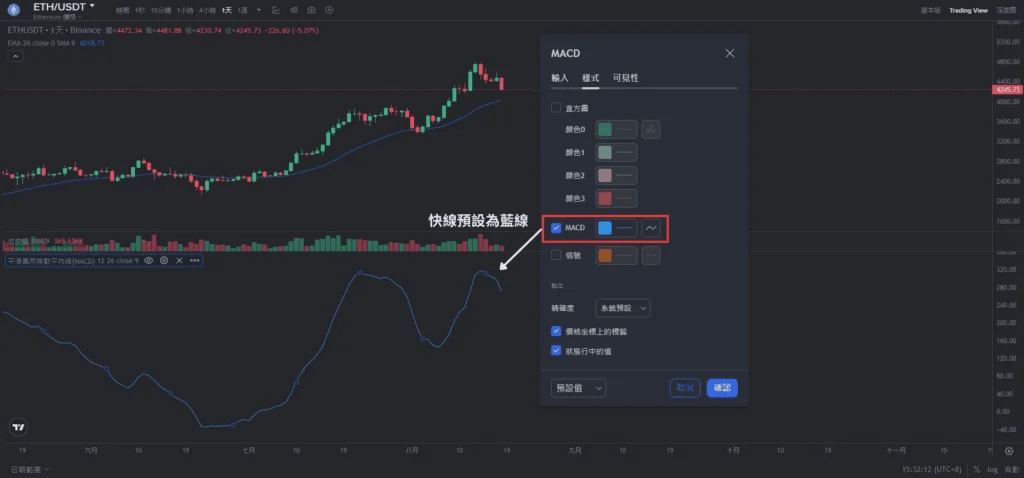
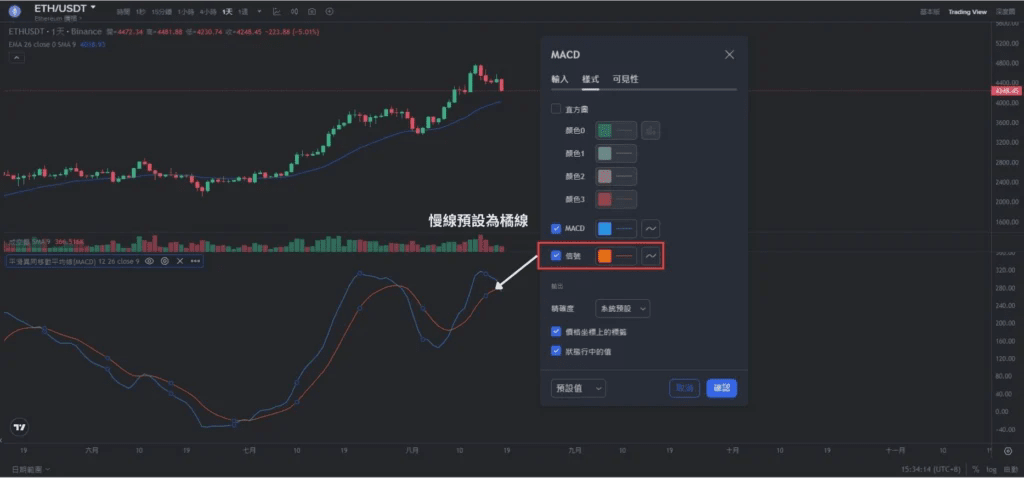
Slow line DEA (DIFference Exponential Average) - Signal line
The slow line DEA, also known as the Signal line, is usually smoother and helps investors filter out the noise of DIF, providing a more stable trend confirmation signal. When DIF crosses above DEA, it is often seen as a buy signal (golden cross); conversely, it is a sell signal (death cross).
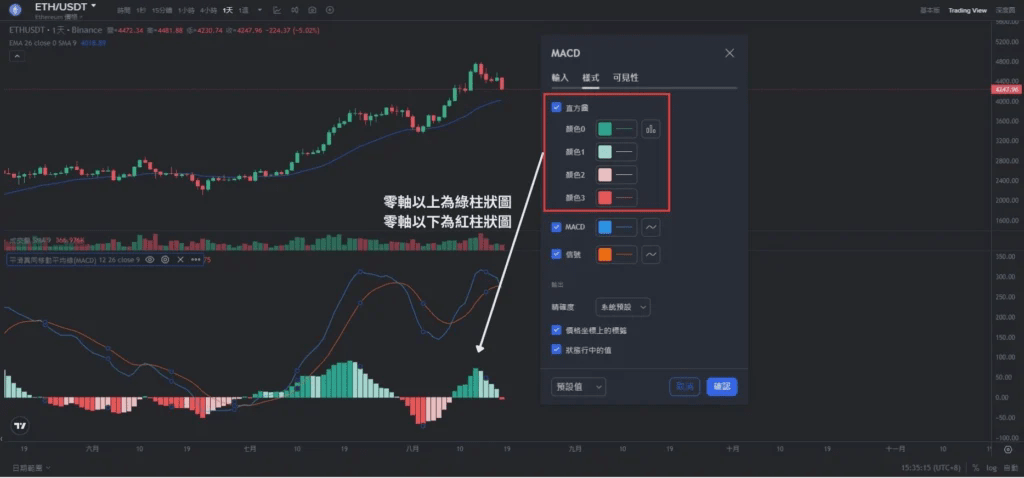
Energy Bar (Histogram)
The histogram is the bar chart part of MACD, derived from the fast line DIF minus the slow line DEA. The height of the histogram reflects the gap between the fast line and the slow line. When the positive histogram (above the zero axis) rises higher, it indicates that bullish momentum is strengthening. Conversely, when the negative histogram (below the zero axis) falls lower, it indicates that bearish momentum is strengthening. When the histogram converges gradually, it may indicate that the trend is about to reverse.
Detailed analysis of the MACD formula calculation
To fully understand the MACD indicator, one must first grasp the algorithm of its values and understand the results. The calculation of MACD primarily relies on the Exponential Moving Average (EMA) and derives DIF, DEA, and histogram through a series of simple mathematical formulas.
Introduction to EMA (Exponential Moving Average)
EMA, in Chinese, is known as the Exponential Moving Average. Unlike the Simple Moving Average (SMA), EMA gives more weight to recent price data, making it more sensitive to price changes.
The calculation formula for EMA is: [Today's closing price × α] + [Yesterday's EMA × (1 - α)]
Among them, α (smoothing factor) = 2 / (N + 1), where N is the selected period. For example, for the 12-period EMA, α = 2 / (12 + 1) ≈ 0.1538. When calculating EMA for the first time, if there is no previous day's EMA, the simple moving average (SMA) for that period can be used as the starting point. The sensitivity of EMA allows MACD to quickly reflect market dynamics.
Fast line DIF calculation method
DIF, as one of the cores of MACD, is calculated as: EMA(12) - EMA(26).
EMA 12 represents the short-term price trend (reacts faster), while EMA 26 represents the long-term trend (smoother). When the short-term EMA is above the long-term EMA, the DIF is positive, indicating that short-term momentum is stronger than long-term momentum, suggesting a bullish sentiment; conversely, when the DIF is negative, it suggests a bearish sentiment. The difference between them helps investors quickly assess the strength and direction of the trend.
Slow line DEA calculation method
DEA calculation method is: EMA(DIF, 9)
Such a calculation method further smooths the curve of DIF, reducing the interference of short-term price noise and providing a more stable trend indicator. The role of the DEA line is to form crossover signals with the DIF, for example, when the DIF crosses above the DEA line (golden cross), it is generally seen as a buy signal, while crossing below (death cross) is a sell signal.
Histogram calculation method
The histogram, as the only graphical representation of the MACD indicator, is calculated as: DIF - DEA
The histogram intuitively shows the gap between the fast line and the slow line. When DIF is greater than DEA, the histogram is positive, indicating that bullish momentum is strengthening; conversely, when the histogram is negative, it indicates that bearish strength is dominant.
Analysis of live examples of the MACD formula
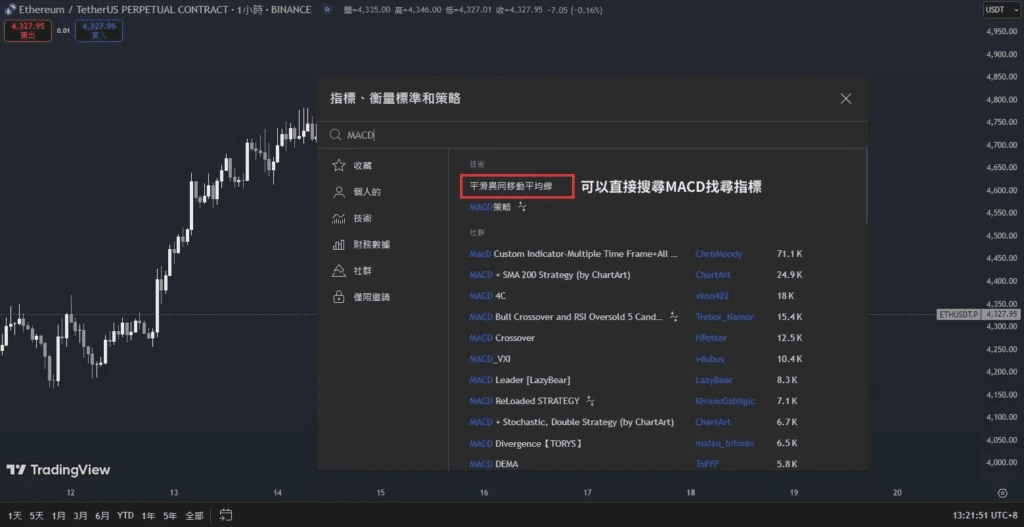
To better understand the calculation process of MACD in live trading, we will use the ETHUSDT chart on Binance for a MACD trial calculation.
Step one: Add EMA indicator
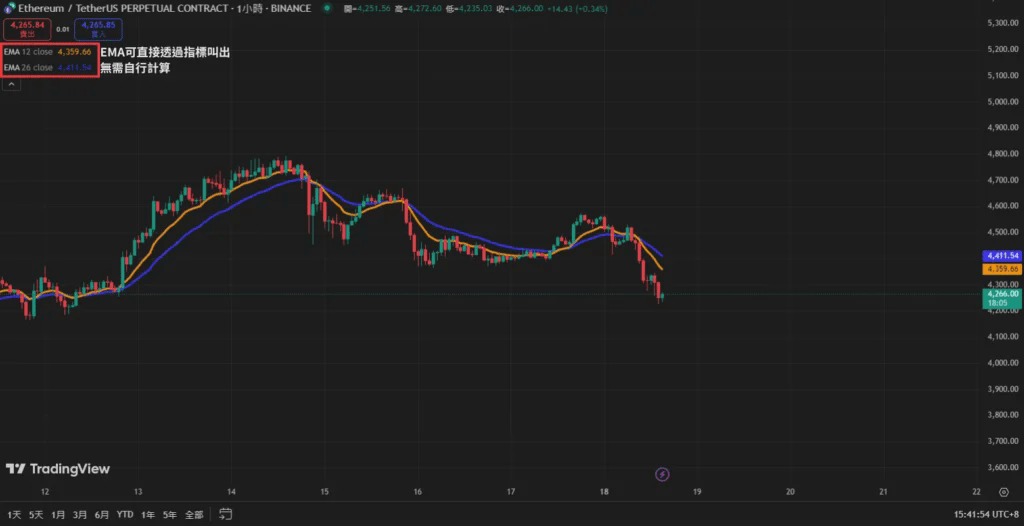
Since both the fast line and slow line in MACD calculations use the EMA indicator, we can directly add the EMA indicator and adjust the parameters to calculate the MACD-related parameters.
Step two: Calculate the fast line DIF in MACD
The calculation of the fast line DIF is EMA(12) - EMA(26), so we only need to set the two EMA indicators to 12 and 26 respectively and subtract them. For example, in the figure below, EMA 12 is 4271.55, and EMA 26 is 3941.88, subtracting gives 329.67, which is the same number displayed as the fast line DIF in MACD.
Step three: Calculate the slow line DEA in MACD
The formula for the slow line is: EMA(DIF, 9), where 9 represents the period. The calculation of EMA uses the smoothing factor α = 2 ÷ (9 + 1) = 0.2, thus the calculation formula for the slow line DEA in MACD is: [Today's DIF × 0.2] + [Yesterday's DEA × 0.8].
Today, DIF is 329.67, while yesterday's DEA was 250.86. Applying the calculation formula 329.67 * 0.2 + 250.86 * 0.8 = 266.62, this number is also the same as the slow line DEA displayed in MACD.
Step four: Calculate the histogram in MACD
As long as we solve the fast line and the slow line, calculating the histogram in MACD is very easy; we just need to subtract the slow line from the fast line. The calculated value of the fast line DIF is 329.67, while the slow line DEA is 266.62. Subtracting them gives us the histogram value of 63.05, thus obtaining all the data needed for the MACD indicator.

MACD Golden/Death Cross Cases
Golden crosses and death crosses are the most well-known trading signals in the MACD indicator. Many traders use golden crosses and death crosses to determine market trends.
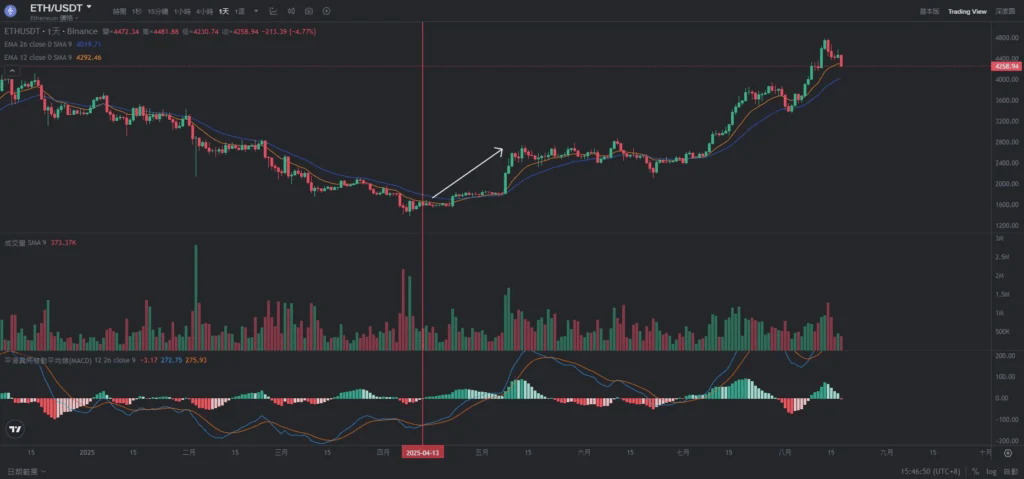
First, we can observe that on April 13, ETHUSDT's fast line DIF crossed above the slow line DEA, forming a valid golden cross, after which it continued to rise, even directly opening the Ethereum bull market.
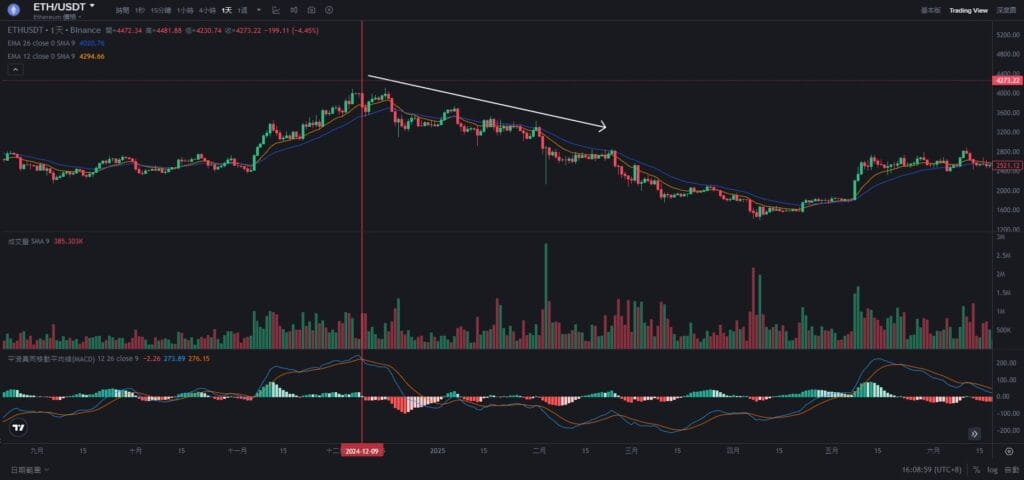
Looking back in time, we can see that on December 9, 2024, the MACD fast line crossed below the slow line, forming a death cross, and subsequently retraced over 60%. Investors who observed the MACD death cross at that time could avoid this decline or even take short positions.
Frequently Asked Questions
Why do some versions of the histogram appear multiplied by 2?
Some versions of MACD will double the height of the histogram; the purpose is to make the visual effect more apparent, allowing investors to more directly observe the changes in the gap between the fast line and the slow line.
Does a golden cross or death cross always lead to an increase or decrease?
Not necessarily. There is no indicator in financial markets that can guarantee an increase or decrease, and MACD is no exception. All indicators, including MACD, have a certain degree of lag, which may include noise; therefore, it is recommended to use them in conjunction with technical analysis or other indicators.
Can the parameters of MACD be modified?
The parameters of MACD can be modified according to personal preferences. For example, (5, 13, 5) is suitable for short-term trading, while (50, 200, 20) is more suitable for long-term trend analysis. However, modifying MACD parameters will affect the sensitivity of the indicator, so it is recommended to backtest historical data to find the most suitable settings.
Summary
This article analyzes the core of MACD, from the basic calculation of the EMA moving average to the three cores of fast line, slow line, and histogram, and combines the ETHUSDT chart to demonstrate the calculation process of deriving MACD values from EMA. However, the true value of the indicator lies in how to flexibly apply it and improve the win rate. Therefore, if you are keenly interested in MACD after reading this article, quickly open the MACD indicator and conduct in-depth review research!
This report is for informational sharing purposes only and does not constitute any form of investment advice or decision-making basis. The data, analysis, and views cited in the text are based on the author's research and public sources and may be subject to uncertainty or change at any time. Readers should make investment judgments prudently based on their own circumstances and risk tolerance. For further guidance, it is recommended to seek professional advice.
